Victoriametrics: Query results when: a) data backfilled b) with InfluxDB protocol c) with irregular intervals
Describe the bug
Getting "ghost" points near the end of query range
To Reproduce
# ingest data from the past with influx line protocol
curl -d 'test_2,tst=tst counter=1 1604926220000000000' -X POST 'http://localhost:8428/write'
curl -d 'test_2,tst=tst counter=2 1604926221000000000' -X POST 'http://localhost:8428/write'
curl -d 'test_2,tst=tst counter=3 1604926223000000000' -X POST 'http://localhost:8428/write'
curl -d 'test_2,tst=tst counter=4 1604926227000000000' -X POST 'http://localhost:8428/write'
curl -d 'test_2,tst=tst counter=5 1604926228000000000' -X POST 'http://localhost:8428/write'
curl -d 'test_2,tst=tst counter=6 1604926238000000000' -X POST 'http://localhost:8428/write'

# reset query cache
curl http://localhost:8428/internal/resetRollupResultCache

# get back data
curl 'http://localhost:8428/api/v1/query_range?query=test_2_counter&start=1604926165&end=1604926736&step=1'
Got:
{
  "status": "success",
  "data": {
    "resultType": "matrix",
    "result": [
      {
        "metric": {
          "__name__": "test_2_counter",
          "tst": "tst"
        },
        "values": [
          [
            1604926220,
            "1"
          ],
          [
            1604926221,
            "2"
          ],
          [
            1604926222,
            "2"
          ],
          [
            1604926223,
            "3"
          ],
          [
            1604926224,
            "3"
          ],
          [
            1604926225,
            "3"
          ],
          [
            1604926226,
            "3"
          ],
          [
            1604926227,
            "4"
          ],
          [
            1604926228,
            "5"
          ],
          [
            1604926229,
            "5"
          ],
          [
            1604926230,
            "5"
          ],
          [
            1604926231,
            "5"
          ],
          [
            1604926232,
            "5"
          ],
          [
            1604926233,
            "5"
          ],
          [
            1604926234,
            "5"
          ],
          [
            1604926235,
            "5"
          ],
          [
            1604926236,
            "5"
          ],
          [
            1604926237,
            "5"
          ],
          [
            1604926238,
            "6"
          ],
          [
            1604926239,
            "6"
          ],
          [
            1604926361,
            "6"
          ],
          [
            1604926362,
            "6"
          ],
          [
            1604926735,
            "6"
          ],
          [
            1604926736,
            "6"
          ]
        ]
      }
    ]
  }
}
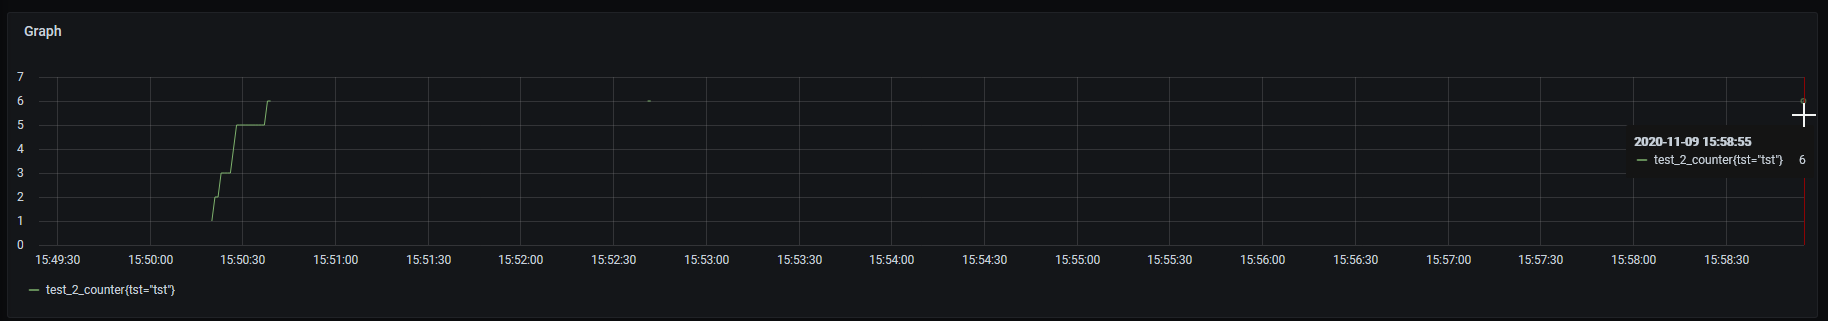
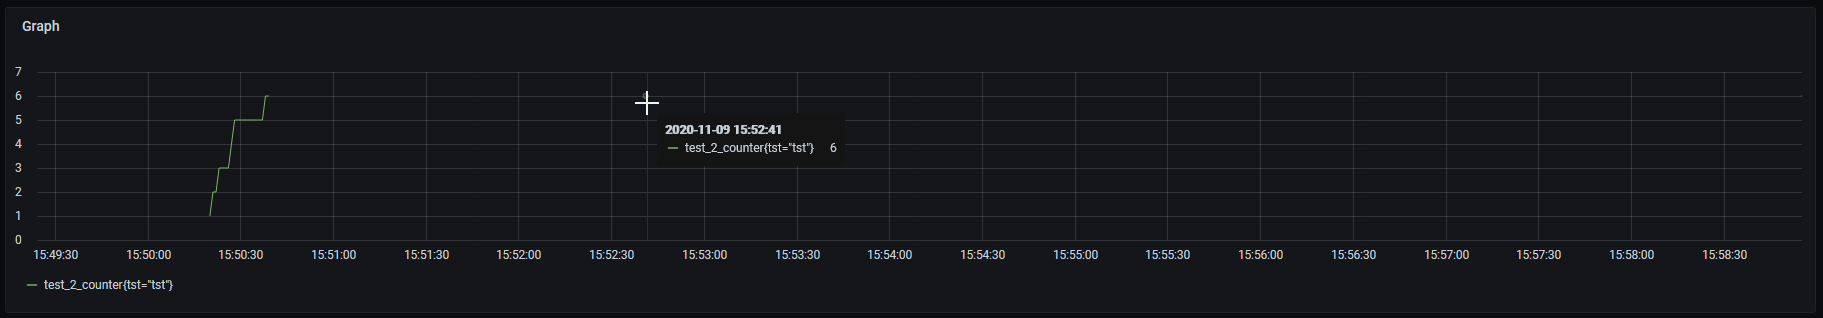
everything seems OK until this four:[1604926361,"6"],[1604926362,"6"],[1604926735,"6"],[1604926736,"6"] came in
It is looks like this at graphs:
Expected behavior
Either repeated last value until maxStalenessInterval/minStalenessInterval or no values after last one?
May be i don't understand something and this is expected behavior?
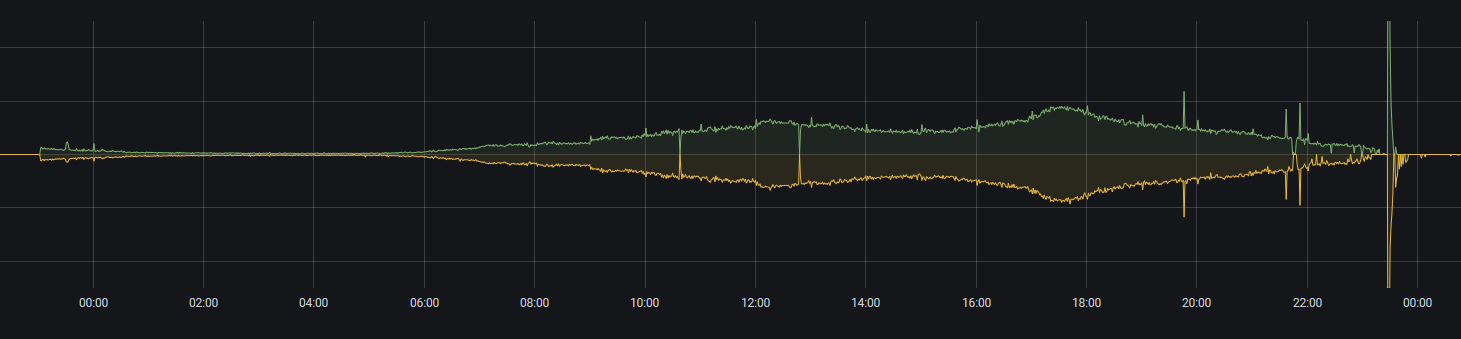
Screenshots
This is how it is shows on more "real world" data (artifact is large spike at the end, graph is irate(some_counter)):
Version
$victoria-metrics-prod --version
victoria-metrics-20201107-155439-tags-v1.46.0-0-g41813eb87
looks like this was introduced somewhere between 1.35 and 1.45 (found this after upgrade)
may be this #784 is related?
Used command-line flags
/usr/local/bin/victoria-metrics-prod --storageDataPath=/victoria/data --retentionPeriod=48 --search.maxStalenessInterval=6h --search.minStalenessInterval=2h
Additional context
My use case may be little bit "exotic", i have unpredictable number of metrics pushed to VM with irregular intervals and sometimes this metrics may be from the past (up to weeks) that is why mint/maxStalenessInterval is used
 imorph
All 6 comments
You don't need -search.minStalenessInterval and -search.maxStalenessInterval command-line options for querying backfilled data, since these options have completely different purpose (see ./victoria-metrics -help output):
-search.maxStalenessInterval duration
The maximum interval for staleness calculations. By default it is automatically calculated from the median interval between samples. This flag could be useful for tuning Prometheus data model closer to Influx-style data model. See https://prometheus.io/docs/prometheus/latest/querying/basics/#staleness for details. See also '-search.maxLookback' flag, which has the same meaning due to historical reasons
-search.minStalenessInterval duration
The minimum interval for staleness calculations. This flag could be useful for removing gaps on graphs generated from time series with irregular intervals between samples. See also '-search.maxStalenessInterval'
You need either -search.disableCache or -search.cacheTimestampOffset command-line flags. See their descriptions below:
-search.cacheTimestampOffset duration
The maximum duration since the current time for response data, which is always queried from the original raw data, without using the response cache. Increase this value if you
see gaps in responses due to time synchronization issues between VictoriaMetrics and data sources (default 5m0s)
-search.disableCache
Whether to disable response caching. This may be useful during data backfilling
 valyala
on 10 Nov 2020
valyala
on 10 Nov 2020
@valyala thanks for quick response!
I need to "tune" staleness not because of back-filling, but because of irregularity.
I do not have regular scrape intervals, some of my counters are updated hundreds times per minute, others may be updated three times a day (and then suddenly they switch to hundreds/s at black Friday). Counters updated and pushed to me and i do not control schedule of "pushes". So max/min staleness intervals reflect my experiments to adapt to nature of my data. I used to have also query cache disabled but it seems not affecting issue that i described.
edit: typos
imorph
on 10 Nov 2020
@imorph , could you try building victoriametrics from the commit 47390d89475eb510a5cb8a851cdf7584ce3488a9 and verifying whether it works as expected for your use case? I'd recommend passing -search.disableCache command-line argument to VictoriaMetrics for the case when data with timestamps older than a few days or weeks is periodically ingested into VictoriaMetrics. See build instructions for VictoriaMetrics.
valyala
on 10 Nov 2020
@valyala, i confirm that on victoria-metrics-20201110-150855-tags-v1.46.0-9-g47390d89 i don't see extra points on right end of query range.
Спасибо!
imorph
on 11 Nov 2020
Then the commit https://github.com/VictoriaMetrics/VictoriaMetrics/commit/47390d89475eb510a5cb8a851cdf7584ce3488a9 will be included in the next release of VictoriaMetrics.
valyala
on 13 Nov 2020
The commit mentioned above has been included in v1.47.0. Closing the issue as fixed.
valyala
on 16 Nov 2020
Related issues
 ozn0417
·
3Comments
ozn0417
·
3Comments
 genericgithubuser
·
4Comments
genericgithubuser
·
4Comments
 localpref
·
3Comments
localpref
·
3Comments
 isality
·
3Comments
isality
·
3Comments
 prdatur
·
3Comments
prdatur
·
3Comments