Victoriametrics: VMAgent Crash with `slice bounds out of range`
Describe the bug
When deploying vmagent with operator on k8s, the pod runs into CrashLoopBackOff with a slice bounds out of range error.
To Reproduce
Not sure of the cause.
Cluster situation:
- servicemonitors are in various namespaces, some are duplicated in multiple namespaces.
- vmagent spec:
serviceScrapeNamespaceSelector: {}
podScrapeNamespaceSelector: {}
podScrapeSelector: {}
serviceScrapeSelector: {}
Expected behavior
vmagent should continue to run even in case some targets does not expose metrics in the defined ports.
Screenshots
If applicable, add screenshots to help explain your problem.
Version
Versions tried, and faced same issue:
1.43.0-cluster
1.44.0-cluster
Used command-line flags
NA
Logs
...
...
2020-10-28T06:33:57.032Z    error   VictoriaMetrics/lib/promscrape/scrapework.go:199    error when scraping "http://10.140.54.70:4001/metrics" from job "service1" with labels {endpoint="metrics", instance="10.140.54.70:4001", job="service1", namespace="namespace1", pod="service1-7cb75f459-hshhc", pod_name="service1-7cb75f459-hshhc", prometheus="victoria-metrics/example-vmagent", service="service1"}: error when scraping "http://10.140.54.70:4001/metrics": dial tcp4 10.140.54.70:4001: connect: connection refused
2020-10-28T06:33:57.084Z    error   VictoriaMetrics/lib/promscrape/scrapework.go:199    error when scraping "http://10.140.79.129:9001/metrics" from job "service2" with labels {endpoint="metrics", instance="10.140.79.129:9001", job="service2", namespace="namespace2", pod="service2-57698bf4fc-jq6zb", pod_name="service2-57698bf4fc-jq6zb", prometheus="victoria-metrics/example-vmagent", service="service2"}: error when scraping "http://10.140.79.129:9001/metrics": dial tcp4 10.140.79.129:9001: connect: connection refused
2020-10-28T06:33:57.266Z    error   VictoriaMetrics/lib/promscrape/scrapework.go:199    error when scraping "http://10.140.50.75:8000/metrics" from job "service3" with labels {endpoint="metrics", instance="10.140.50.75:8000", job="service3", namespace="namespace3", pod="service3-dd6c8dcbf-xf2x8", pod_name="service3-dd6c8dcbf-xf2x8", prometheus="victoria-metrics/example-vmagent", service="service3"}: unexpected status code returned when scraping "http://10.140.50.75:8000/metrics": 404; expecting 200; response body: ""
panic: runtime error: slice bounds out of range [138:128]

goroutine 3401 [running]:
github.com/VictoriaMetrics/VictoriaMetrics/lib/promscrape.(*client).ReadData(0xc002bdbef0, 0xc00010cd00, 0x80, 0x100, 0xc0023207e0, 0x1, 0x1, 0x8, 0xc0023207e0)
    github.com/VictoriaMetrics/VictoriaMetrics/lib/promscrape/client.go:157 +0x128a
github.com/VictoriaMetrics/VictoriaMetrics/lib/promscrape.(*scrapeWork).scrapeInternal(0xc002eb65a0, 0x1756de9c0f1, 0x1756de9c0f1, 0xc000100000, 0xc001a58698)
    github.com/VictoriaMetrics/VictoriaMetrics/lib/promscrape/scrapework.go:215 +0x82
github.com/VictoriaMetrics/VictoriaMetrics/lib/promscrape.(*scrapeWork).scrapeAndLogError(0xc002eb65a0, 0x1756de9c0f1, 0x1756de9c0f1)
    github.com/VictoriaMetrics/VictoriaMetrics/lib/promscrape/scrapework.go:198 +0x5a
github.com/VictoriaMetrics/VictoriaMetrics/lib/promscrape.(*scrapeWork).run(0xc002eb65a0, 0xc001276c60)
    github.com/VictoriaMetrics/VictoriaMetrics/lib/promscrape/scrapework.go:172 +0x3b7
github.com/VictoriaMetrics/VictoriaMetrics/lib/promscrape.(*scraperGroup).update.func1(0xc001043680, 0xc002eb65a0, 0xc004b4bdb0)
    github.com/VictoriaMetrics/VictoriaMetrics/lib/promscrape/scraper.go:290 +0x69
created by github.com/VictoriaMetrics/VictoriaMetrics/lib/promscrape.(*scraperGroup).update
    github.com/VictoriaMetrics/VictoriaMetrics/lib/promscrape/scraper.go:288 +0x409
 pmitra43
All 7 comments
Also getting same error after a different last log:
...
...
2020-10-28T07:24:17.435Z    error   VictoriaMetrics/lib/promscrape/scrapework.go:199    error when scraping "http://10.140.90.84:4001/actuator/prometheus" from job "service4" with labels {endpoint="metrics", instance="10.140.90.84:4001", job="service4", namespace="namespace4", pod="service4-589b59bb76-hgpp8", prometheus="victoria-metrics/example-vmagent", service="service4"}: error when scraping "http://10.140.90.84:4001/actuator/prometheus": dial tcp4 10.140.90.84:4001: connect: connection refused
panic: runtime error: slice bounds out of range [138:128]

goroutine 3461 [running]:
github.com/VictoriaMetrics/VictoriaMetrics/lib/promscrape.(*client).ReadData(0xc002ab86e0, 0xc0034af600, 0x80, 0x100, 0xc001c2ff88, 0x1, 0x1, 0x8, 0xc001c2ff88)
    github.com/VictoriaMetrics/VictoriaMetrics/lib/promscrape/client.go:157 +0x128a
github.com/VictoriaMetrics/VictoriaMetrics/lib/promscrape.(*scrapeWork).scrapeInternal(0xc002af17a0, 0x1756e17d777, 0x1756e17d777, 0xc000088c00, 0xc0000b8000)
    github.com/VictoriaMetrics/VictoriaMetrics/lib/promscrape/scrapework.go:215 +0x82
github.com/VictoriaMetrics/VictoriaMetrics/lib/promscrape.(*scrapeWork).scrapeAndLogError(0xc002af17a0, 0x1756e17d777, 0x1756e17d777)
    github.com/VictoriaMetrics/VictoriaMetrics/lib/promscrape/scrapework.go:198 +0x5a
github.com/VictoriaMetrics/VictoriaMetrics/lib/promscrape.(*scrapeWork).run(0xc002af17a0, 0xc00346fc80)
    github.com/VictoriaMetrics/VictoriaMetrics/lib/promscrape/scrapework.go:172 +0x3b7
github.com/VictoriaMetrics/VictoriaMetrics/lib/promscrape.(*scraperGroup).update.func1(0xc0003d23c0, 0xc002af17a0, 0xc003d048b8)
    github.com/VictoriaMetrics/VictoriaMetrics/lib/promscrape/scraper.go:290 +0x69
created by github.com/VictoriaMetrics/VictoriaMetrics/lib/promscrape.(*scraperGroup).update
    github.com/VictoriaMetrics/VictoriaMetrics/lib/promscrape/scraper.go:288 +0x409
Version currently used: 1.43.0-cluster
pmitra43
on 28 Oct 2020
Commit https://github.com/VictoriaMetrics/VictoriaMetrics/commit/67059caa1240fa253d437e216aa411cbf9a179e9 fixes this bug, it will be included at the nearest release.
 f41gh7
on 29 Oct 2020
f41gh7
on 29 Oct 2020
FYI, the bugfix has been included in v1.45.0. @pmitra43 , could you confirm that the issue has been fixed in this release?
 valyala
on 2 Nov 2020
valyala
on 2 Nov 2020
@valyala confirmed, the issue is fixed in v1.45.0. Thanks!
pmitra43
on 2 Nov 2020
Hello @valyala @f41gh7, I am seeing a significant surge in vmagent memory after upgrading to 1.45.0.
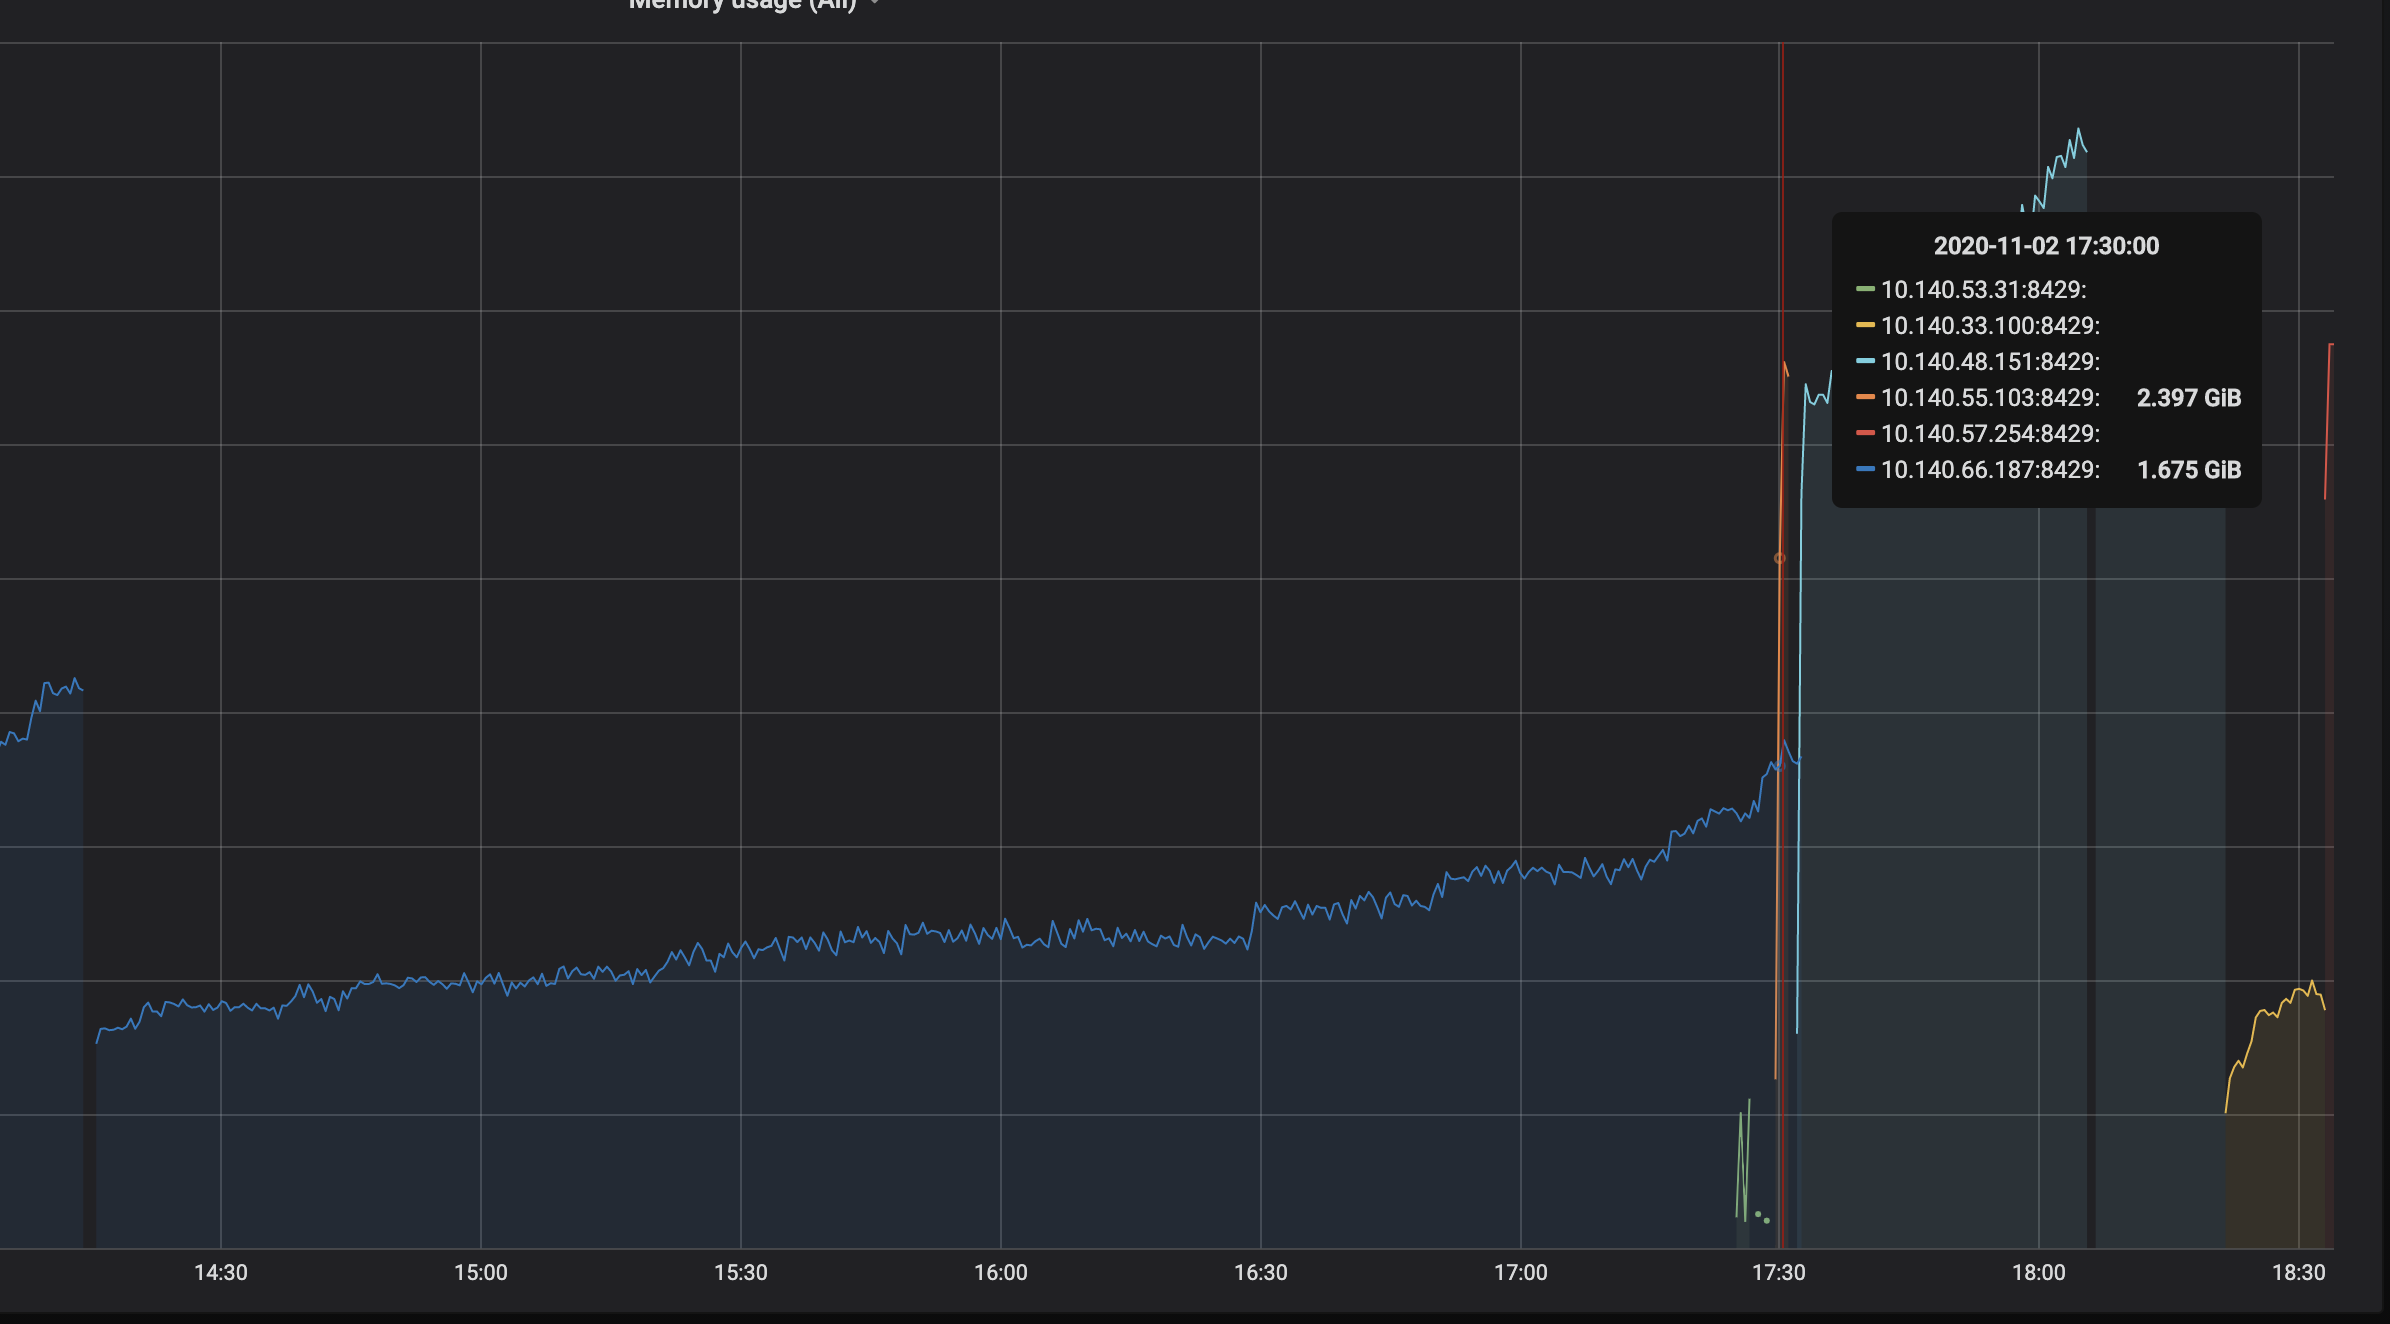
Here, the light blue lines is when I upgraded to 1.45.0. The dark blue represents memory when running 1.41.0.
pmitra43
on 2 Nov 2020
@pmitra43 , could you file a separate issue about memory usage? It would be great if you could share memory profile for vmagent v1.45.0 when it uses big amounts of memory. See these docs on how to collect memory profile.
valyala
on 2 Nov 2020
Sure. I will open a new issue. This issue can be closed. Thanks! 😄
pmitra43
on 3 Nov 2020
Related issues
 oOHenry
·
4Comments
oOHenry
·
4Comments
 0xBF
·
3Comments
0xBF
·
3Comments
 localpref
·
3Comments
localpref
·
3Comments
 jelmd
·
3Comments
jelmd
·
3Comments
 prdatur
·
3Comments
prdatur
·
3Comments
Most helpful comment
Commit https://github.com/VictoriaMetrics/VictoriaMetrics/commit/67059caa1240fa253d437e216aa411cbf9a179e9 fixes this bug, it will be included at the nearest release.