Victoriametrics: vmagent: memory overlimit in porto
Hi.
We trying to migrate vmagent from bare metal server to porto container: https://github.com/yandex/porto/
On bare metal we have 128 GB ram, and running vmagent with -memory.allowedPercent=60 option, and normally it uses up to 32 GB after some days from start. After 30 minutes from start it consumes about 15 GB.
In porto we giving 64 GB ram for container, and try to run vmagent with all the same options, and less than a minute after start it killing with OOM with exhause all ram. In some reason vmagent trying to allocate too much memory. Also I tried to run vmagent with -memory.allowedBytes=12884901888 (12 GB) option, and it had no effect: the same OOM after few seconds from start.
In both cases used last version of vmagent: 1.43.0. All options are the same:
-enableTCP6 \
-promscrape.config=/etc/scrape.yml \
-remoteWrite.url=<url_1> \
-remoteWrite.url=<url_2> \
-remoteWrite.url=<url_3> \
-remoteWrite.url=<url_4> \
-remoteWrite.label=prom_cluster=production \
-promscrape.config.strictParse \
-remoteWrite.maxDiskUsagePerURL=1000000000 \
-memory.allowedPercent=60 \
-promscrape.consulSDCheckInterval=60s \
-promscrape.discovery.concurrency=30 \
-remoteWrite.tmpDataPath=/tmp/vmagent-remotewrite-data \
-remoteWrite.showURL=true \
-promscrape.suppressScrapeErrors=true \
-remoteWrite.queues=3
I collected memory profile of vmagent right before OOM in porto, when it reaches about ~64 GB of ram, and sent it to [email protected]
Can you please see what the problem might be?
 wf1nder
All 34 comments
The provided memory profile shows that the majority of memory is consumed during parsing Prometheus data obtained from scrape targets. It is likely vmagent scrapes targets with millions exposed metrics per each target with big number of labels. This case isn't optimized well yet, since vmagent reads all the scraped contents in memory and then parses it in memory in one go instead of using streaming. The workaround is to push data to vmagent via any supported data ingestion protocol. For instance, via Prometheus exposition format. These data ingestion protocols parse data in batches (aka in stream manner), so vmagent can accept unlimited amounts of data per single request/connection without significant memory usage.
Could you verify that vmagent properly detects available CPU cores in porto? The number of detected CPU cores should be exported as go_gomaxprocs metric at http://vmagent:8429/metrics page. vmagent can use more memory if it improperly detects available CPU cores, since it keeps per-CPU datastructures when parsing Prometheus data from scrape targets.
 valyala
on 17 Oct 2020
valyala
on 17 Oct 2020
Thanks for the answer.
First of all I wanted to understand why vmagent consumes different amount of memory in different environments. Your assumption about GOMAXPROCS definitely make sense.
On bare metal we have 32 virtual cores, and vmagent properly detects this value. In porto cloud the process sees all the host machine cores, we can only hard-limit cpu consumption by throttling, specifying it by virtual megahertz. So in proto process see 104 virtual cores in our case.
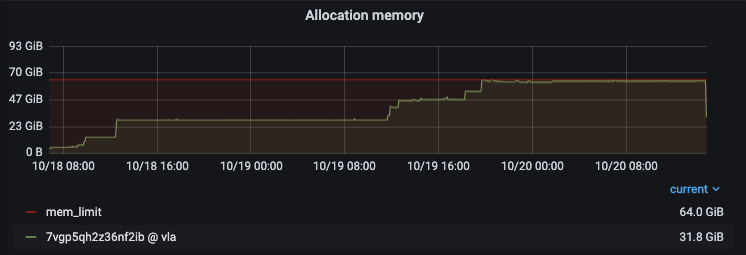
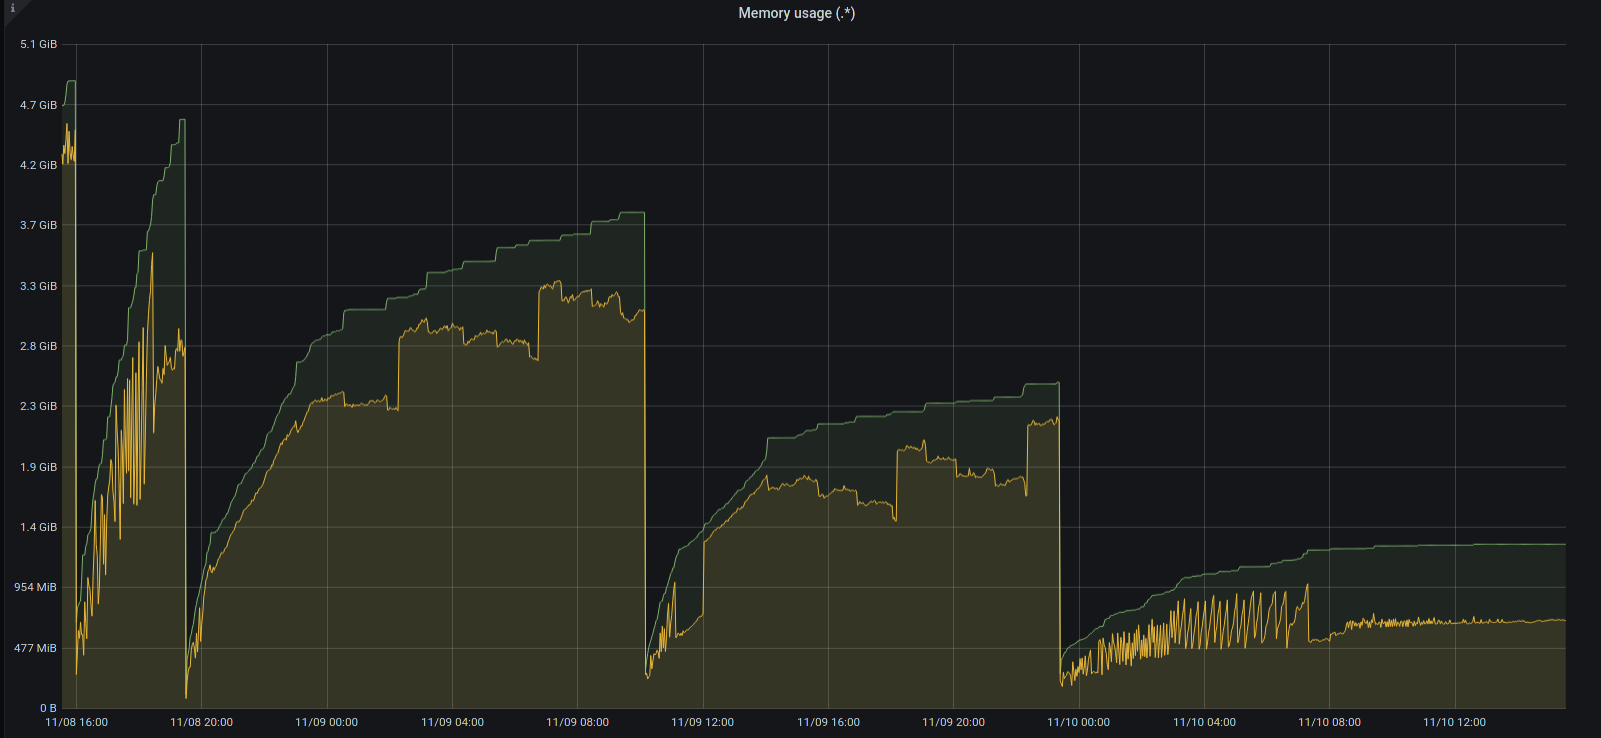
I set env var GOMAXPROCS=8, and the memory consumption significantly decreased, and for some time (hours) even became less than on bare metal. But over time consumption increases, despite of -memory.allowedBytes=12884901888 option set:

I continue to monitor consumption over time. If it isn't OOM'ed, we can assume that our problem is solved.
wf1nder
on 19 Oct 2020
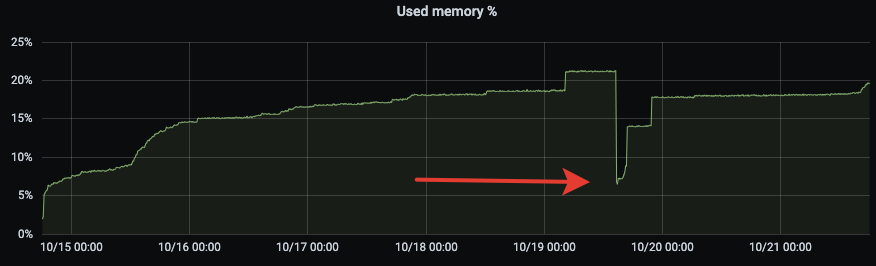
It OOM'ed :(
Looks like some memory leak, because memory consumption is growing over time stepwise. This is also noticeable on bare metal servers (the arrow marks the moment of restart):
wf1nder
on 21 Oct 2020
I am not sure if we have the same issue. We have vmagent on k8s with a 4GB memory limit. We use the following (memory) option:
-memory.allowedBytes=50MiB
We have arround 1000 scrape targets and the agent gets oom killed regularly:

Is this a memory leak or do I have to increase the memory limit?
 zbindenren
on 23 Oct 2020
zbindenren
on 23 Oct 2020
@wf1nder , could you try building vmagent from the commit e277c3d07b43b233f8d715f65bb54bd3003c6214 and running it with -promscrape.streamParse command-line option as described in the troubleshooting section? The stream parse mode should significantly reduce memory requirements for vmagent when scraping targets with millions of metrics.
@zbindenren , which version of vmagent do you run? Could upgrade to the latest available version and share memory profile when it reaches 4GB limit? See these docs on how to collect memory profile.
valyala
on 2 Nov 2020
FYI, stream parsing mode has been included in vmagent starting from v1.45.0.
valyala
on 2 Nov 2020
@wf1nder , could you try building
vmagentfrom the commit e277c3d and running it with-promscrape.streamParsecommand-line option as described in the troubleshooting section? Thestream parsemode should significantly reduce memory requirements forvmagentwhen scraping targets with millions of metrics.@zbindenren , which version of
vmagentdo you run? Could upgrade to the latest available version and share memory profile when it reaches 4GB limit? See these docs on how to collect memory profile.
@valyala here the requested memory profile at 3.7GB memory usage. Version of vmagent is 1.45.0. Number of targets: 960.
mem.pprof.gz
zbindenren
on 4 Nov 2020
@zbindenren , thanks for the provided memory profile! Increased memory usage for your case could be related to https://github.com/VictoriaMetrics/VictoriaMetrics/issues/878 . Could you build vmagent from commit b2042a1c301e94767d236ba8aa27aced9571ebbf and verify whether it uses lower amounts of memory comparing to vmagent v1.45.0 ? See build instructions for vmagent.
valyala
on 4 Nov 2020

It is better with master (blue graph), but still increasing.
zbindenren
on 6 Nov 2020
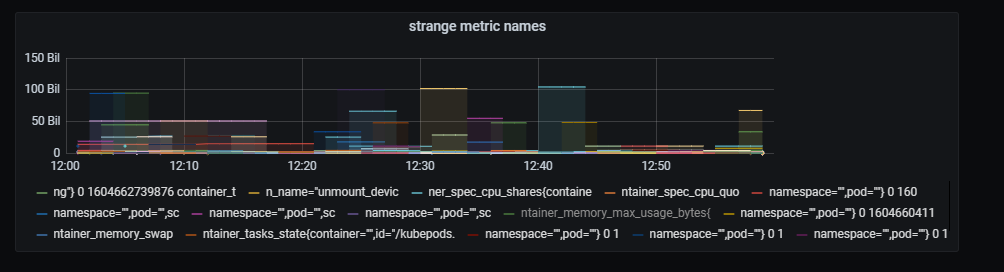
@valyala I think -promscrape.streamParse killed our victoria metrics and thanos cluster today. As soon as I enabled the option we got a churn rate of 30k. In the following screenshot you see the metric names in the dashboard:
Here the churn rate:

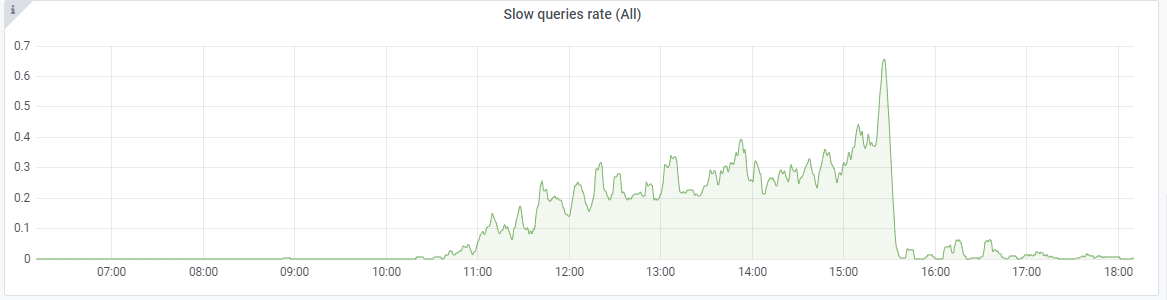
Slow queries increased:
Slow inserts:
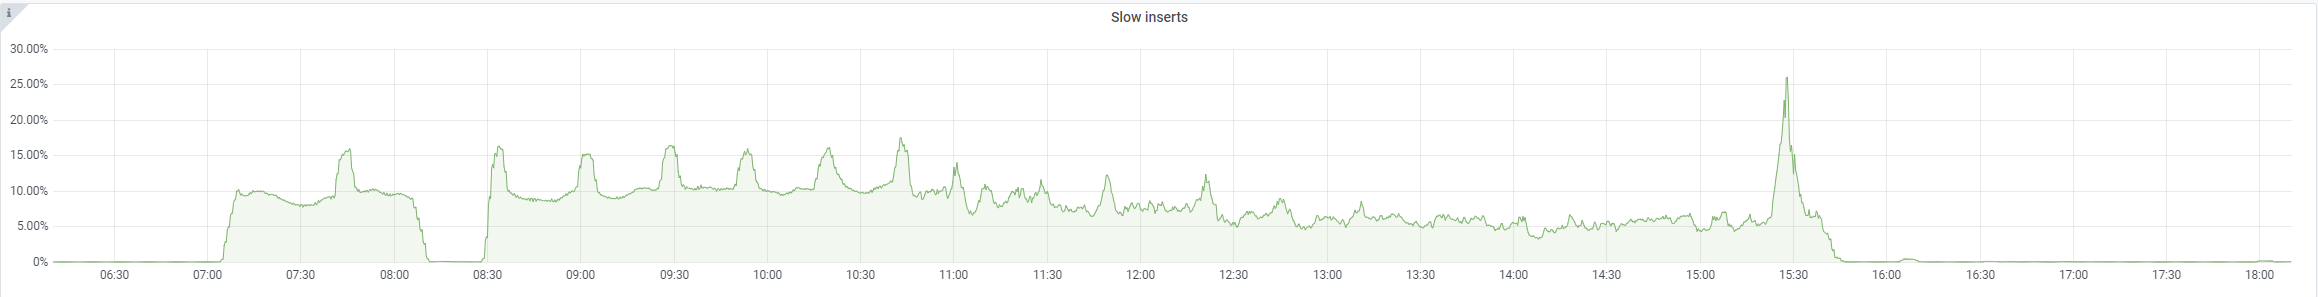
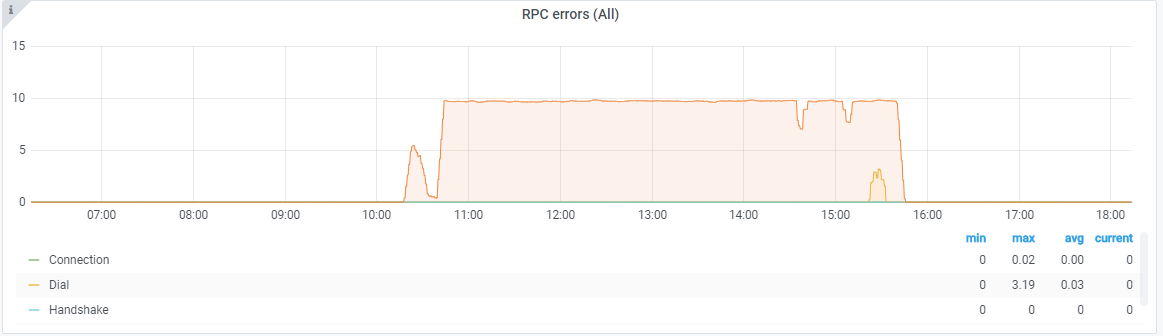
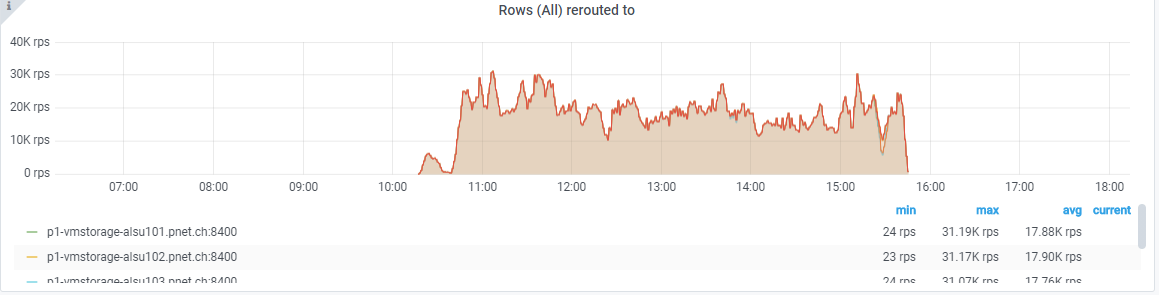
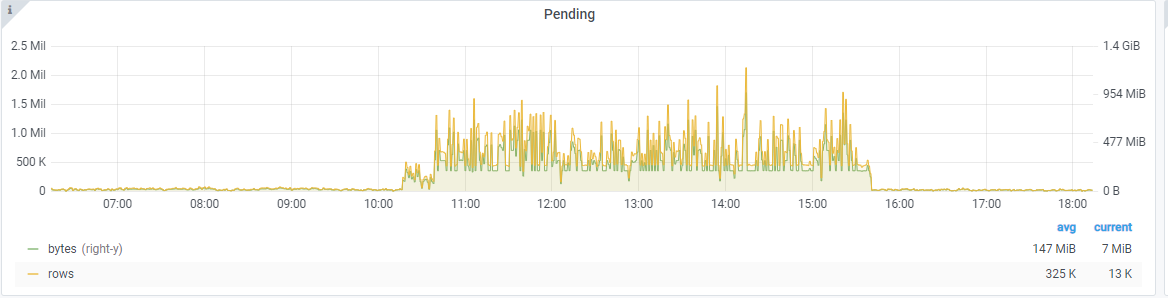

As soon as I disabled the flag, everything went to normal again.
zbindenren
on 6 Nov 2020
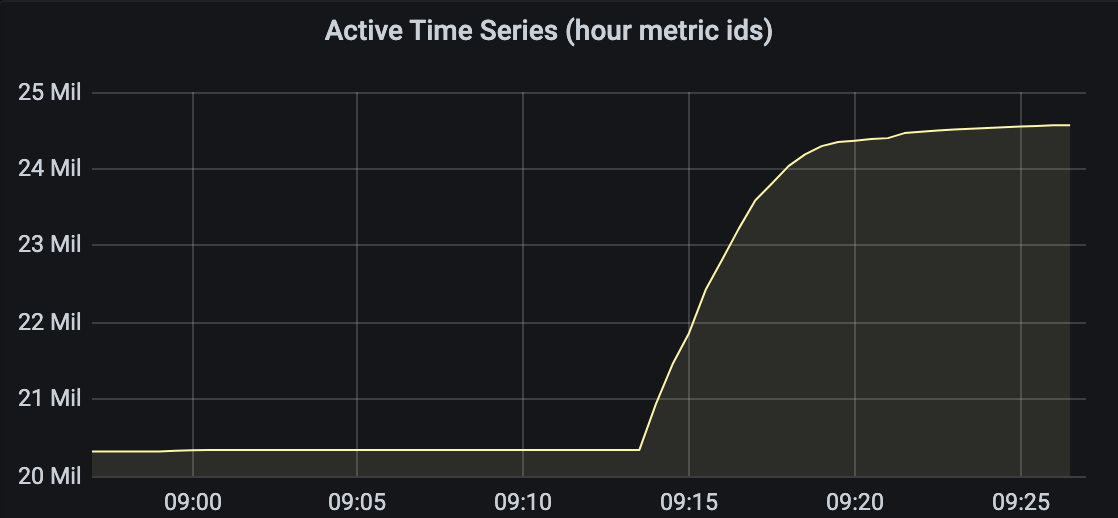
I can confirm, enabling -promscrape.streamParse creates extra load to VM, and metric "Active Time Series (hour metric ids)" increased instantly x2 in our case. Disabling stream parse on the same version of vmagent returns load to previous condition.
So we stopped to test this option for now.
wf1nder
on 6 Nov 2020
For streamParse I've noted that metric labels emitted by vmagent sometimes are incorrectly formatted. An example will be smth like lab=\"el value\" instead of label=value. It generated a ton of unique label names and killed the victoriametrics due to a too high data cardinality.
 shuttie
on 6 Nov 2020
shuttie
on 6 Nov 2020
An example of heap profile (for the latest master of b2042a1):
heapx9.bin.gz
Looks like that the main leak is somewhere in promrelabel.setLabelValue, but I was not able to reliably understand where can it leak in this tiny function.
shuttie
on 6 Nov 2020
Yet another heap dump after the night of struggle:
heapz4.bin.gz
shuttie
on 7 Nov 2020
@shuttie , @wf1nder and @zbindenren , thanks for providing useful information about -promscrape.streamParse issue. This information helped identifying and fixing the issue, which could result in garbage labels for the scraped metrics. The bugfix is available in the commit 188325f0fc7f7a943ee4b4ed0430c517436837f6 . Could you build vmagent from this commit and verify whether the issue is gone? See build instructions for vmagent.
valyala
on 7 Nov 2020
@shuttie , the provided memory profiles show that the majority of memory is used for per-scrape target labels after applying relabeling. Could you share the contents of http://vmagent:8429/api/v1/targets page? How many targets are scraped in your setup and how many labels per scrape target are present on this page?
valyala
on 7 Nov 2020
@shuttie , could you build vmagent from the commit 83df20b5b5c409cd85c95f0a35167ffa58131b50 and verify whether it uses lower amounts of memory for your workload?
valyala
on 7 Nov 2020
FYI, all the commits mentioned above have been included in v1.46.0 release. So the bugfixes could be tested in this release without the need for building vmagent from sources.
valyala
on 7 Nov 2020
Switching to 1.46 seems to be almost the same as before:

The main suspect is still the same:
We have approximately active 1700 targets in the /v1/targets response (which seems to be correct), and almost no dropped targets there. But there is quite a high level of target churn by design: each target lifetime is 1-6 hours, so pods are constantly come and leave.
The relabel config looks like this:
 - job_name: 'whatever_prod'
   kubernetes_sd_configs:
     - role: 'pod'
       namespaces:
         names:
         - whatever-prod
       selectors:
       - role: pod
         label: app=whatever
   relabel_configs:
     - source_labels: ['__meta_kubernetes_namespace', '__meta_kubernetes_pod_label_app', '__meta_kubernetes_pod_container_port_number']
       action: keep
       regex: 'whatever-prod;whatever;50000'
     - source_labels: ['__meta_kubernetes_pod_label_host']
       regex: '(.+)'
       action: replace
       target_label: host
     - source_labels: ['__meta_kubernetes_pod_label_merchant']
       regex: '([0-9]+)'
       action: replace
       target_label: merchant
     - source_labels: ['__meta_kubernetes_pod_label_placement']
       regex: '(.+)'
       action: replace
       target_label: placement
     - source_labels: ['__meta_kubernetes_pod_node_name']
       regex: '(.+)'
       action: replace
       target_label: node
     - source_labels: ['__meta_kubernetes_pod_name']
       regex: '(.+)'
       action: replace
       target_label: instance
I'm also going to enable streamParse during the night to see how it will perform.
shuttie
on 8 Nov 2020
@shuttie , could you build vmagent from 6c24c5caa32b767e2d99d4232007c4e0dac98a76 and verify whether it reduces memory usage under your workload?
valyala
on 9 Nov 2020
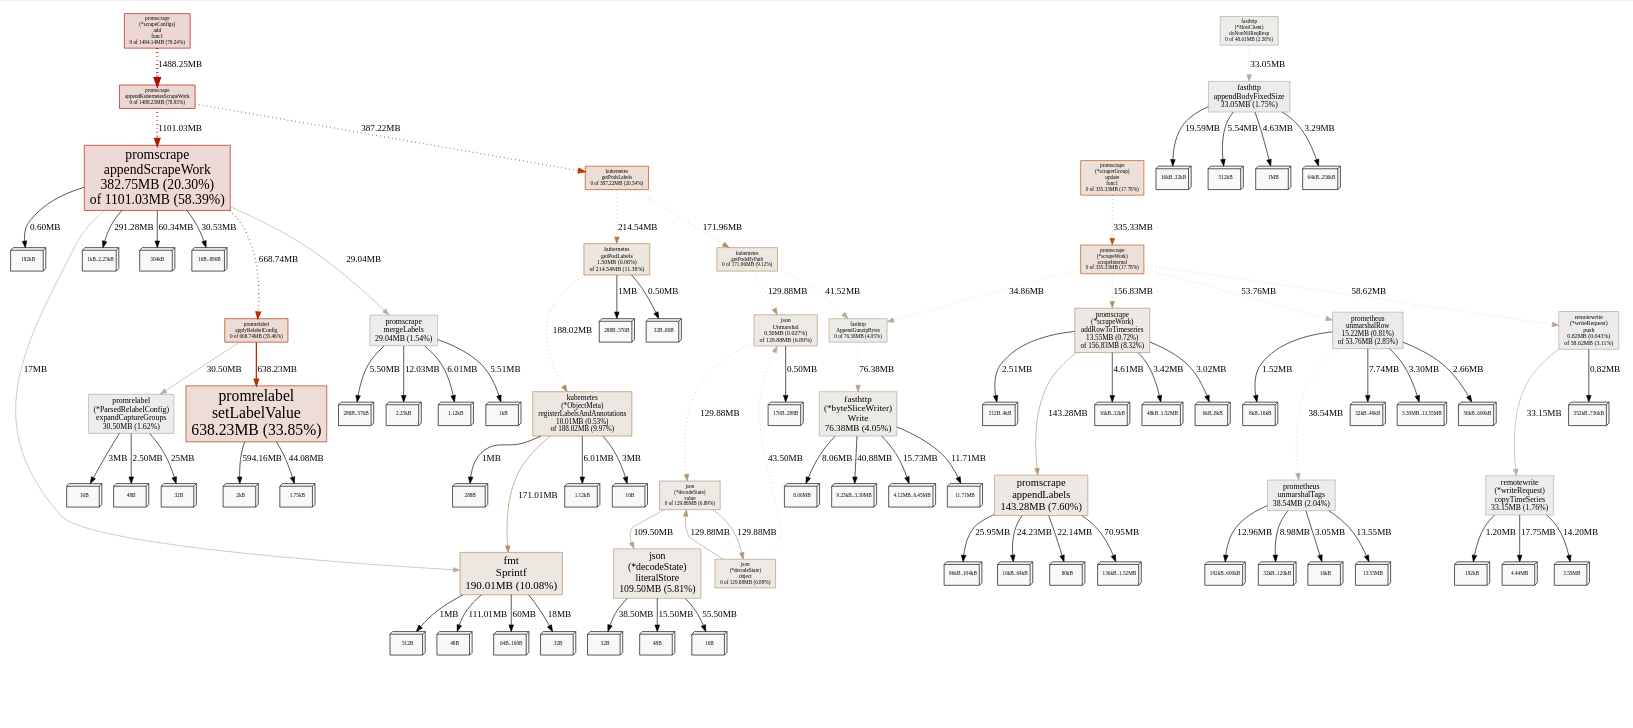
For the last 12 hours with streamParse enabled on 1.46.0, memory usage pattern seems to become different and a bit better:

Heap dump:
heap2.bin.gz
setLabelValue seems to be the main abuser:

I'm going to deploy the commit 6c24c5c now and will report in a couple of hours.
shuttie
on 9 Nov 2020
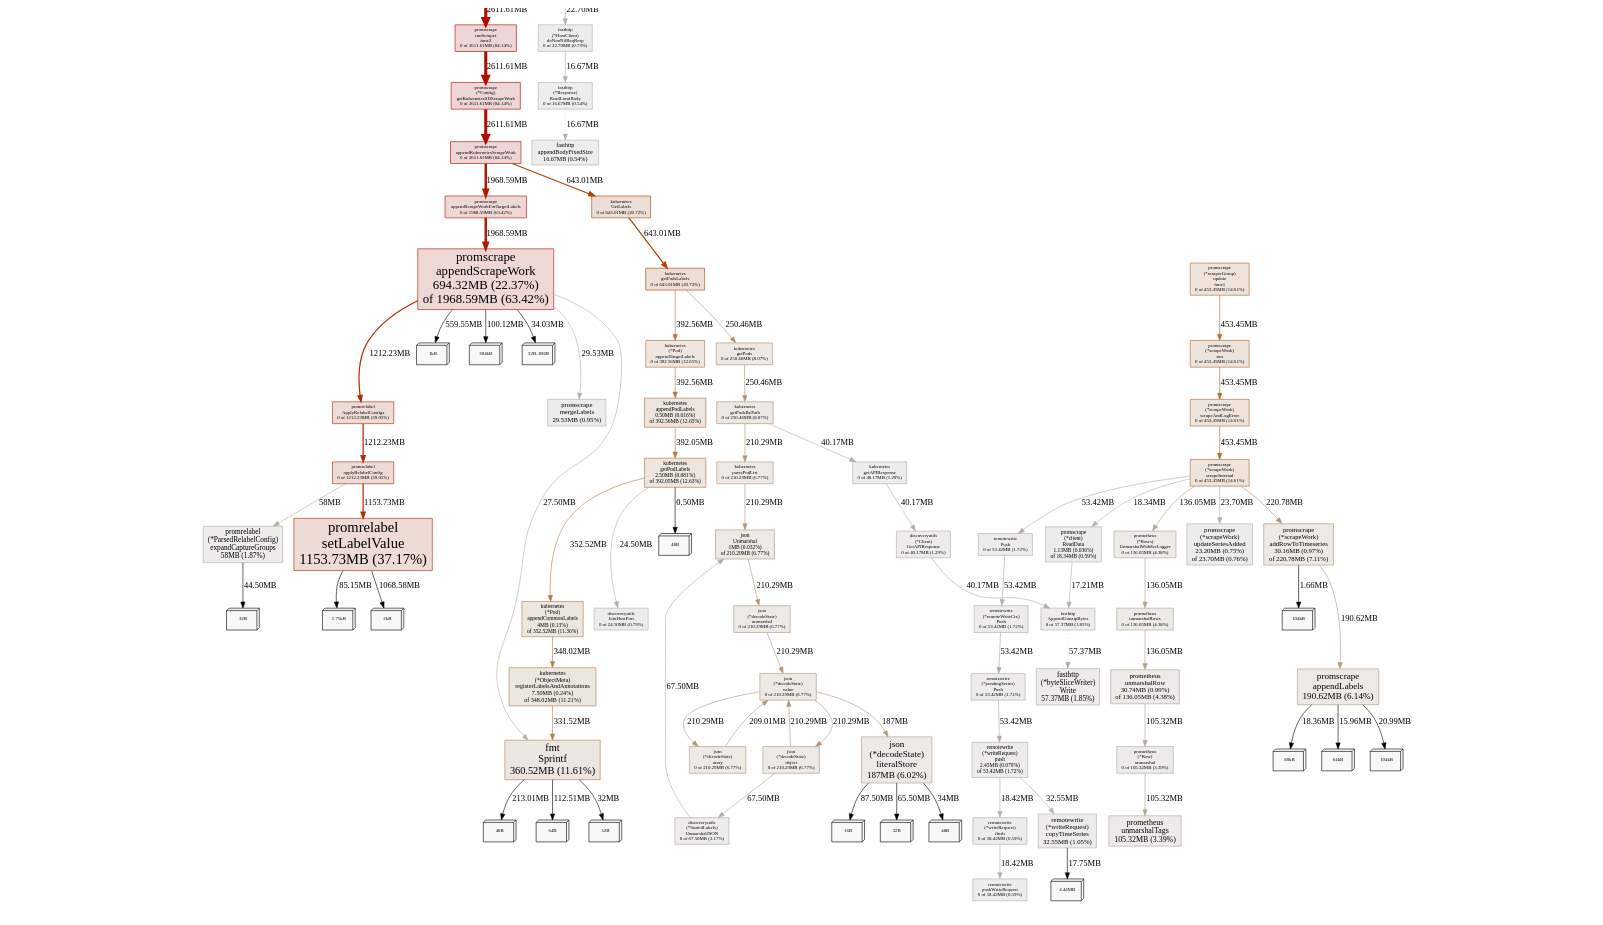
With a combo of 6c24c5c and streamParse the situation seems to be much more stable:
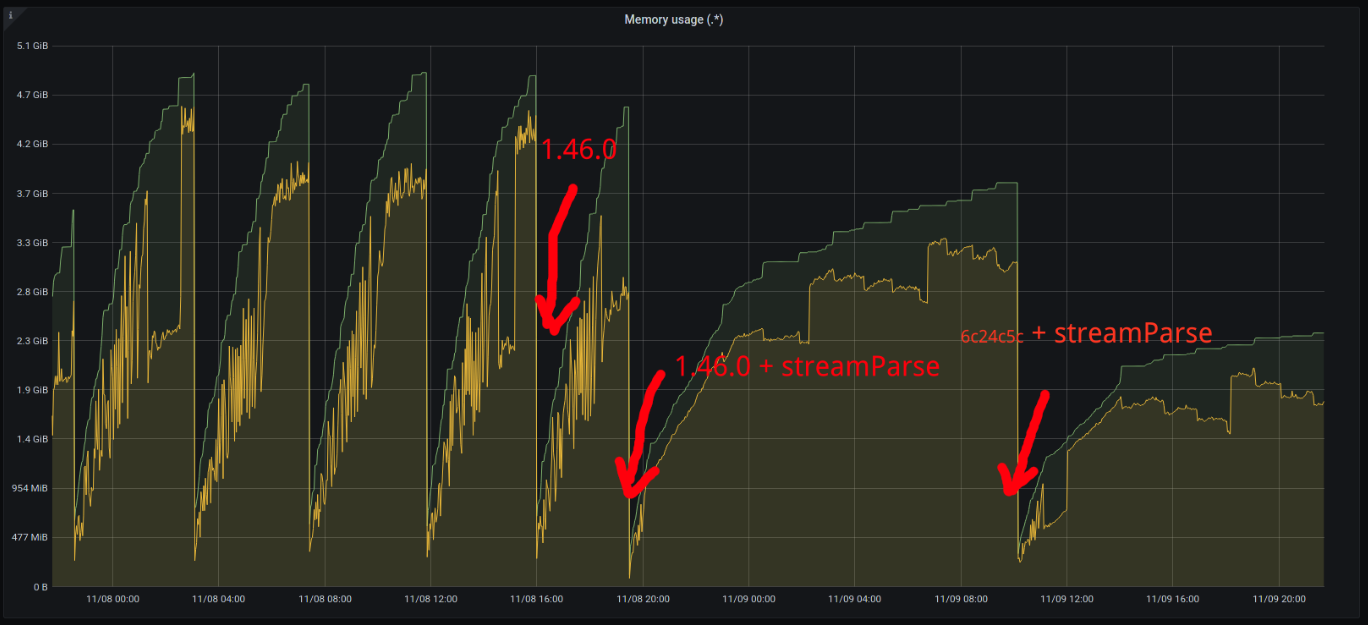
The load and config are still the same.
The setLabelValue leak seems to be gone:
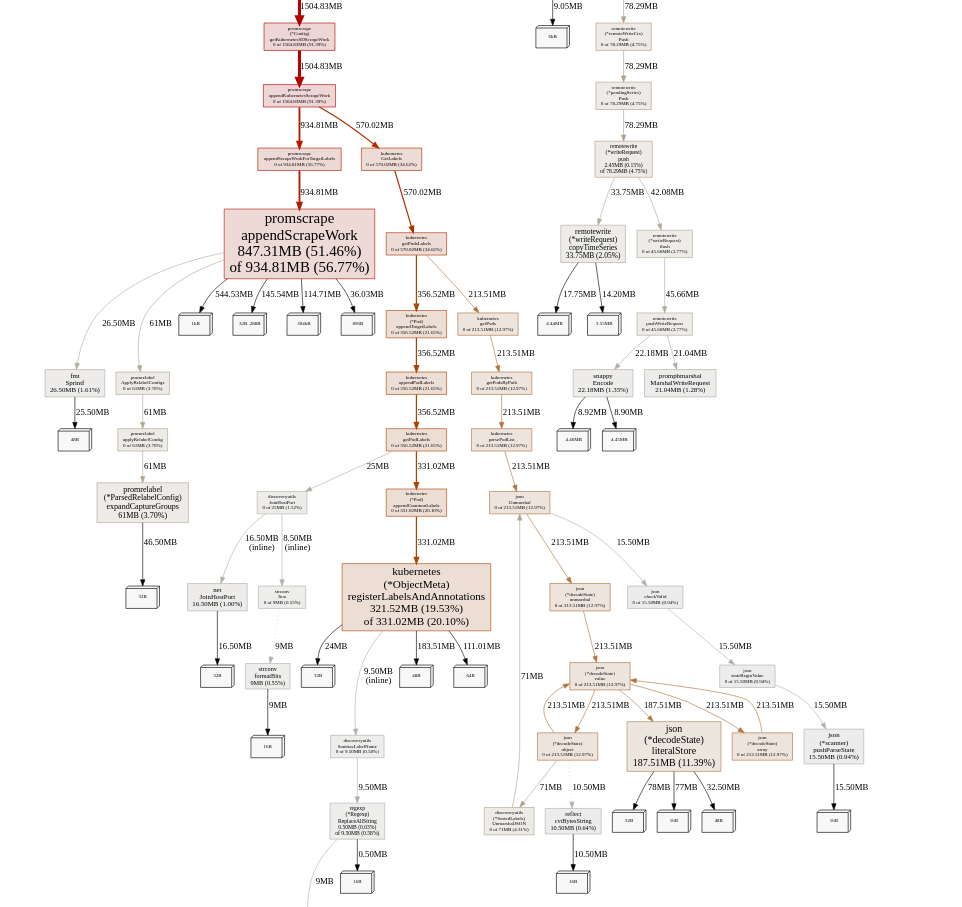
But it seems to be leaking a bit somewhere in appendScrapeWork. Heap dump:
heap4.bin.gz
shuttie
on 9 Nov 2020
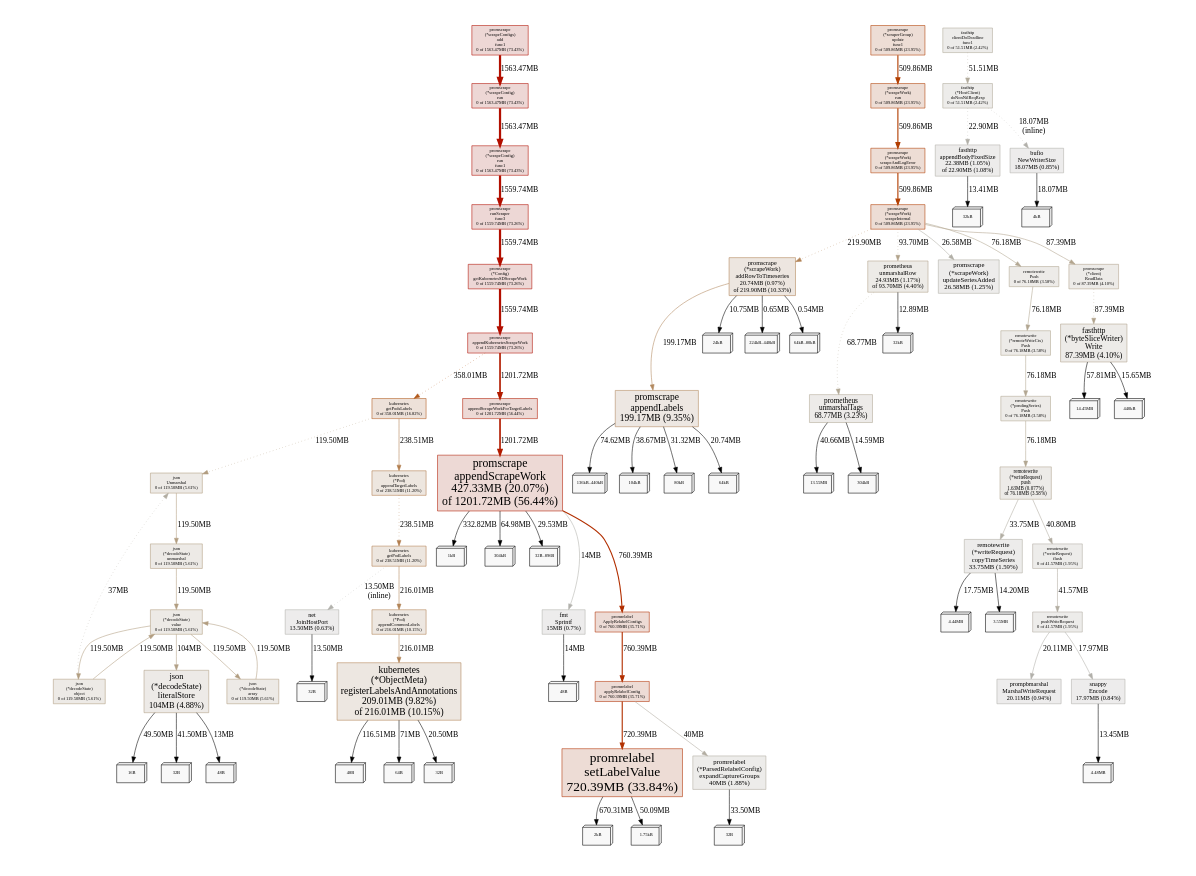
@shuttie , thanks for the update! The provided memory profile shows that 580MB is spent on storing original labels for each scrape target before applying relabeling. These labels are shown at /api/v1/targets page in "discoveredLabels" lists and in "droppedTargets" list. Additionally, the original labels are shown in duplicate scrape targets error messages. These labels are intended for debugging cases with improperly configured per-target relabeling. I think we can add a special command-line option like -promscrape.dropOriginalLabels, which would drop original labels from all the places mentioned above. This option can be used for reducing memory usage when scraping big number of targets with big number of original labels at the cost of reduced debuggability for improperly configured per-target relabeling.
valyala
on 9 Nov 2020
@shuttie , could you build vmagent from the commit bcd139362ba076d11c00d4d3a8fd71a704368bcd and run it with -promscrape.dropOriginalLabels command-line flag? This should reduce memory usage for your workload.
valyala
on 9 Nov 2020
@shuttie , it looks like the issue, which resulted in gradual memory usage growth for your workload has been detected and fixed in the commit e205975716cd3b4dcb48baef7e01516cdf9ecdf5 . Could you try vmagent built from this commit?
valyala
on 10 Nov 2020
After the bcd1393 commit the memory growth seems to be stable, but it's running for a quite short period of time to do any final conclusions:
But anyway thank you for your help, as the issue seems to be hopefully resolved!
As an experiment I will deploy the e295975 commit today to see the difference.
shuttie
on 10 Nov 2020
Looks like garbage metrics when stream parse enabled is not completely fixed.
Today I upgraded vmagent to latest version v1.46.0, and after enabling strict parse the active time series count is increased (but not as dramatic as previously) and slowly continues to grow:
wf1nder
on 12 Nov 2020
e295975 seems to be almost the same as bcd1393: memory usage is stable and quite low:
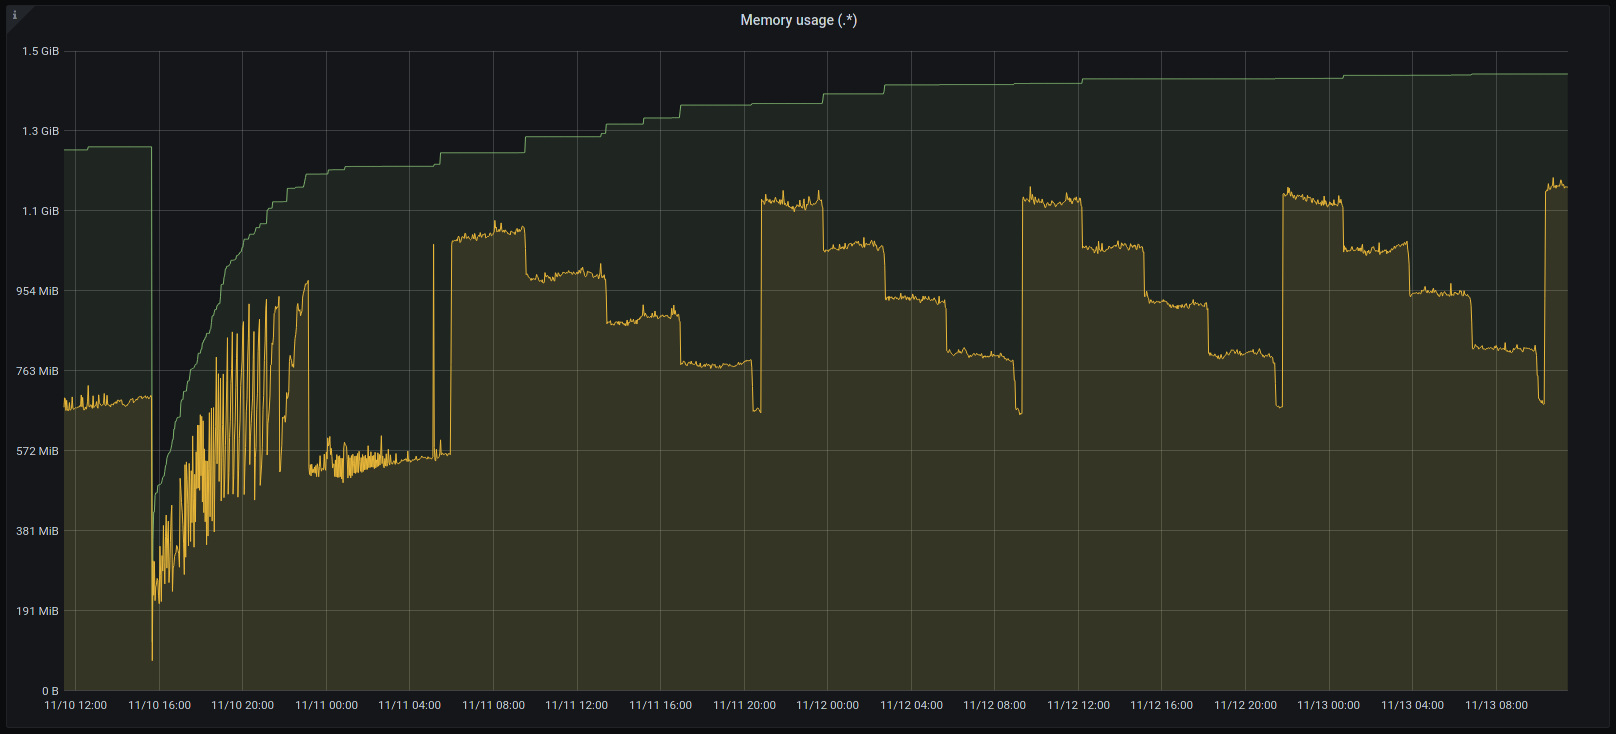
So thanks again for the fix!
shuttie
on 13 Nov 2020
Looks like garbage metrics when stream parse enabled is not completely fixed.
Today I upgraded vmagent to latest version v1.46.0, and after enabling strict parse the active time series count is increased (but not as dramatic as previously) and slowly continues to grow
@wf1nder , could you try finding metrics with unexpected labels in data collected by vmagent v1.46.0 ?
valyala
on 13 Nov 2020
@shuttie , thanks for update!
valyala
on 13 Nov 2020
@valyala Honestly, I didn't find a way to find those metrics. I tried to find manually, but we have too many metrics to view it with our eyes.
Is there a way to find the latest created metrics in VM?
wf1nder
on 15 Nov 2020
On the blank vmstorage I exported metrics list by query /api/v1/label/__name__/values before and after enabling stream parse on vmagent, and compared results. Metrics list the same and no garbage metric names, so looks like differencee is in labels.
wf1nder
on 15 Nov 2020
After a while metrics with bad names appeared too. For some reason labels appeared as metric names, for example:
machine_dc=\dc1\
machine_group=\group1\}
\nodejs_common_name\
All this must be a labels in some time series, but became as a ts name.
wf1nder
on 15 Nov 2020
FYI, commits that limit memory usage for vmagent have been included in v1.47.0. Closing this issue as fixed.
@wf1nder, could you create a separate issue related to bad metric names / labels?
valyala
on 16 Nov 2020
Related issues
 0xBF
·
3Comments
0xBF
·
3Comments
 faceair
·
3Comments
faceair
·
3Comments
 n4mine
·
3Comments
n4mine
·
3Comments
 sh0rez
·
3Comments
sh0rez
·
3Comments
 localpref
·
3Comments
localpref
·
3Comments
Most helpful comment
After the

bcd1393commit the memory growth seems to be stable, but it's running for a quite short period of time to do any final conclusions:But anyway thank you for your help, as the issue seems to be hopefully resolved!
As an experiment I will deploy the
e295975commit today to see the difference.