Victoriametrics: vmagent: high memory consumption
We using vmagent to scrape prometheus endpoints and push data to VM clusters. And it seems that it consume more memory than expected.
Some input data:
- service discovery by consul
- push data to 3-4 receivers (vminsert clusters) for now
- ingestion rate is about 500k per receiver
- command line options:
-enableTCP6 -promscrape.config=/etc/scrape.yml -remoteWrite.label=prom_cluster=production -promscrape.config.strictParse -remoteWrite.maxDiskUsagePerURL=1000000000 -memory.allowedPercent=60 -promscrape.consulSDCheckInterval=60s -promscrape.discovery.concurrency=30 -remoteWrite.tmpDataPath=/tmp/vmagent-remotewrite-data -remoteWrite.showURL=true -promscrape.suppressScrapeErrors=true -remoteWrite.url=http://<...> -remoteWrite.url=http://<...> ...
We wanted to run vmagent in docker in our cloud, but forced to run it on bare metal servers because of high memory consumption, which is varies from version to version. Server specs: 16/32 real/virtual cores (HT), 128 (126 real) GB RAM.
Here some memory usage values depending on version. Measured a couple of minutes after launch (excepts 1.37.4, which was started yesterday).
ps aux --sort -rss | head -n 2
1.37.4:
USER       PID %CPU %MEM    VSZ   RSS TTY      STAT START   TIME COMMAND
root      6687  558 53.6 76084692 70828780 ?   Sl   Aug16 6233:11 /usr/bin/vmagent ...
1.39.4:
USER       PID %CPU %MEM    VSZ   RSS TTY      STAT START   TIME COMMAND
root      4643  692 37.5 54229804 49569508 ?   Sl   08:54  36:22 /usr/bin/vmagent ...
1.40.0:
USER       PID %CPU %MEM    VSZ   RSS TTY      STAT START   TIME COMMAND
root     18064 1071 92.4 132051356 122009592 ? Sl   09:00  27:29 /usr/bin/vmagent ...
It reaches 120+ GB and OOMed.
Also I builded vmagent from commit https://github.com/VictoriaMetrics/VictoriaMetrics/commit/efc730863bb85b47e71c9f5d34238d257a1469d5
efc7308:
USER       PID %CPU %MEM    VSZ   RSS TTY      STAT START   TIME COMMAND
root      6460  798 57.1 79195180 75445300 ?   Sl   09:08  50:18 /usr/bin/vmagent
Looks like least consumption is on version 1.39.4 for now.
Sending memory profiles to [email protected].
 wf1nder
All 5 comments
Hi @wf1nder! Thanks for report!
Looking at the profile the most of memory consumed was in relablening:
Showing top 10 nodes out of 38
      flat  flat%   sum%        cum   cum%
   17.67GB 33.61% 33.61%    17.67GB 33.61%  github.com/VictoriaMetrics/VictoriaMetrics/app/vmagent/remotewrite.(*relabelCtx).applyRelabeling
   12.21GB 23.22% 56.83%    12.21GB 23.22%  github.com/VictoriaMetrics/VictoriaMetrics/lib/promscrape.appendLabels

ROUTINE ======================== github.com/VictoriaMetrics/VictoriaMetrics/app/vmagent/remotewrite.(*relabelCtx).applyRelabeling in github.com/VictoriaMetrics/VictoriaMetrics/app/vmagent/remotewrite/relabel.go
   17.67GB    17.67GB (flat, cum) 33.61% of Total
         .          .     84:   tssDst := tss[:0]
         .          .     85:   labels := rctx.labels[:0]
         .          .     86:   for i := range tss {
         .          .     87:           ts := &tss[i]
         .          .     88:           labelsLen := len(labels)
   16.58GB    16.58GB     89:           labels = append(labels, ts.Labels...)
The labels slice is a part of relabelContext object which is managed by relabelCtxPool to reduce memory allocations. My assumption is that slice capacity for objects managed by pool grows over time even if real length is much lower. This leads to increased memory usage since such expanded objects are rarely collected by gc. I'm thinking about following approaches for solving this:
- randomly reset capacity with some probability, like recreate slice for every 1000th obj;
- evenly split labels over slices of constant size. For example, store in pool objects of fixed size 32 and then use N objects to store M labels. This would complicate the code but memory consumption should be stable.
wdyt @valyala ?
 hagen1778
on 20 Aug 2020
hagen1778
on 20 Aug 2020
This should be addressed by 7785869ccc4d4ff4dc80ad9f33442f6c5b369c72 and 038358b7773c0cd40966496ad6a7ffd717f37e6e commits, which will be included in the next release of VictoriaMetrics.
@wf1nder , could you build vmagent from the latest commit in master branch according to these docs and verify whether this fixes the issue?
 valyala
on 3 Sep 2020
valyala
on 3 Sep 2020
FYI, commits mentioned above have been included in v1.40.1.
valyala
on 4 Sep 2020
The memory consumption is dramatically decreased with latest release of vmagent:
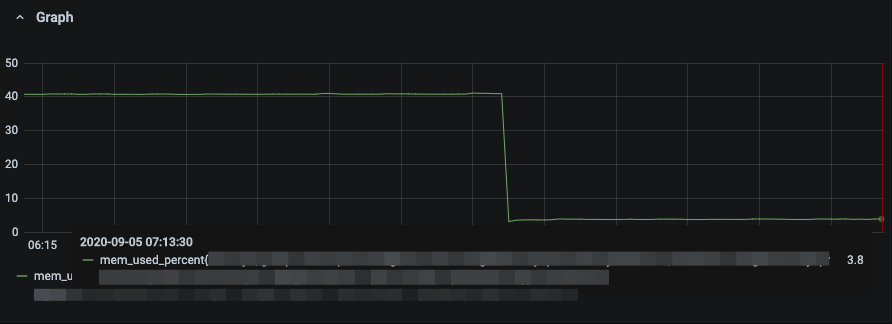
Thank you!
wf1nder
on 5 Sep 2020
@wf1nder , thanks for the update! Then closing the issue as fixed.
valyala
on 7 Sep 2020
Related issues
 0xBF
·
3Comments
0xBF
·
3Comments
 prdatur
·
3Comments
prdatur
·
3Comments
 localpref
·
3Comments
localpref
·
3Comments
 isality
·
3Comments
isality
·
3Comments
 n4mine
·
3Comments
n4mine
·
3Comments
Most helpful comment
The memory consumption is dramatically decreased with latest release of vmagent:
Thank you!