Victoriametrics: Regular high disk read utilization causes freezing all other operations
Hi,
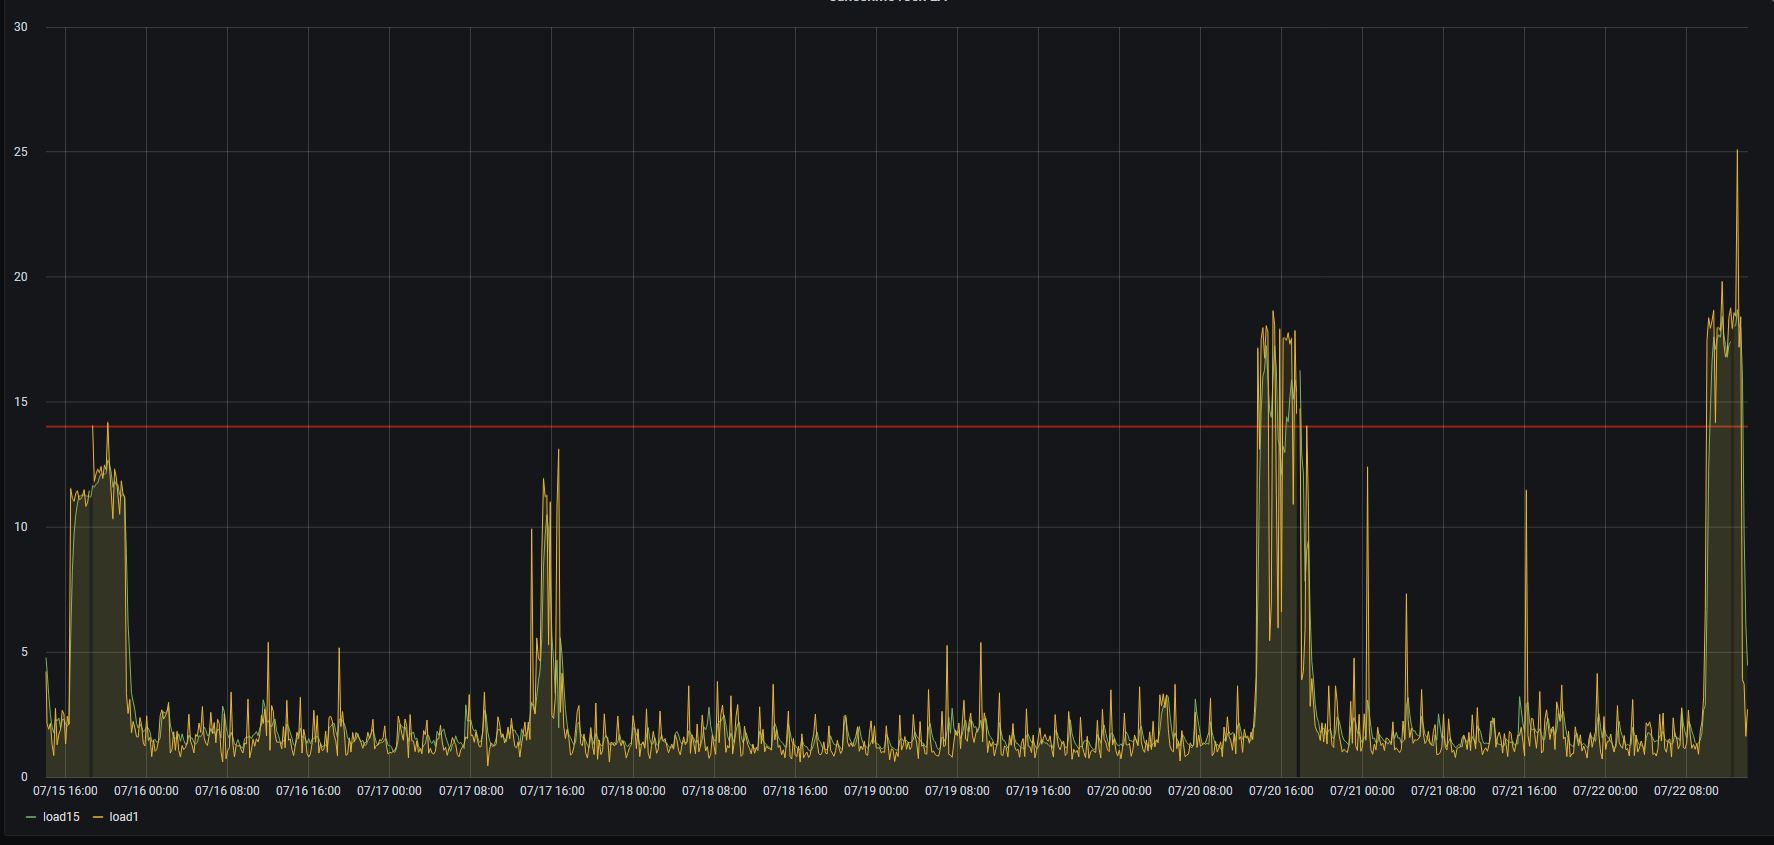
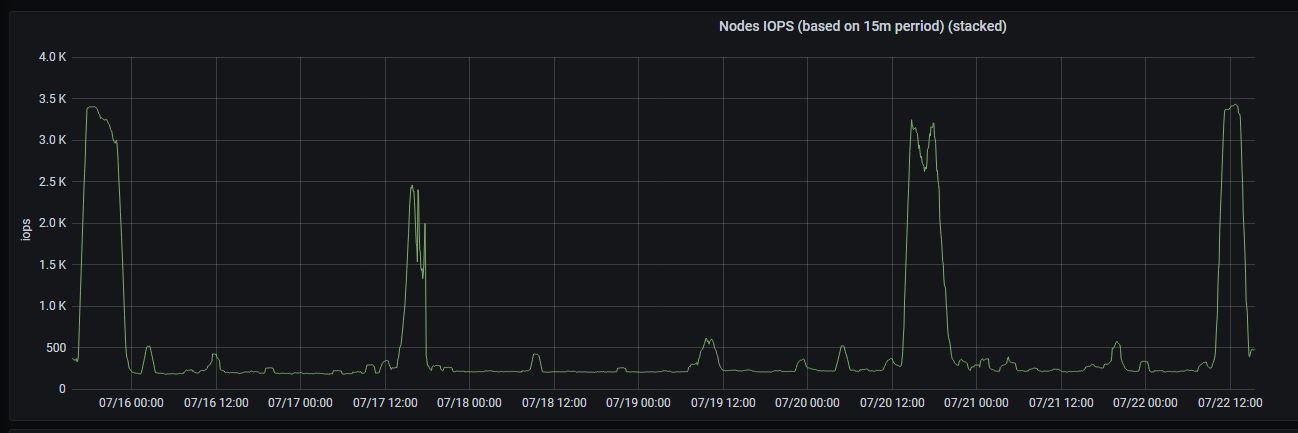
We faced a regular high disk read utilization which caused total freezing of the system. As we have database of size 500GB (and 150GB for index) it takes hours to finish. Disks IOPS jump to ~2000.
It looks like as a regular internal process (of rebuilding the index) but we don't see any particular scheduling pattern.
Except these periods disks utilization is quite low.
To Reproduce
Expected behavior
Any internal operations should not freeze a server.
Screenshots
All graphs are aligned for the same period of 1 week.
CPU LA
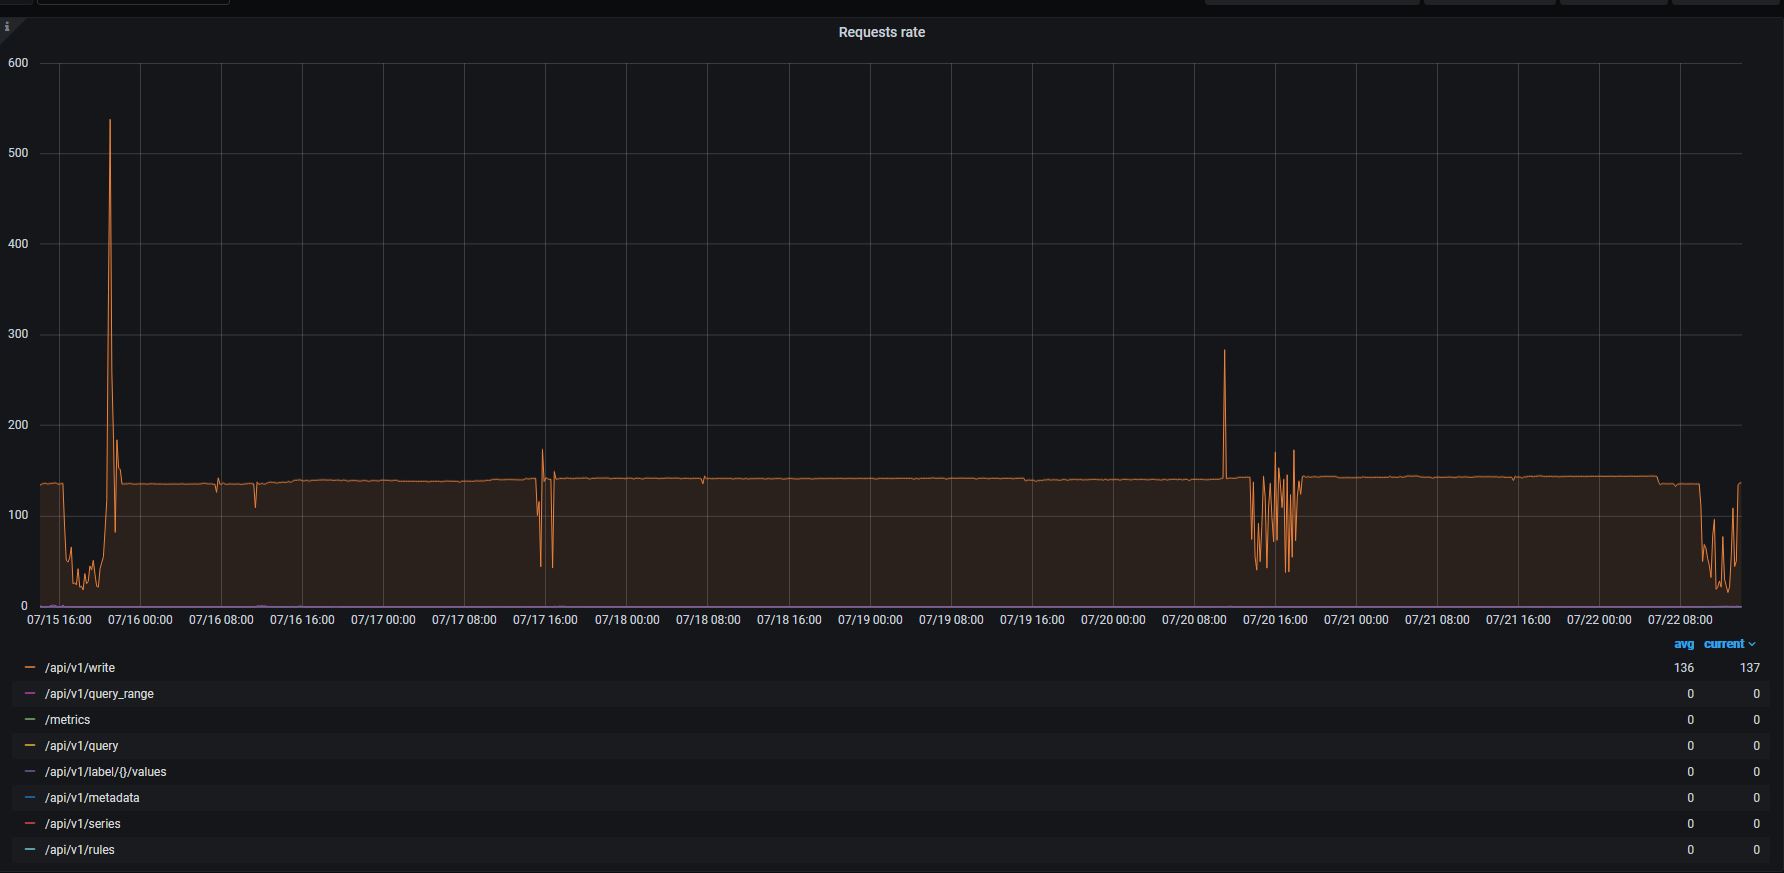
VA request rate
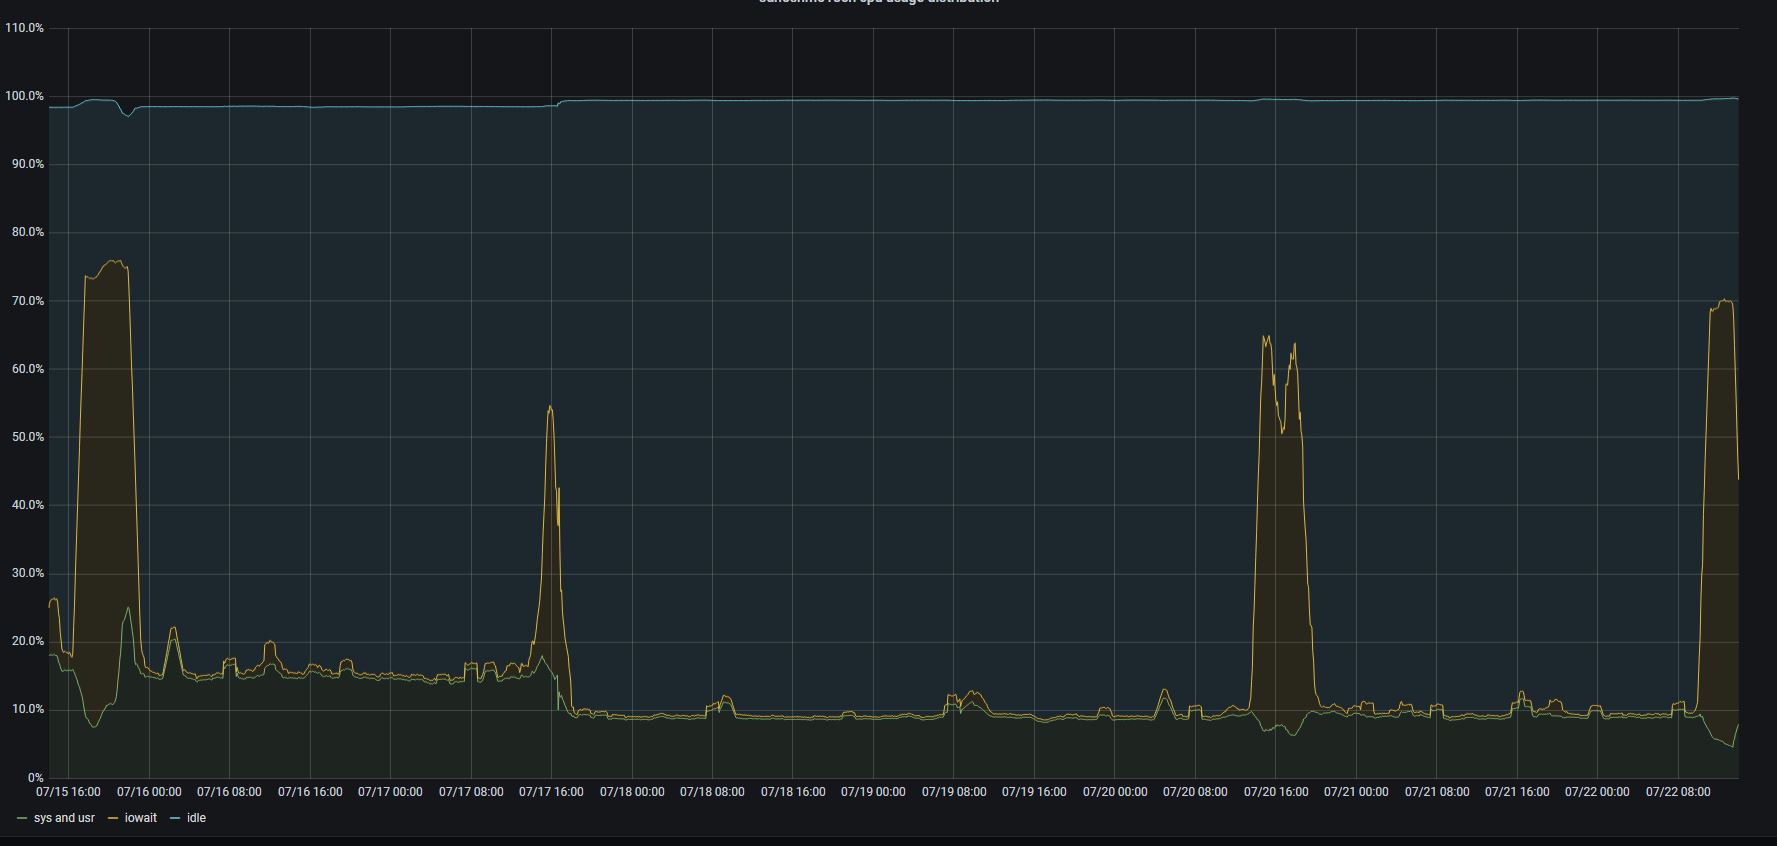
host CPU performance distibution
Version
victoria-metrics-20200714-142020-tags-v1.38.1-0-gb442a42d8
Used command-line flags
flags.txt
 floppy-engineer
All 38 comments
Correction. The whole situation took place with the previous version - v1.38.0
floppy-engineer
on 22 Jul 2020
It is likely the disk read utilization spikes are related to background merging of big parts of data and/or inverted index. Currently the background merge pace has no any limits, i.e. it runs at full pace, which may result in disk IO starvation like in your case. There is a command-line option - -bigMergeConcurrency - which may be used for limiting the number of CPU cores that may be used concurrently by the background merge process. But even a single CPU core may saturate disk IO bandwidth for slow storage. I think we need to add an additional command-line flag for limiting the maximum disk IO bandwidth, which could be used by background merge process.
p.s. It would be great to see also graphs for ingestion rate and for disk IO utilization on the same time ranges.
 valyala
on 22 Jul 2020
valyala
on 22 Jul 2020
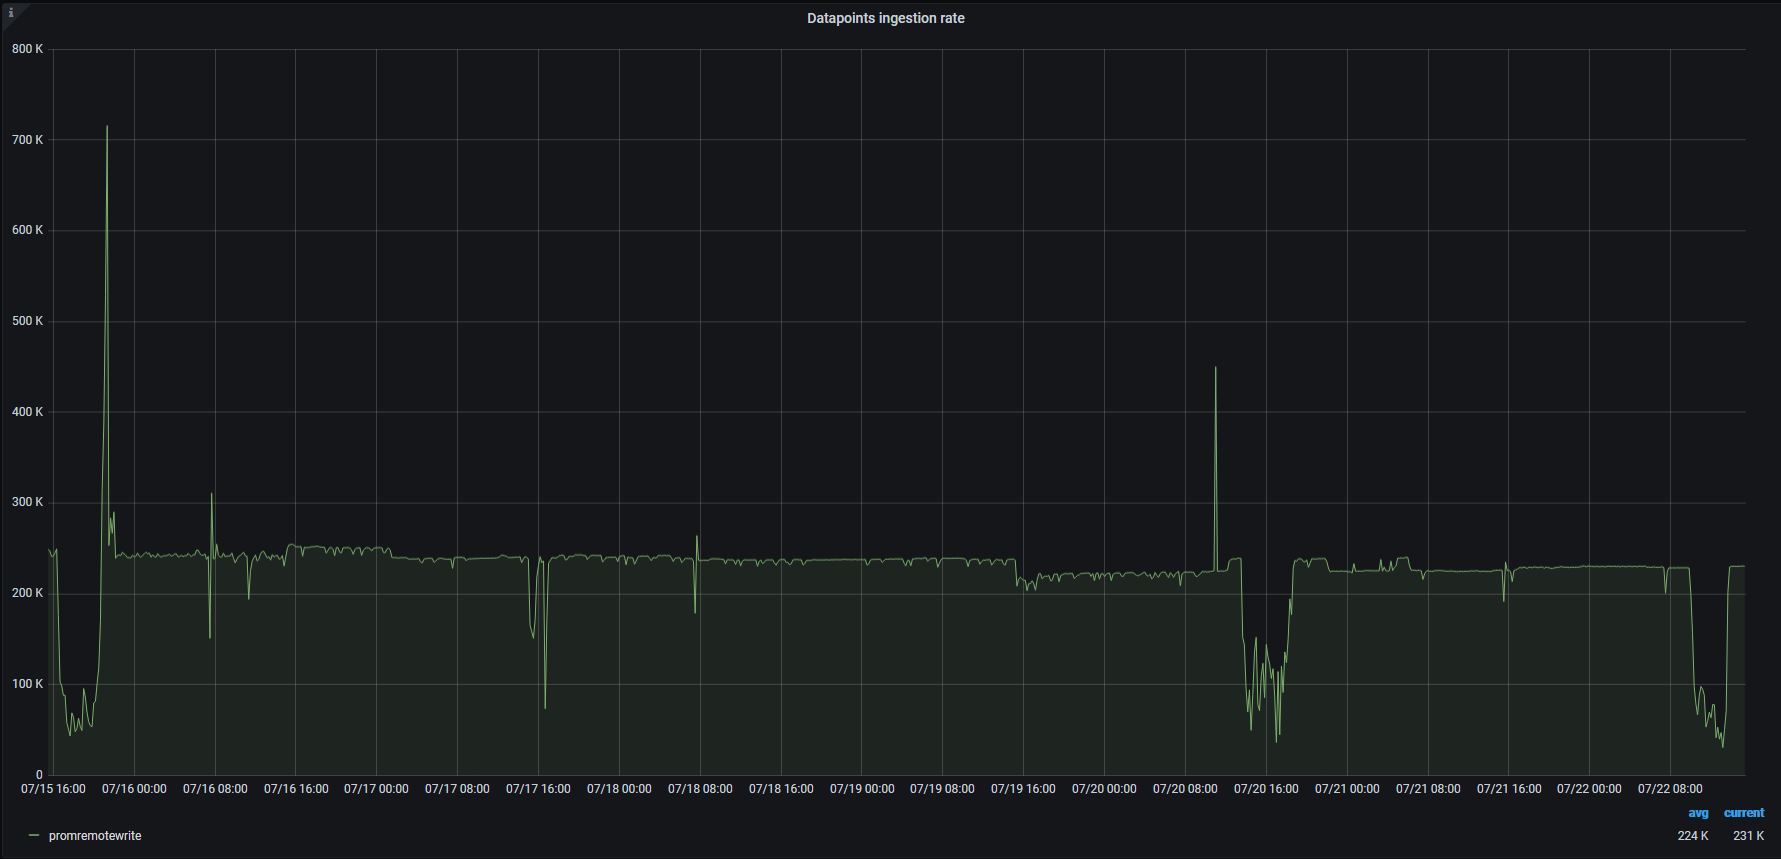
Here you are:
Ingestion rate:
Aggregated disks IOPs:
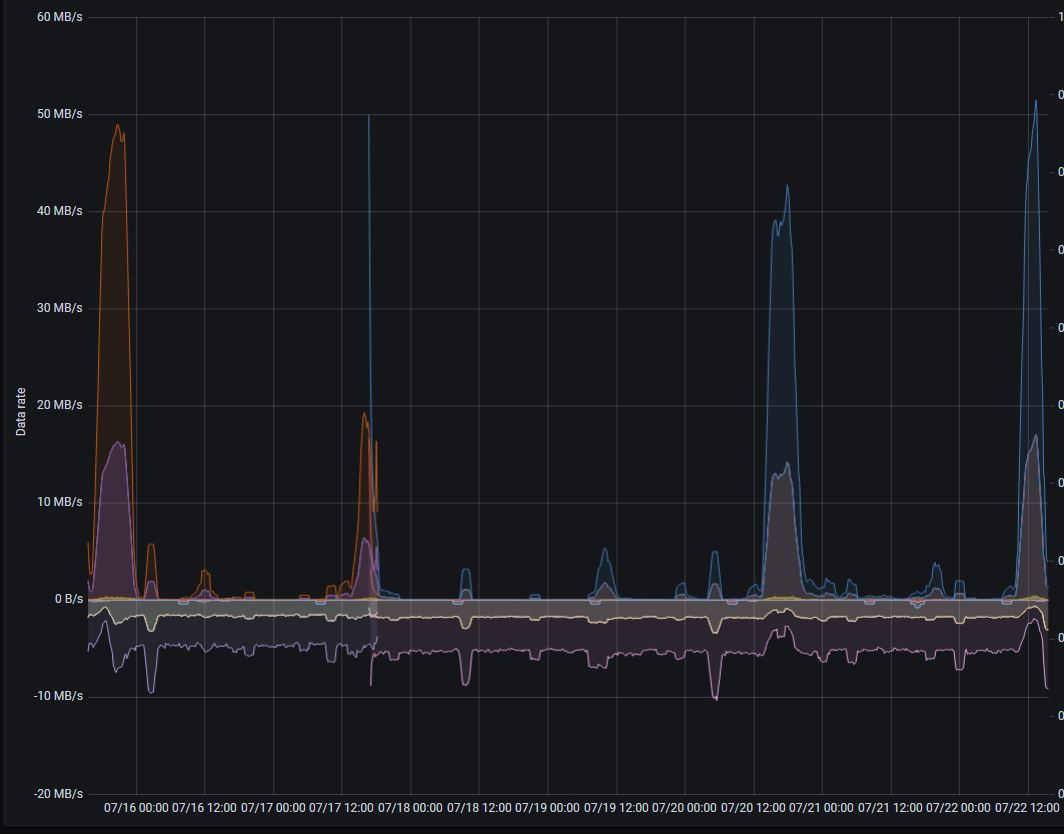
Disks througput (+ read / - write)
floppy-engineer
on 22 Jul 2020
Thanks!. I've set bigMergeConcurrency=1 and will monitor the situation further.
floppy-engineer
on 22 Jul 2020
@floppy-engineer , thanks for the graphs! It is strange that disk write utilization isn't increased proportionally to disk read utilization on the last graph. Background merge process should consume both disk read bandwidth and disk write bandwidth in roughly the same proportion, since it reads data from smaller parts, merges it and writes the result into bigger part. See more technical details about background merge process at https://medium.com/@valyala/how-victoriametrics-makes-instant-snapshots-for-multi-terabyte-time-series-data-e1f3fb0e0282 .
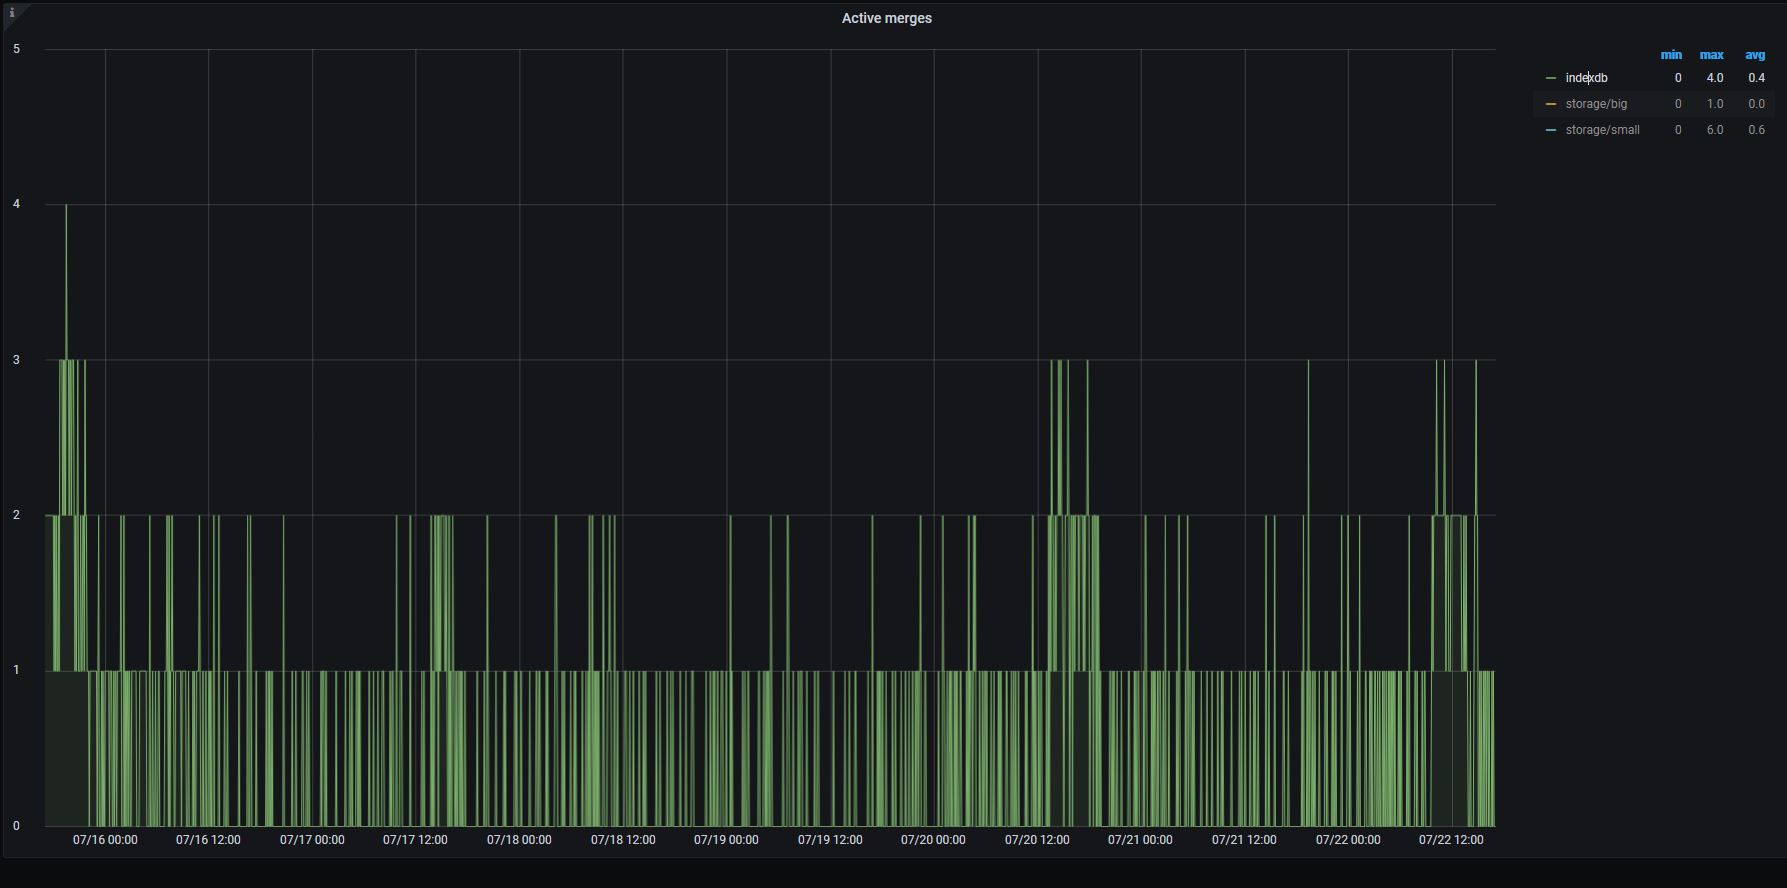
So, it is likely the disk read utilization spikes aren't related to background merge process, but are related to heavy queries, which read data from big number of time series. Could you share active merges graph from the official Grafana dashboard for VictoriaMetrics on the same time range? It would be great also to inspect the output of /api/v1/status/active_queries page during the next disk read utilization peak.
valyala
on 22 Jul 2020
Yeah, no writes bothers me too.
I checked merges during the events - no spikes(
Regarding reading request. I thought that query timeout should keep the problem under control. Here are total utilization for hours. Doesn't VM drop query after a query timeout?
floppy-engineer
on 22 Jul 2020
I checked merges during the events - no spikes(
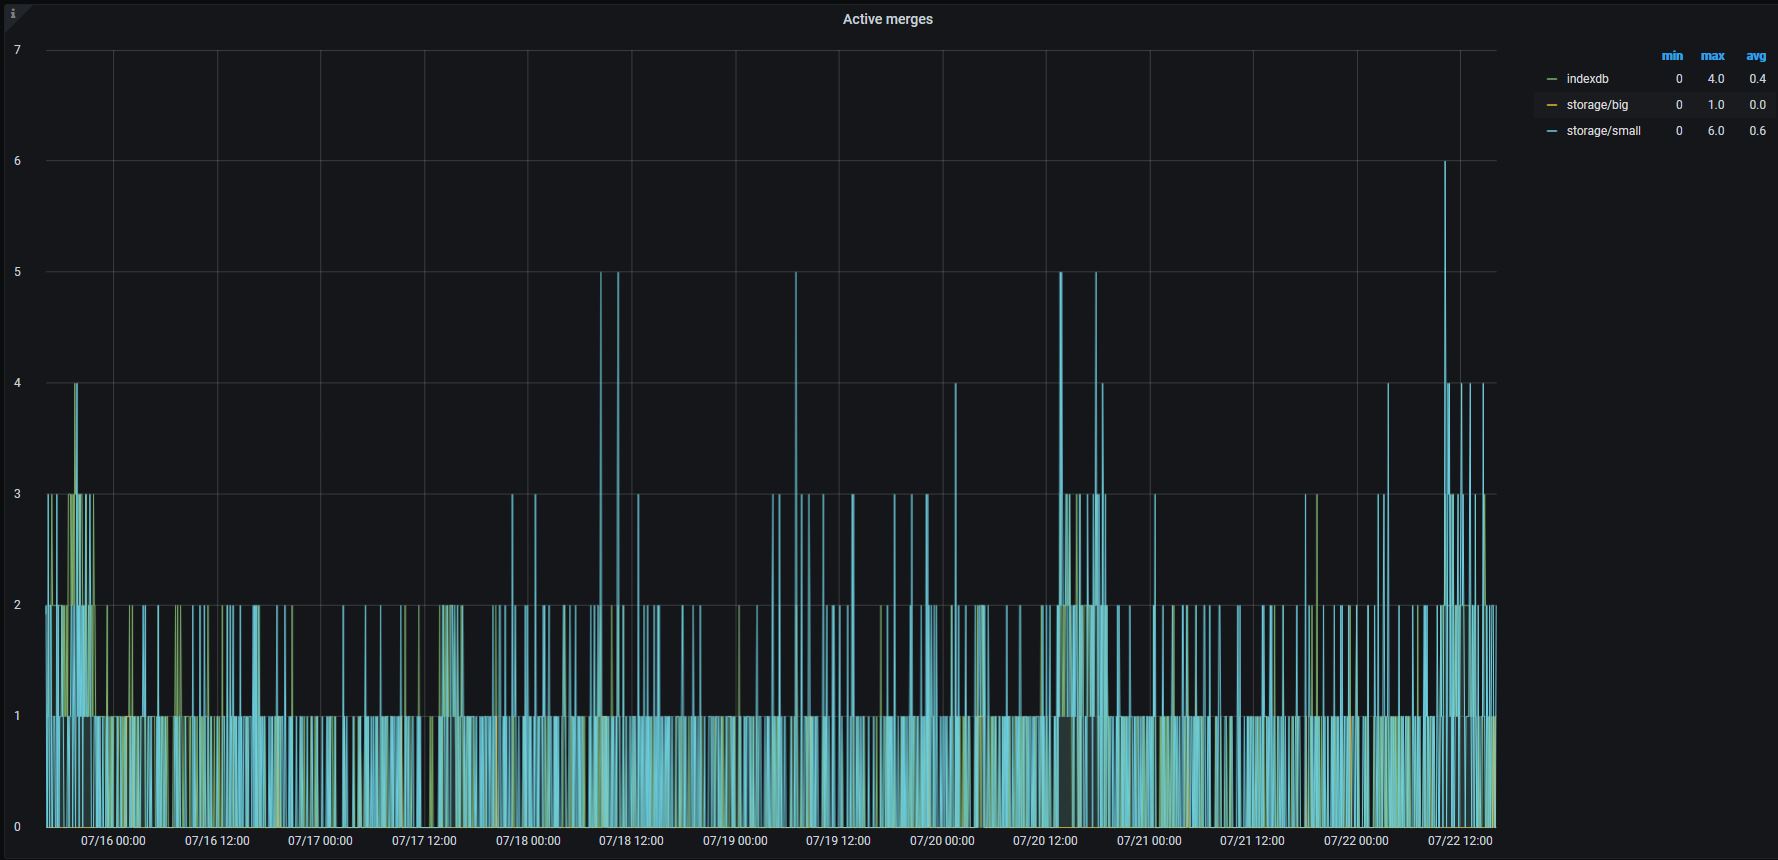
Spikes may be hidden. Try selecting individual lines on the graph like storage/big and indexdb.
I thought that query timeout should keep the problem under control. Here are total utilization for hours. Doesn't VM drop query after a query timeout?
VictoriaMetrics stops query execution after -search.maxQueryDuration (30 seconds by default), but sometimes the query duration may exceed this value if the query selects too big number of time series over big time range exceeding a month. In this case VictoriaMetrics falls back to scanning global inverted index in order to find time series matching the given label selectors from the query. This operation may exceed -search.maxQueryDuration if the total number of time series in the database is too big (hundreds of millions or more). The total number of time series may be obtained via querying /api/v1/series/count . The global index scan should be included in -search.maxQueryDuration accounting in future releases.
valyala
on 22 Jul 2020
Sure. Here are the graphs.
Index:
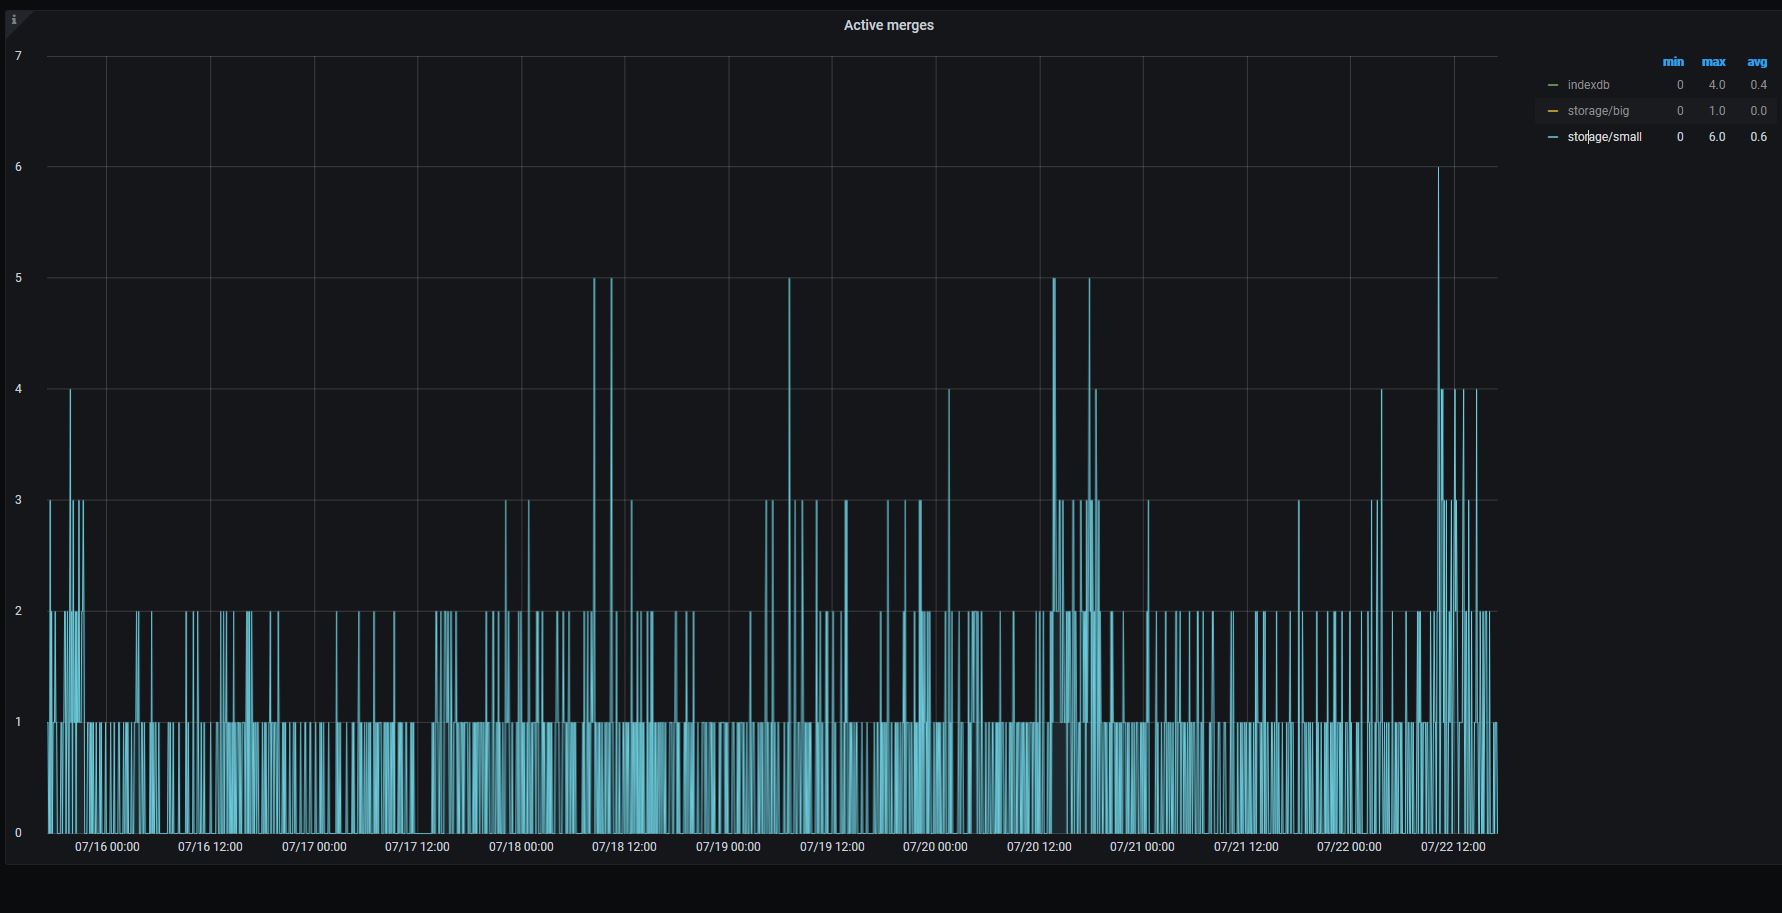
Small:
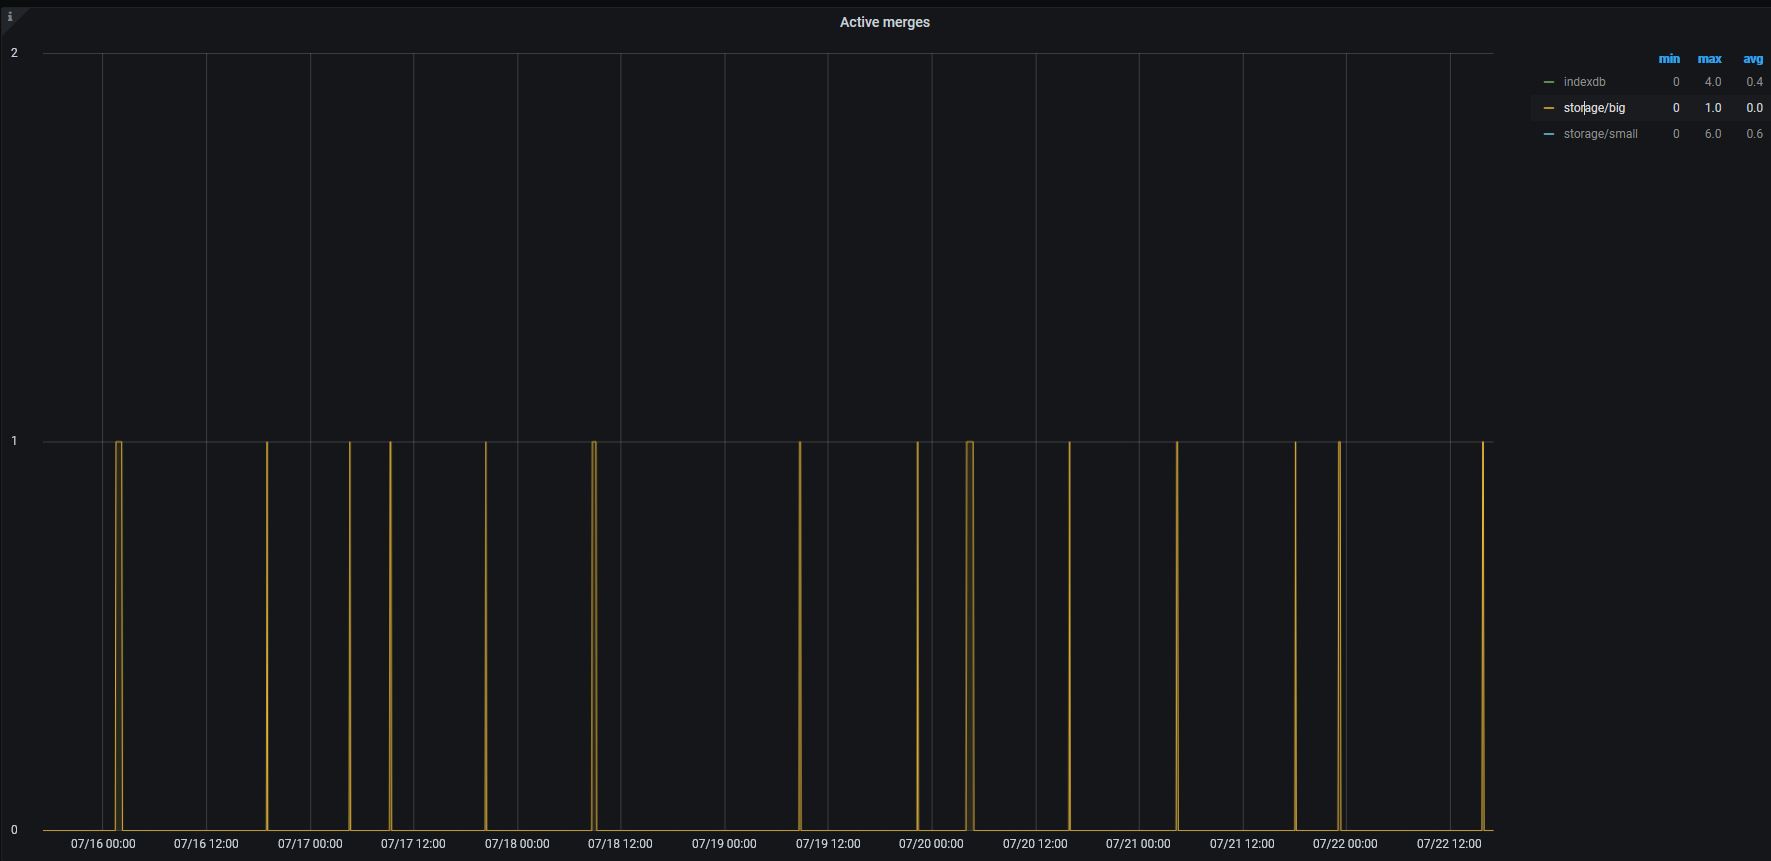
Storage
And here is the series count (don't pay attention to localhost - VM is working in Openshift in our environment):
$ curl http://localhost:8428/api/v1/series/count
{"status":"success","data":[1032059474]}
floppy-engineer
on 22 Jul 2020
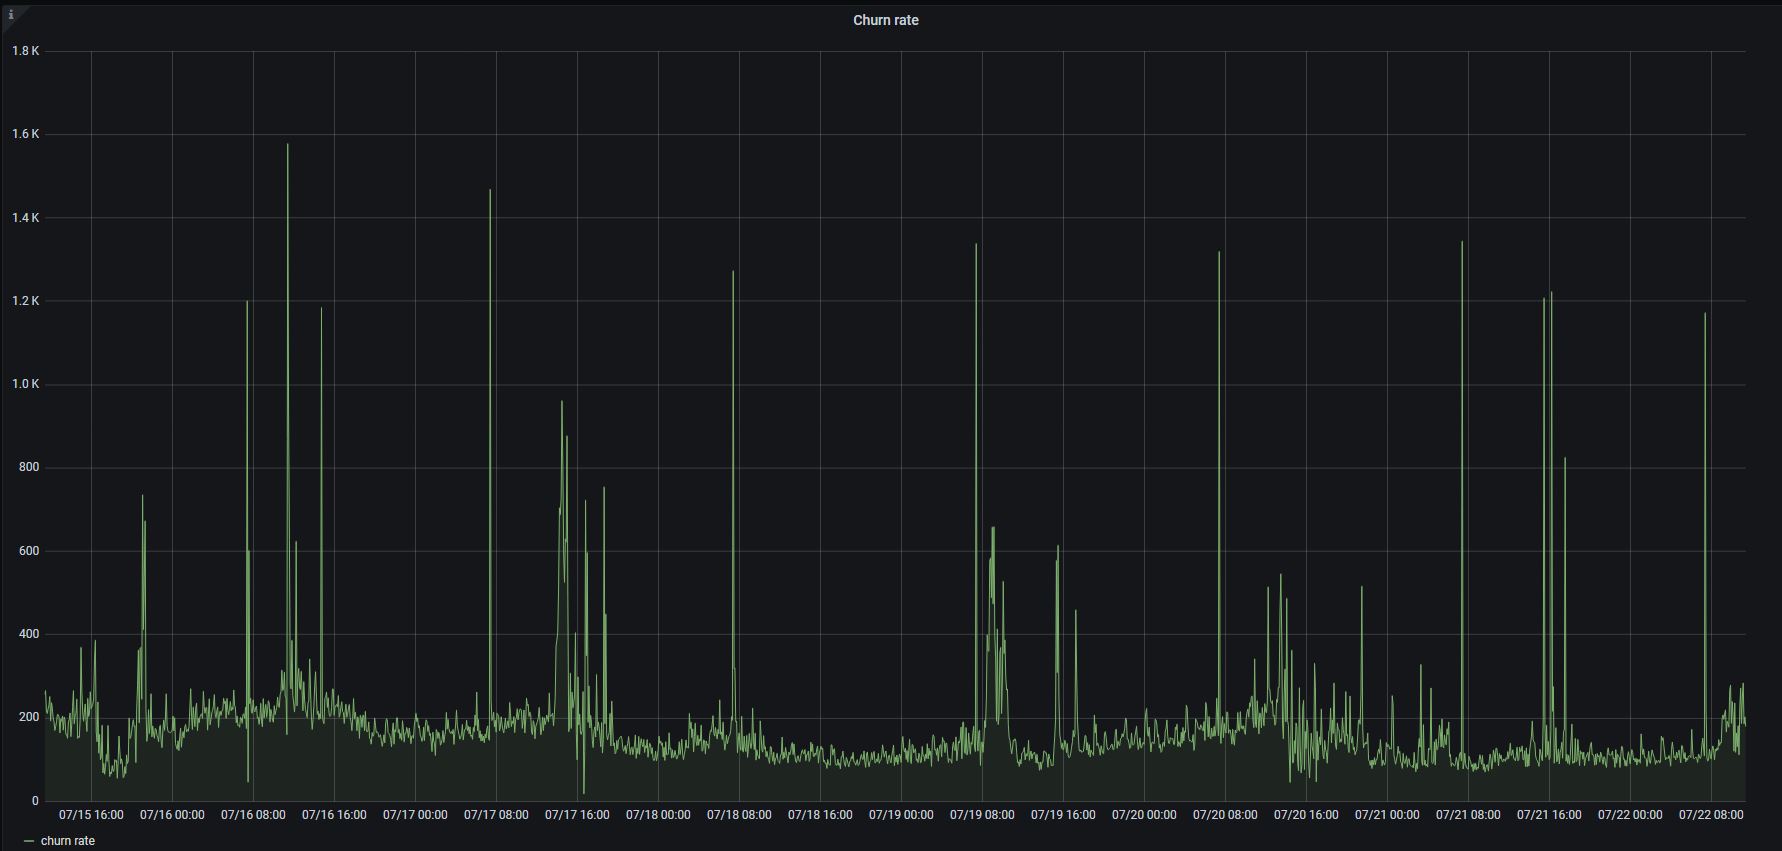
The last screenshot clearly shows that there were no big merges during disk read utilization spikes. So it is likely these spikes are related to something else. Could you share the following graphs from VictoriaMetrics dashboard on the same time range?
- Churn rate
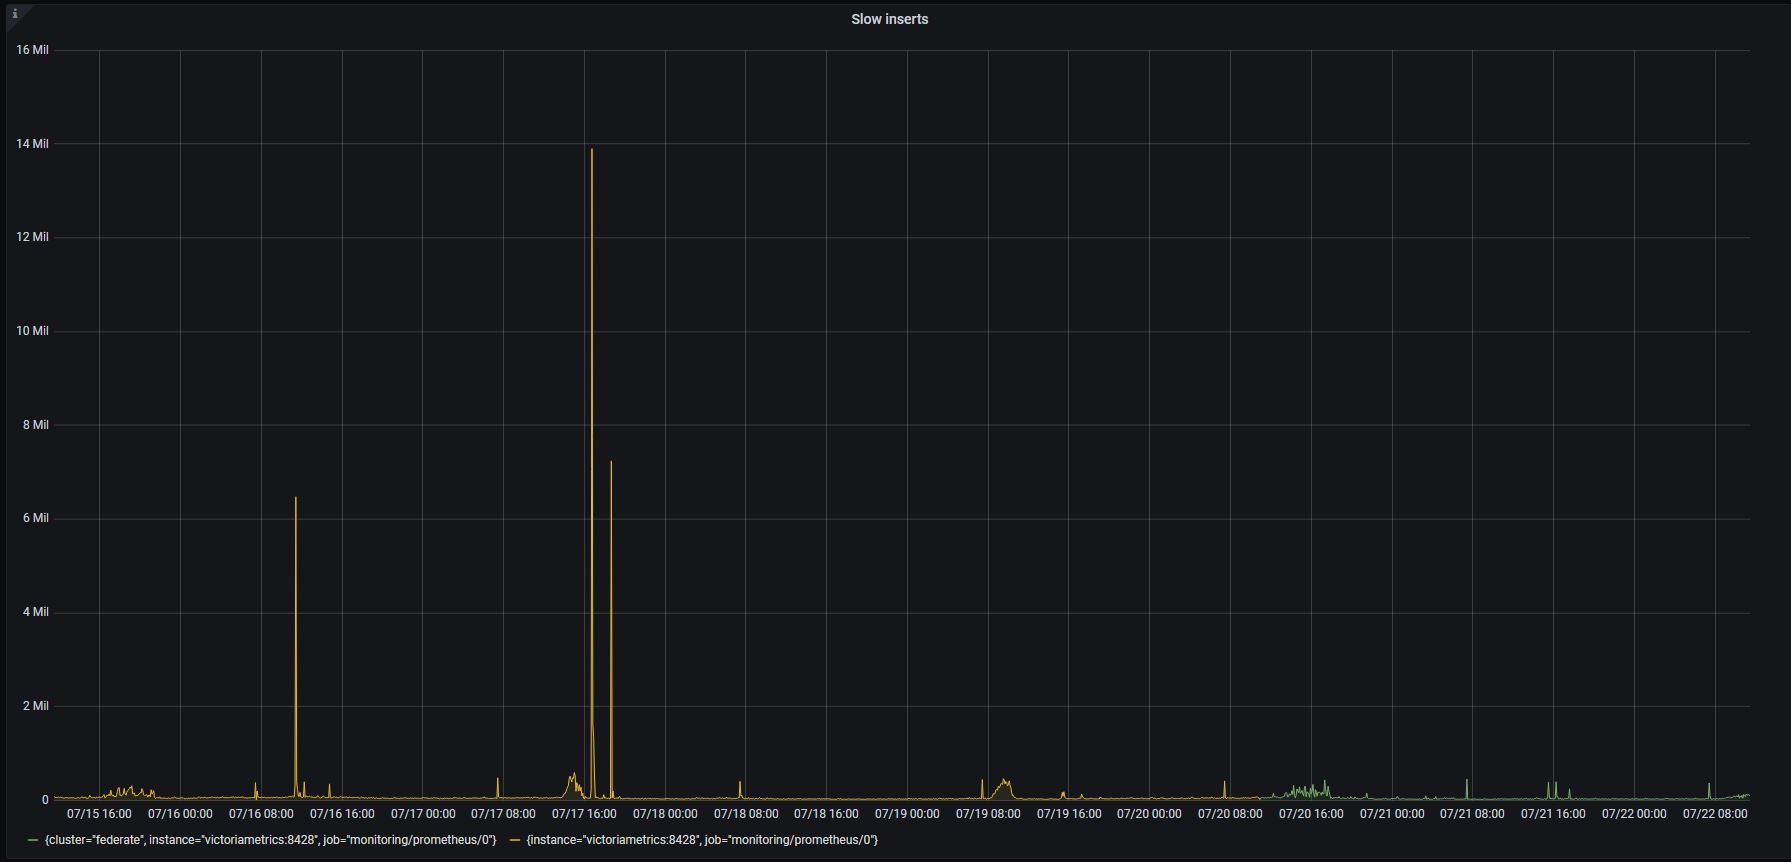
- Slow inserts
valyala
on 23 Jul 2020
Sure. Here they are:
floppy-engineer
on 23 Jul 2020
These graphs look quite good.
Could you check VictoriaMetrics logs for error messages containing slow query according to -search.logSlowQueryDuration during disk read utilization spikes?
valyala
on 23 Jul 2020
Sorry, but no - we don't have logs for that period of time.
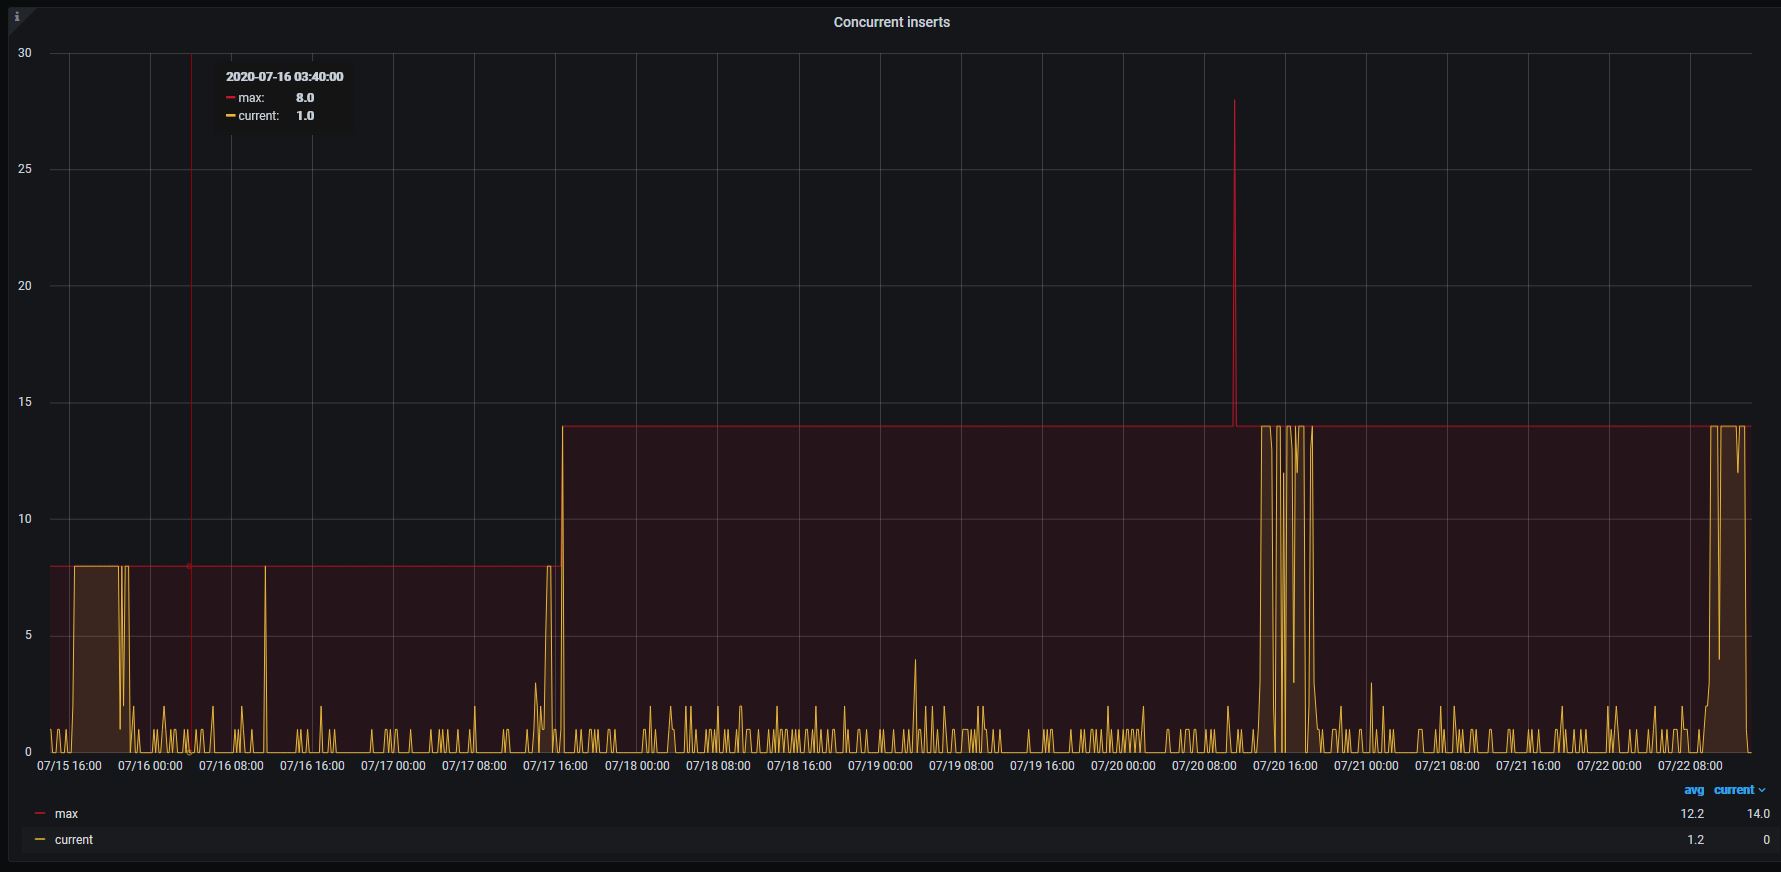
But I see another spike since than, a small one, but almost the same symptoms (high iowait, high "concurrency insert").
And I manage to find logs like this:
2020-07-22T19:43:04.894Z info VictoriaMetrics/app/vmselect/promql/exec.go:29 slow query according to -search.logSlowQueryDuration=5s: duration=113.544 seconds, start=1595446840, end=1595446840, step=300, query="count({cluster=\"XXX\"})"
2020-07-22T19:43:04.894Z warn VictoriaMetrics/app/vmselect/main.go:244 error in "/api/v1/query?query=count(%7Bcluster%3D%22XXXX%22%7D)&time=1595446872": error when executing query="count({cluster=\"orgchart\"})" for (time=1595446840000, step=300000): timeout exceeded while fetching data block #1 from storage: 60.000 seconds; the timeout can be adjusted with -search.maxQueryDuration command-line flag
floppy-engineer
on 23 Jul 2020
The query count({cluster="XXX"}) can lead to disk read utilization spike if the database contains big number of time series with {cluster="XXX"} label. The query reads all these time series, so it may take high disk read bandwidth for long time.
Could you also build graphs for the following queries on the original time range in order to verify this hypothesis?
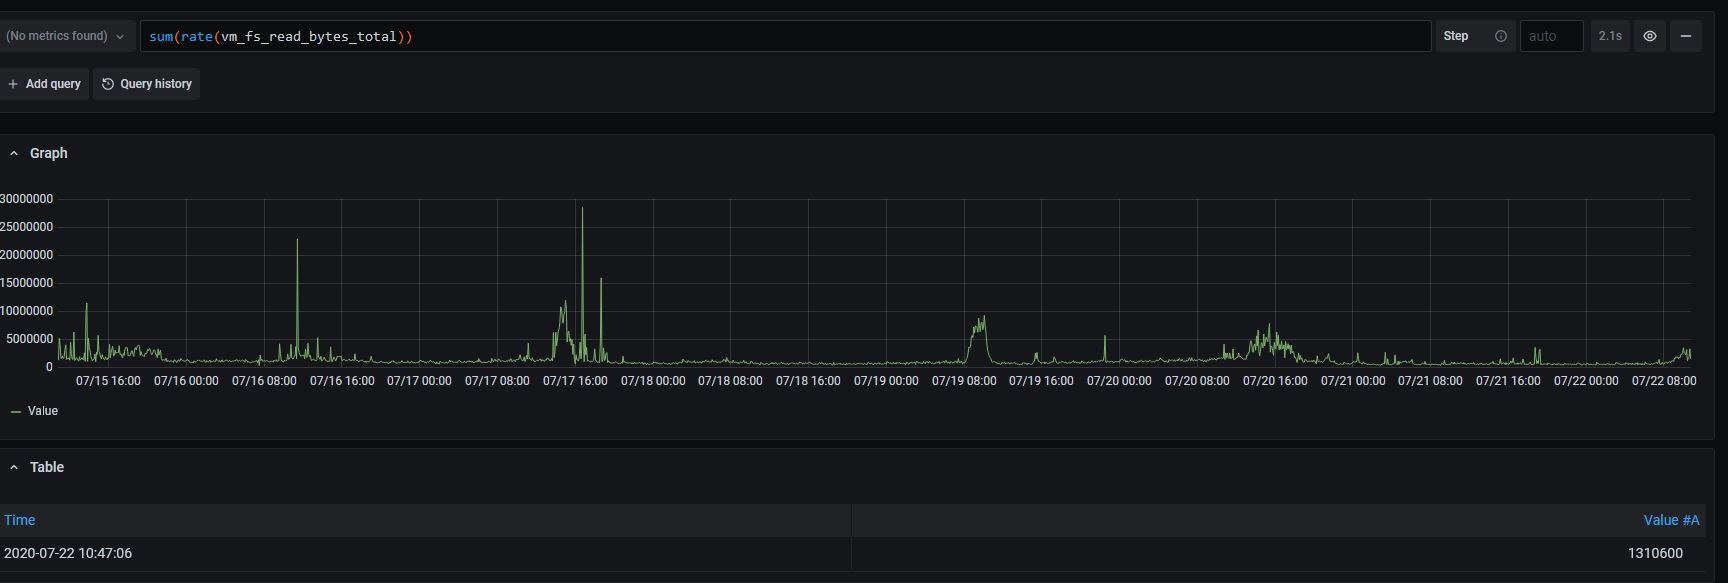
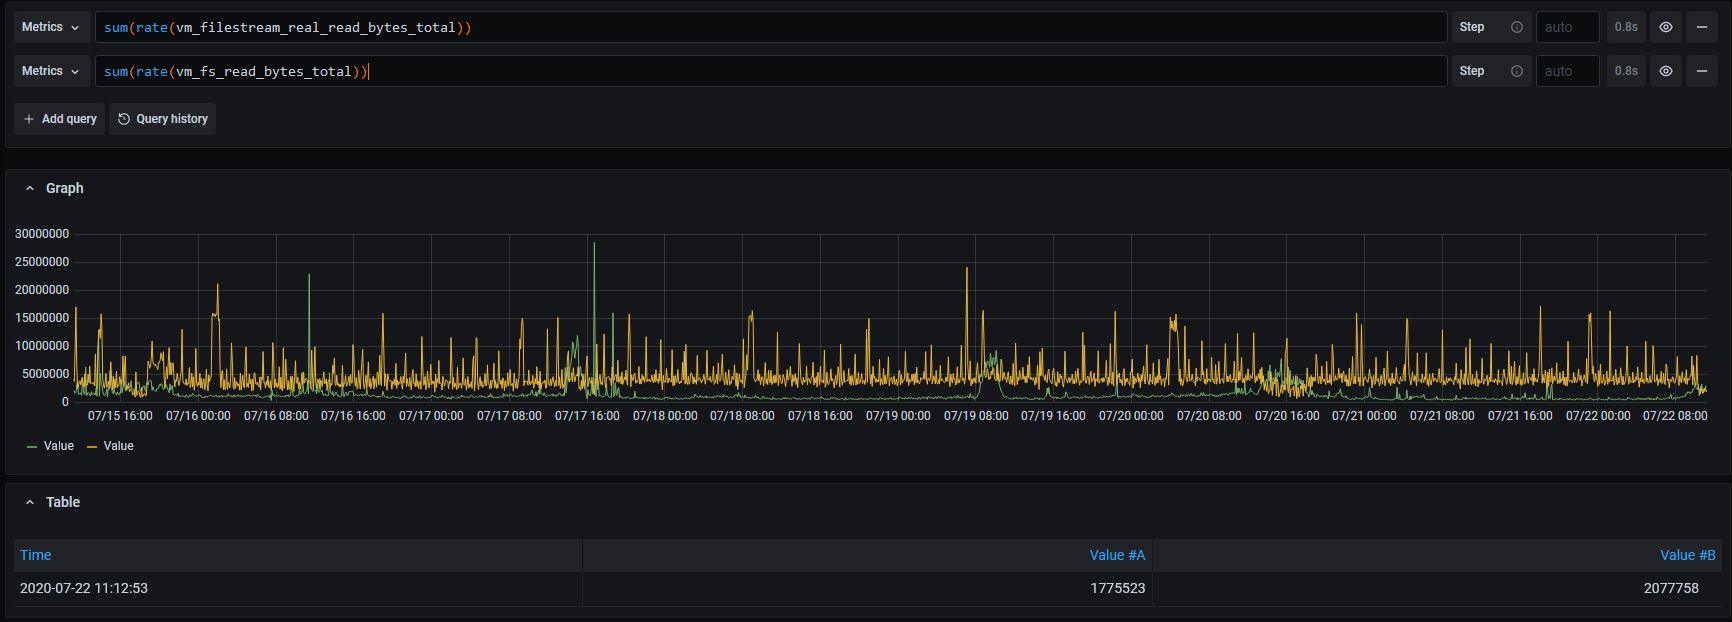
1) sum(rate(vm_fs_read_bytes_total)) - it will show disk read bandwidth in bytes/sec induced by incoming queries;
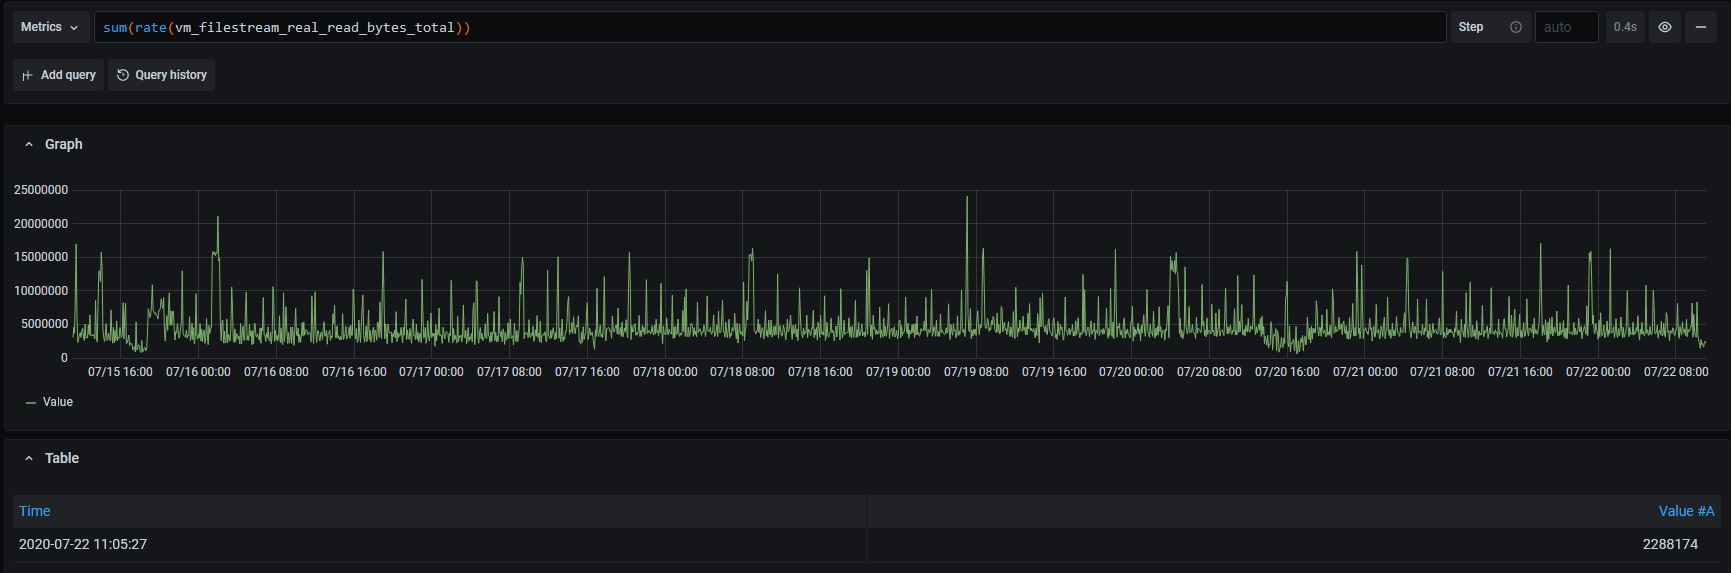
2) sum(rate(vm_filestream_real_read_bytes_total)) - it will show disk read bandwidth in bytes/sec induced by background merging process.
valyala
on 23 Jul 2020
FYI, a vew commits have been landed to the repositry, which should improve prioritizing for data ingestion over heavy queries. See https://github.com/VictoriaMetrics/VictoriaMetrics/issues/291 for details. These commits will be included in the next release.
In the mean time you can build VictoraMetrics from the commit 039c9d244169a3e8ffcd089c80472753ca0209b9 and verify whether it prevents from data ingestion slowdown when executing heavy queries. See instructions on how to build VictoriaMetrics from sources.
valyala
on 23 Jul 2020
count({cluster=}) looks like a customer query. Meantime I thought VM should count series not read all their data. Such operation is covered by index IMHO.
Here are the requested graphs:
and both together for overlapping to be seen:
Regarding the newest version. As soon we don't know what exactly cause the issue, we can't get proof the update solves the problem. If we apply and won't see such behavior that could means either the working fix or just absent of the problem request/operation in that period.
Thanks anyway. Since I put bigMergeConcurrency=1 we haven't seen the issue anymore.
floppy-engineer
on 24 Jul 2020
Thanks for posting the graphs! They definitely show that the issue is related to heavy queries that touch big number of time series and/or big amounts of data - see spikes for the sum(rate(vm_fs_read_bytes_total)) graph.
count({cluster=}) looks like a customer query. Meantime I thought VM should count series not read all their data. Such operation is covered by index IMHO.
Unfortunately, such operation requires reading all the data for matching time series - count() is calculated at regular intervals (they equal to step query arg passed by Grafana to /api/v1/query_range) on the specified time range. If particular time series has no value at any interval, then count doesn't take it into account at the given point. But this time series may be taken into account at any other points where it has non-empty value. This means that count() needs to read all the raw datapoints for all the requested time series on the requested time range.
Since I put bigMergeConcurrency=1 we haven't seen the issue anymore.
The graph on the number of concurrent merges and the graph on sum(rate(vm_filestream_real_read_bytes_total)) shows that the issue isn't related to background merges, since these graphs don't correlate with disk read utilization spikes. So setting -bigMergeConcurrency shouldn't help preventing the issue.
FYI, all the improvements mentioned in this issue have been included in v1.39.0 release. I'd recommend trying to upgrade to this release and checking whether it prevents data ingestion slowdowns during heavy queries.
valyala
on 24 Jul 2020
Thanks! We've updated up to 1.39.0. Everything is fine for now. Let's wait for a while (1week) before closing the issue.
floppy-engineer
on 27 Jul 2020
Nope. We've bumped into it again. I found a source of the request you mentioned (count({cluster=XXX})) and delete it. But nevertheless it was just a dashboard request. Will see further.
This time it longs not for long as in previous. Maybe, it's the result of your changes. Thanks.
floppy-engineer
on 29 Jul 2020
We've bumped into it again. I found a source of the request you mentioned (count({cluster=XXX})) and delete it
The count({cluster=XXX}) request should be interrupted much quicker starting from v1.39.0 according to the configured -search.maxQueryDuration. Previously such a request may hang for much longer duration. Could you confirm this? Which value does VictoriaMetrics have for -search.maxQueryDuration in your setup?
valyala
on 29 Jul 2020
Yes, I confirm that now it unfreeze much-much quicker (but not 1min)
-search.maxQueryDuration set to 1m
maybe it's overlapping maxqueryduration=1m and grafana dashboard auto update < 1min. I can't say in particular how often a user sets update interval.
floppy-engineer
on 29 Jul 2020
@floppy-engineer , it has been appeared that v1.39.0 and v1.39.1 releases have incorrect prioritizing between merging of small parts and big parts. This could result in increased number of parts and increased CPU usage during queries. This has been fixed in v1.39.2.
valyala
on 30 Jul 2020
Thanks. I'm installing it today.
Meanwhile we faced our issue yesterday again (v1.39.1) - just FYI.
floppy-engineer
on 31 Jul 2020
Nope. v1.39.2. Some user's read queries put down the whole VM with total disk readings.
floppy-engineer
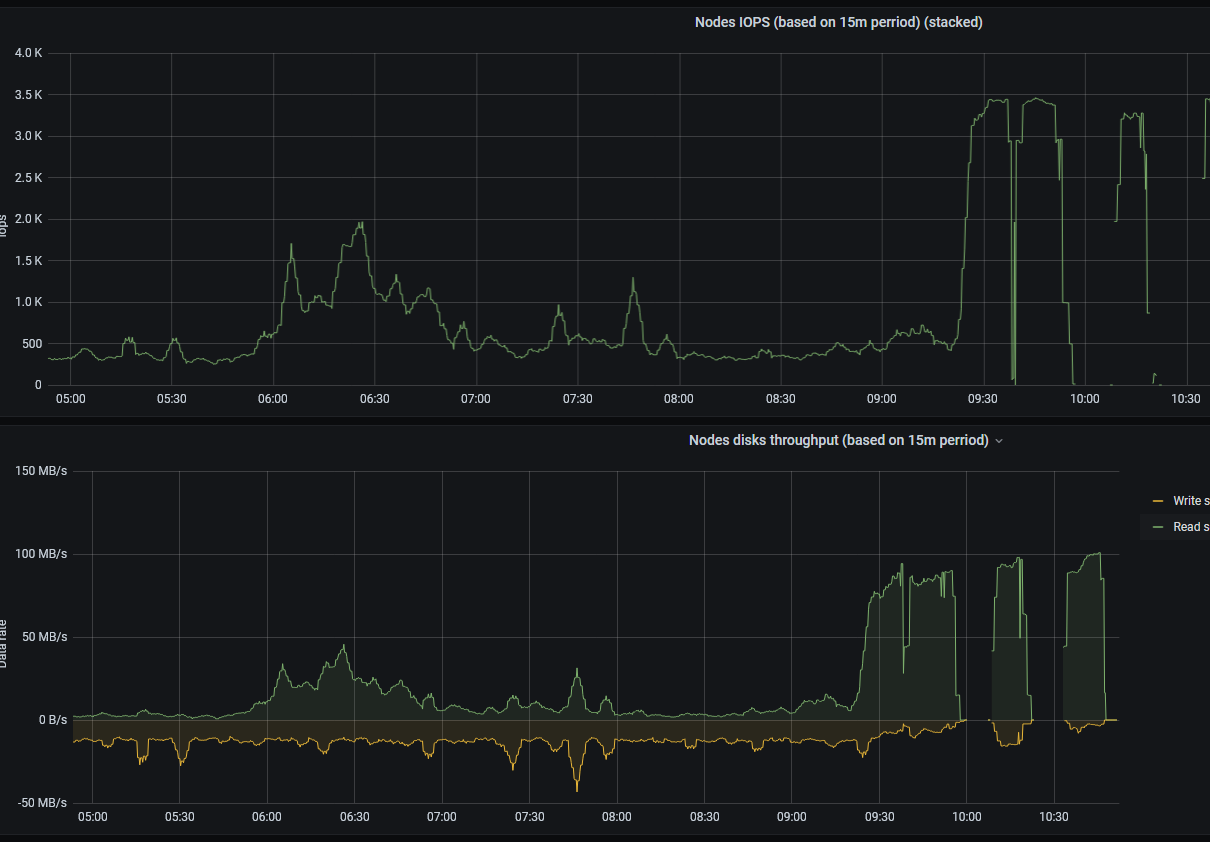
on 3 Aug 2020
@floppy-engineer , could you search for slow query according to -search.logSlowQueryDuration=...: duration=... seconds messages in VictoriaMetrics logs on time ranges with high disk read utilization and check whether the duration=... exceeds significantly the duration set at -search.maxQueryDuration command-line flag? Under significantly I mean more than 10% - for instance, if -search.maxQueryDuration is set to 1m, then duration=70s is significant, while duration=63s is OK. It is assumed that VictoriaMetrics v1.39.2 was running during this time frame.
valyala
on 4 Aug 2020
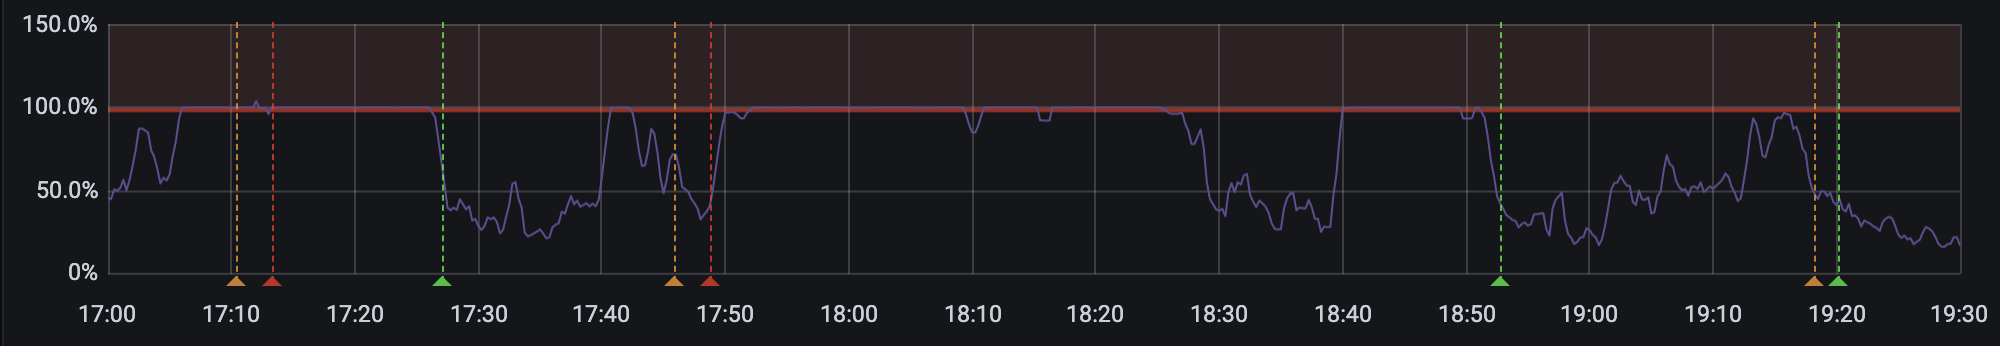
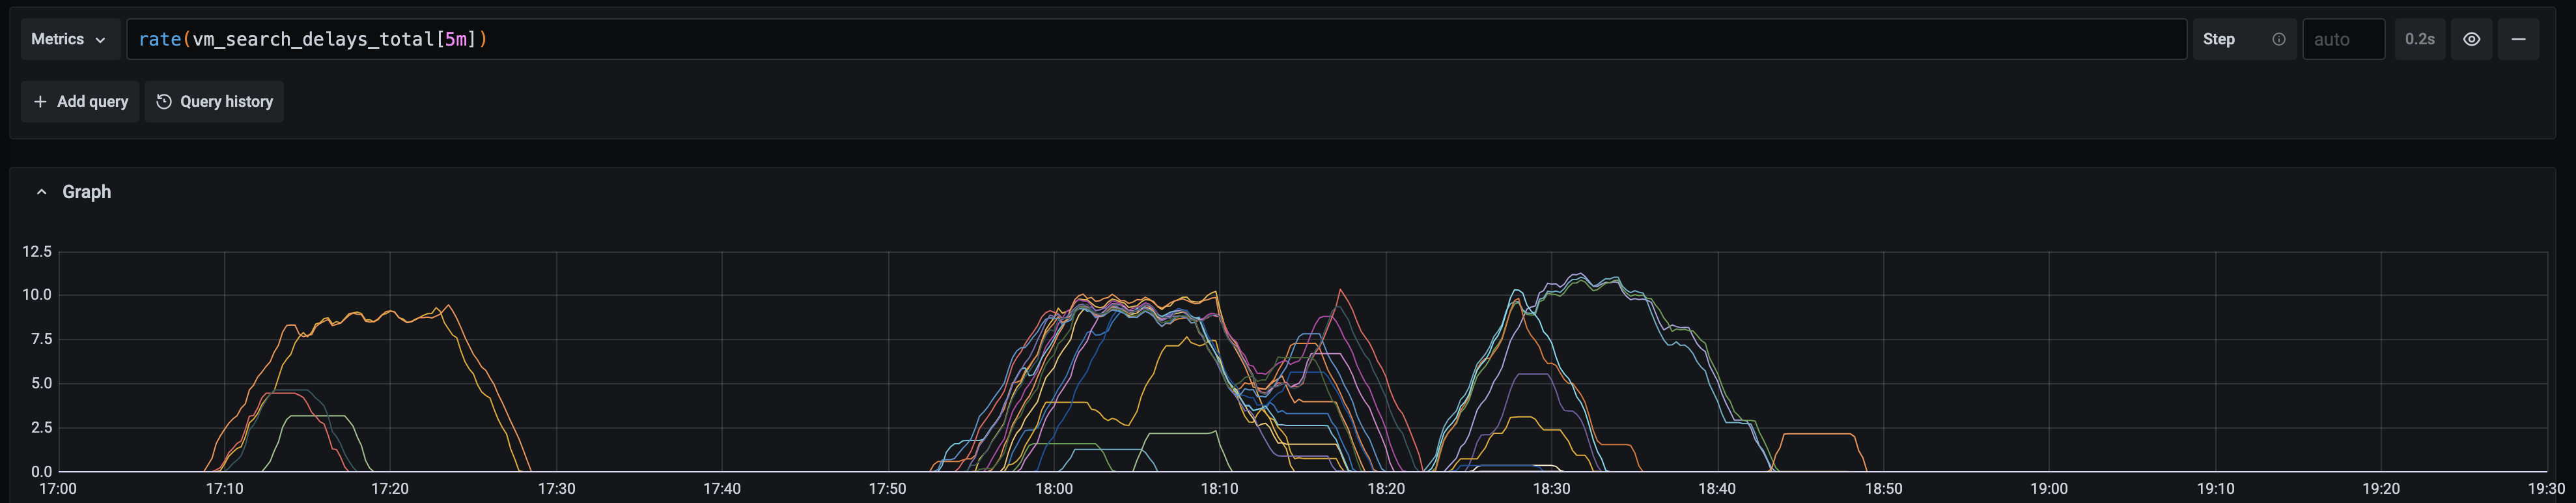
Could you also share graph for rate(vm_search_delays_total[5m]) on the time range from the graph above?
valyala
on 4 Aug 2020
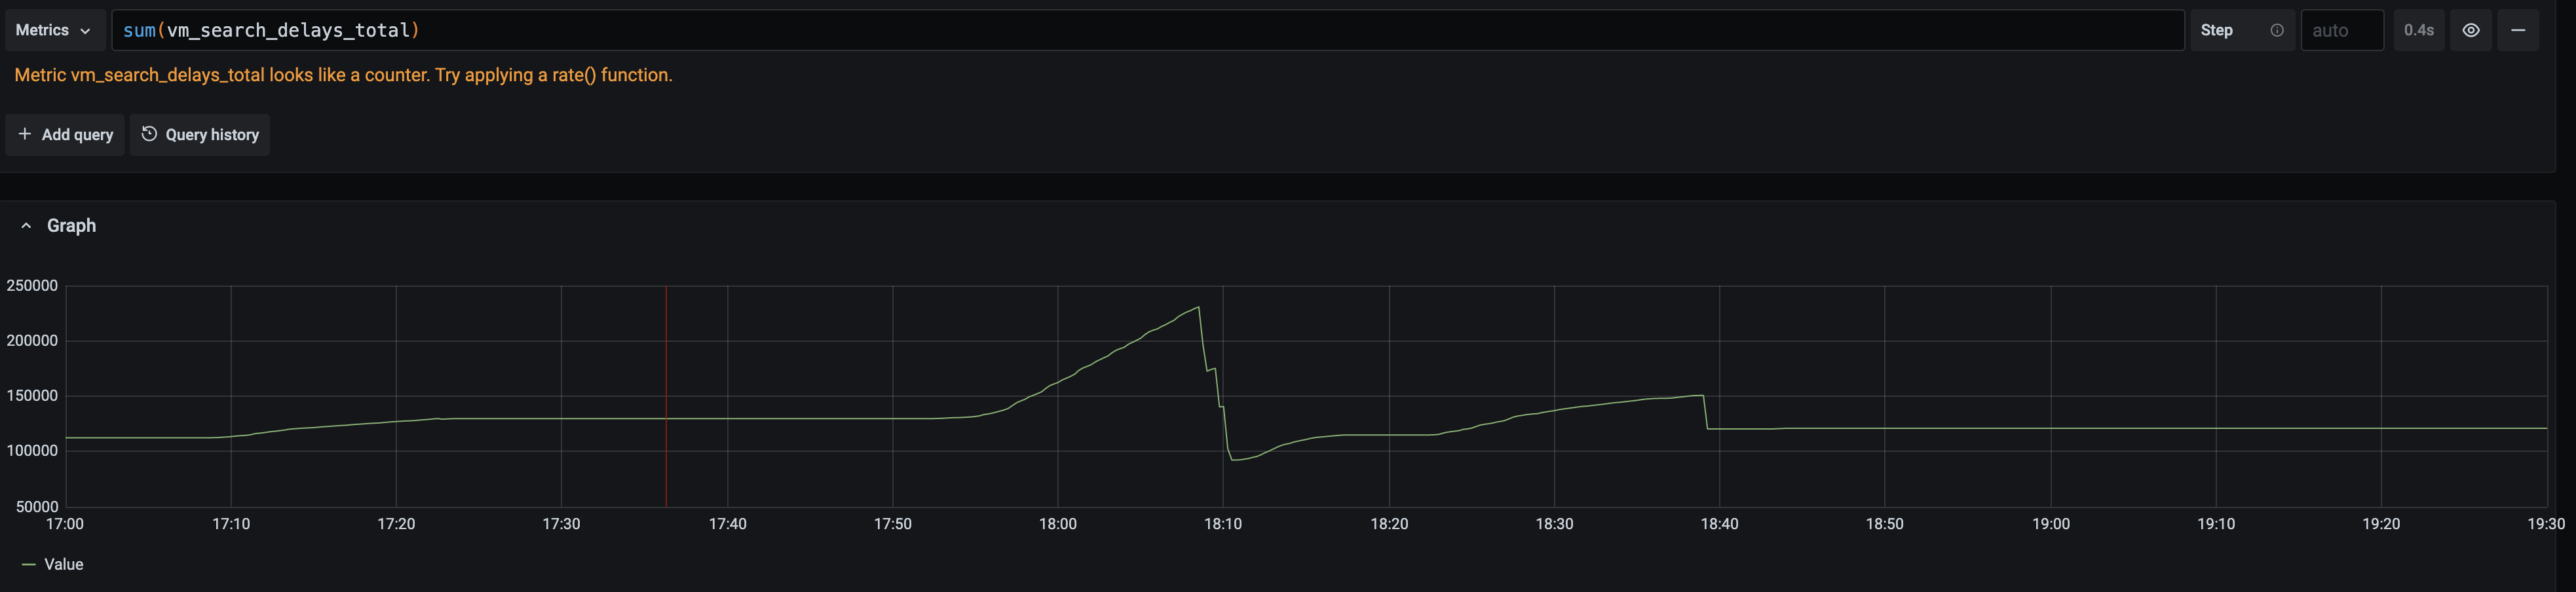
Here it is:
- Graph to set the proper timing
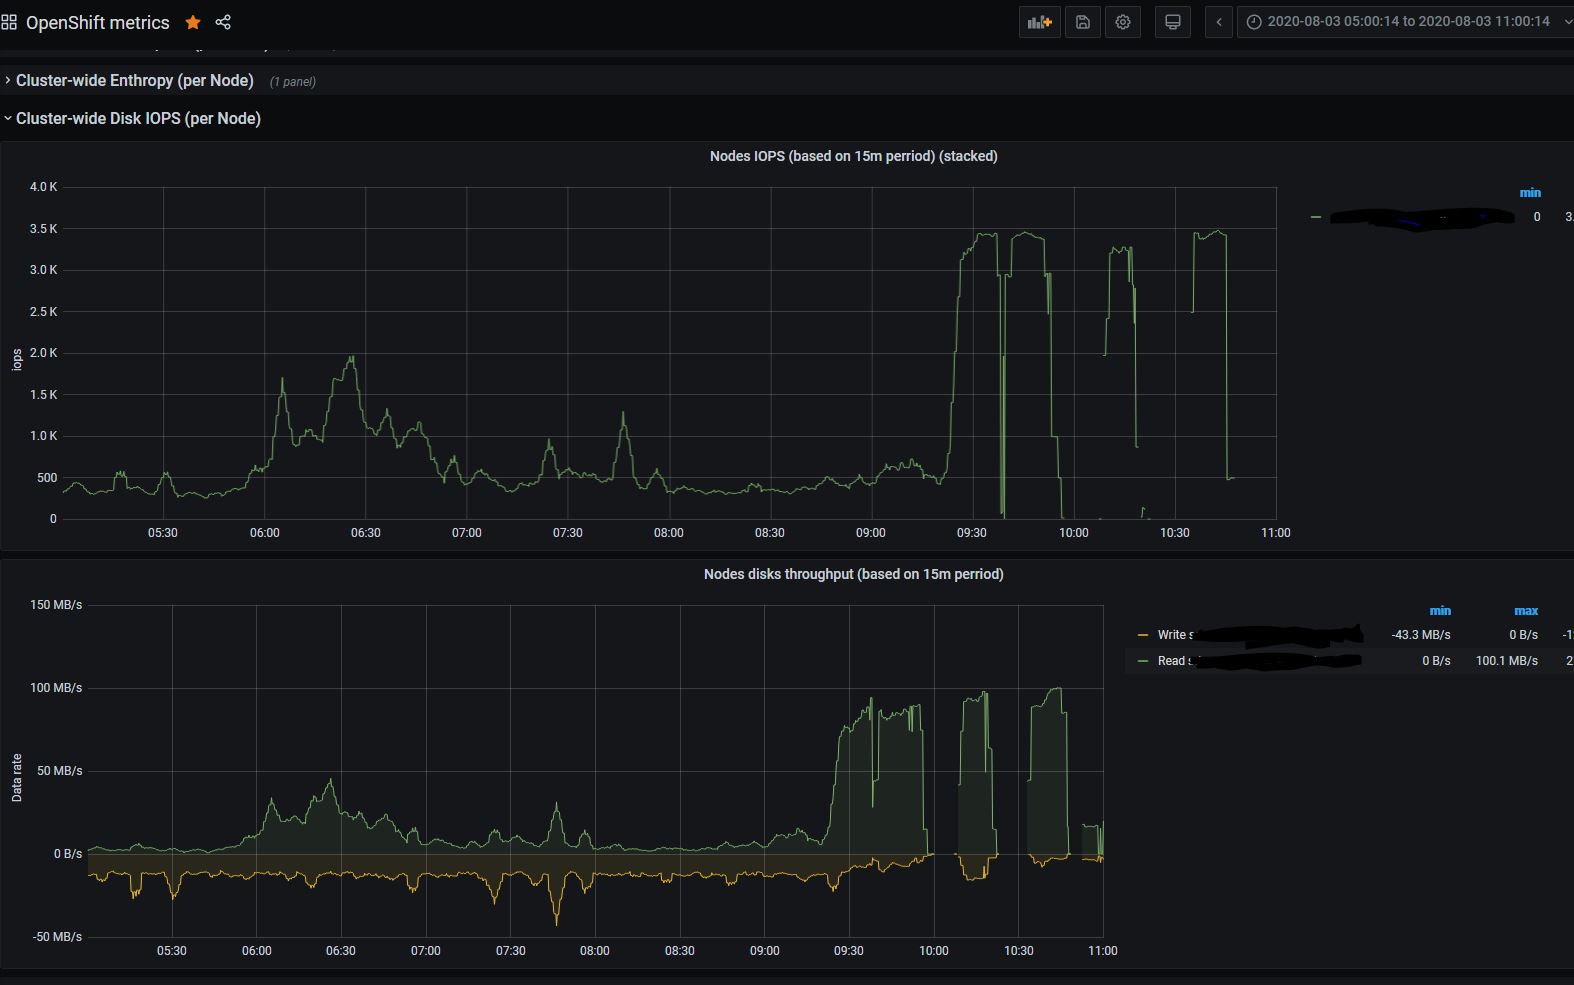
- Graph you asked:
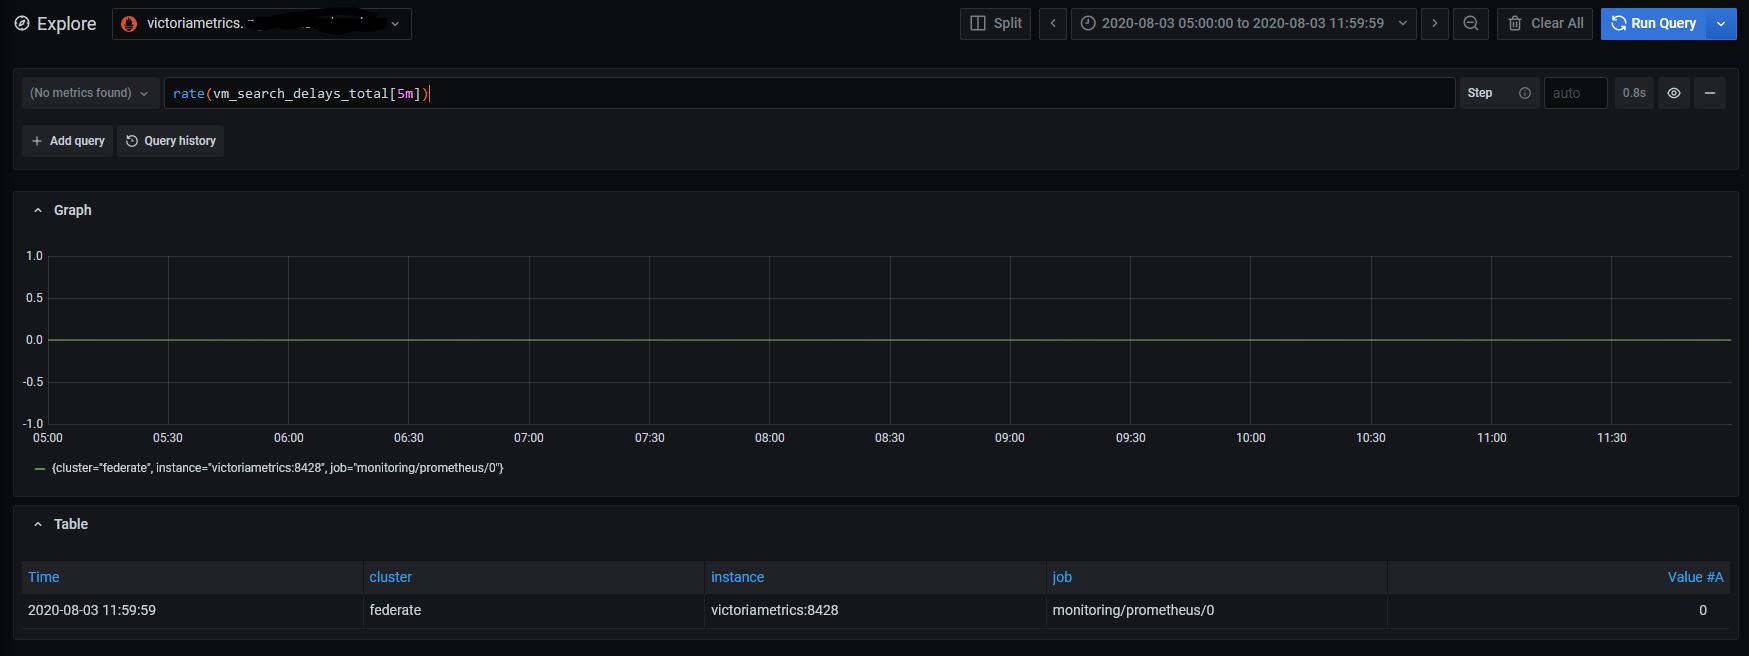
- there are no such requests. There are requests that around maxQueryDuration, but no one that significantly higher (max are +~2sec).
floppy-engineer
on 5 Aug 2020
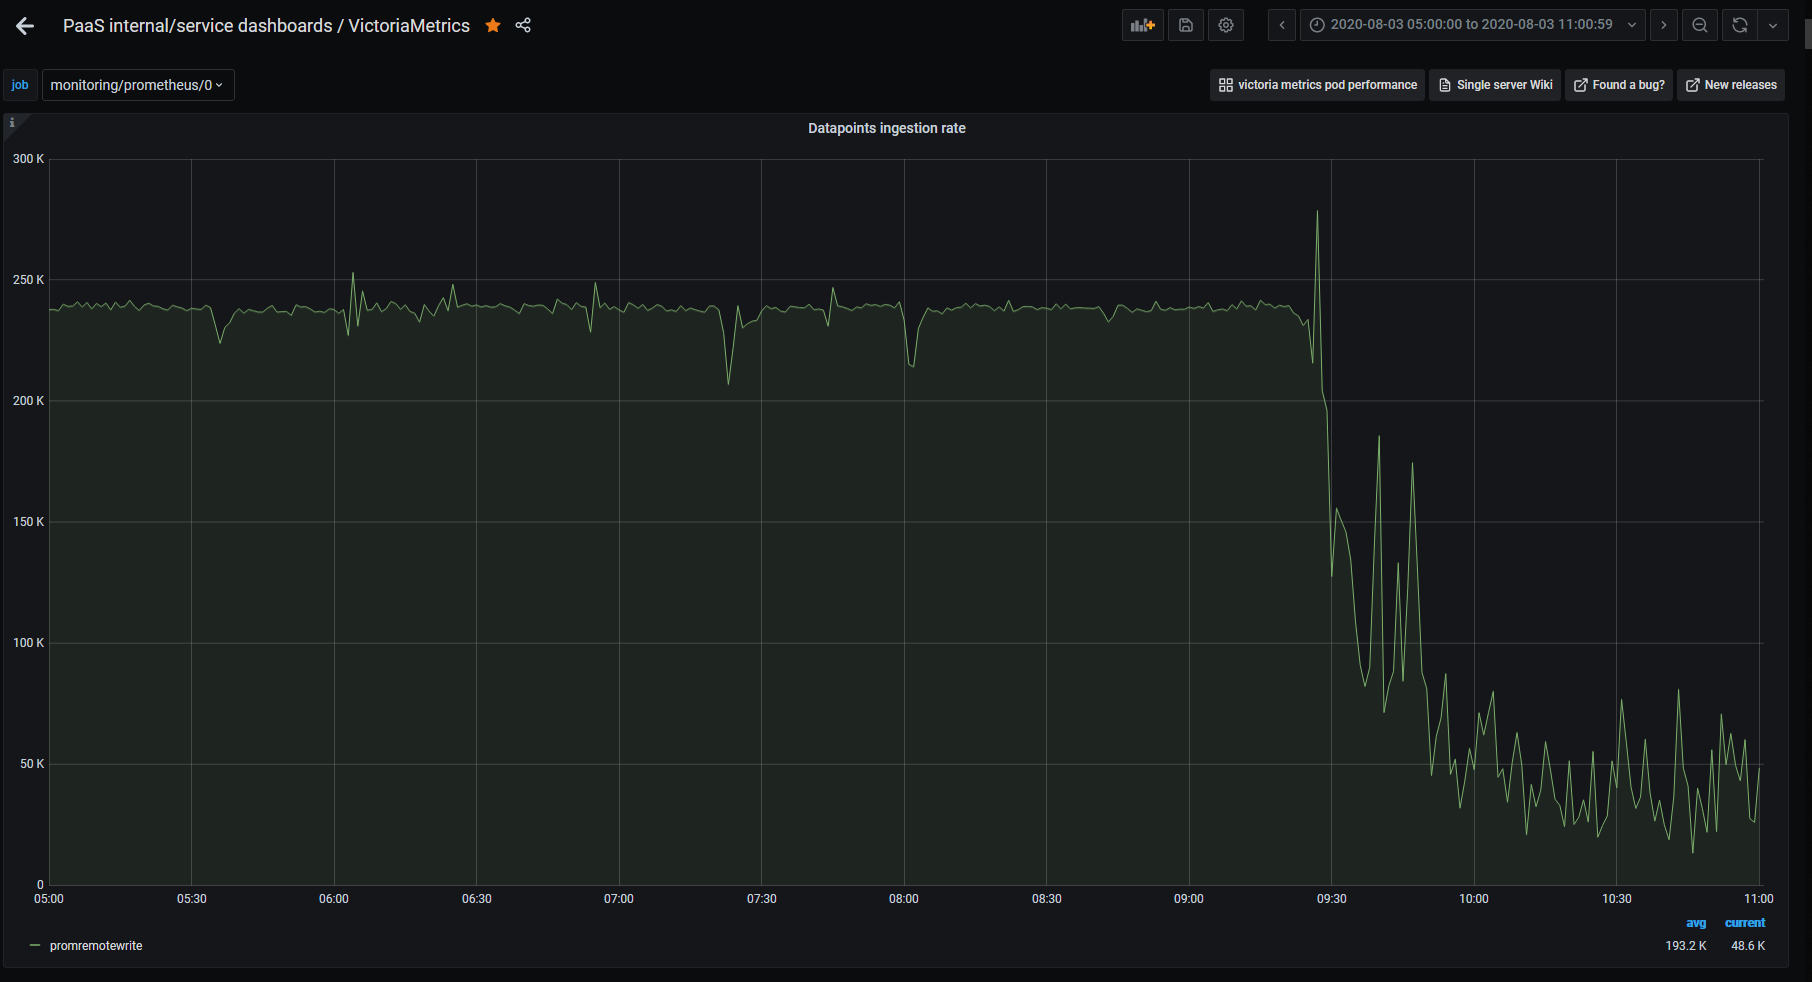
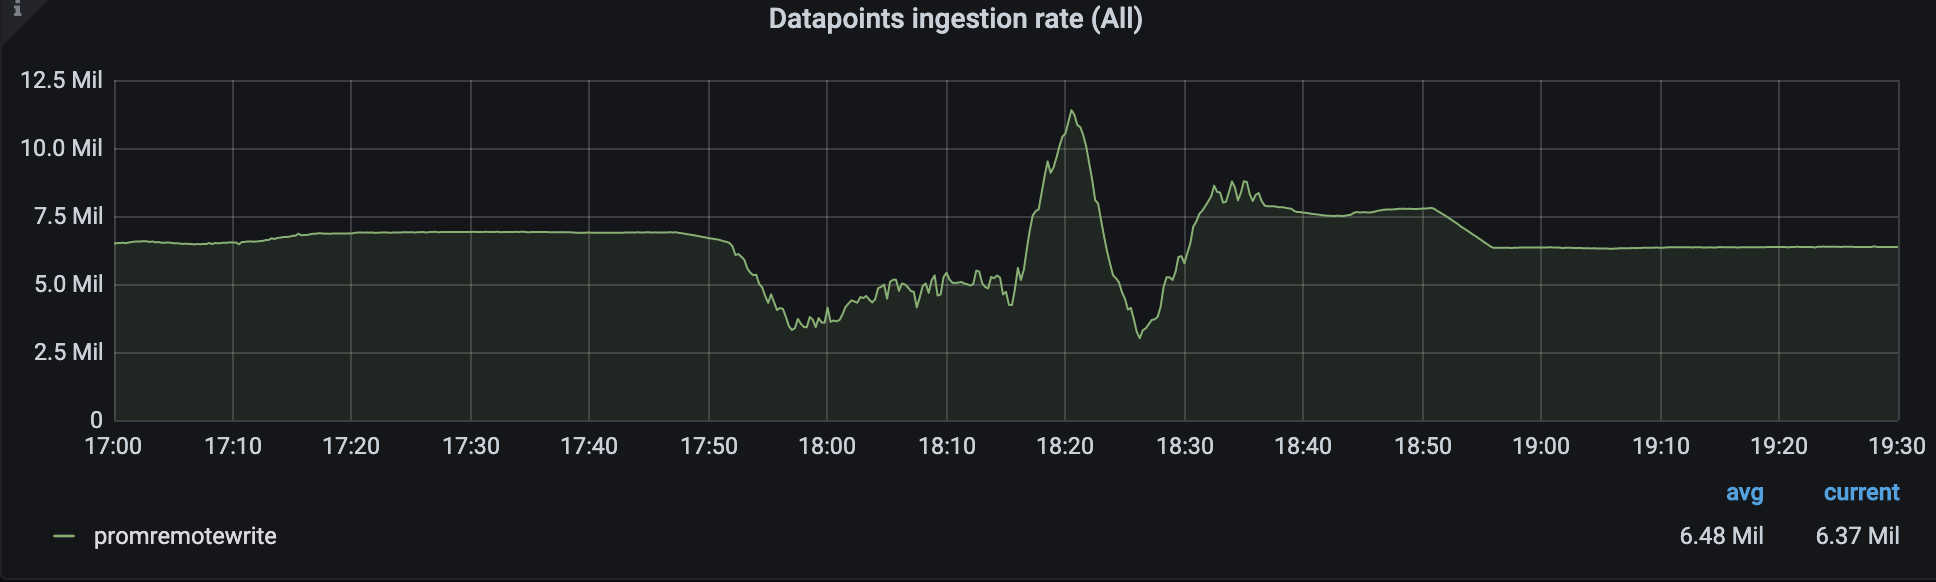
The graph for rate(vm_search_delays_total[5m]) shows that VictoriaMetrics didn't slow down queries during high disk read usage. Could you also share ingestion rate graph from the official VictoriaMetrics dashboard on the same time range? This will help determining whether disk ingestion prioritizing over heavy queries works as expected.
there are no such requests. There are requests that around maxQueryDuration, but no one that significantly higher (max are +~2sec).
This is good news! This means that the patch for limiting query duration works as expected.
Probably, there were many concurrent heavy queries executed during high disk read usage. The number of concurrent queries may be limited with -search.maxConcurrentRequests command-line flag. Default value for this flag should work OK in practice, so it isn't recommended modifying it. Sometimes the -search.maxConcurrentRequests flag value may be reduced in order to reduce the maximum RAM usage and CPU trashing. Note that VictoriaMetrics may accept and process more than -search.maxConcurrentRequests concurrent requests - it just puts overflow requests to a queue until the number of concurrently executing requests becomes lower than the configured value. Pending requests may wait for up to -search.maxQueueDuration in the queue.
valyala
on 5 Aug 2020
Here is the ingestion rate. The slump is in place of total reading.
I already set search.maxConcurrentRequests=5. No sign of issue since. Continue to monitor. Thanks!
floppy-engineer
on 6 Aug 2020
It looks like the prioritizing of data ingestion over heavy queries may not work as expected according to the graph for ingestion rate :( I'll look into it further.
valyala
on 6 Aug 2020
We're facing the exact same issue for a couple of days, during the absolutely very high IO read, tons of query are delayed. Pic below is the IO usage of one of our storage nodes(others are the same).
and the delayed queries:
But the data ingestion seems work fine in our cases(some drops may caused by the high machine load original caused by high IO read).
Which make us thinking that the priority to the data ingestion may not be a good idea, because if queries are blocked, all of the alerts may be failed(that's the time when user complains).
We still have no idea what happened that cause the high IO read(no IO write too ) :(. We are trying to disable the priority to the data ingestion and see if things will get better.
Any other ideas? @valyala
version: cluster version of v1.38.1
 dxtrzhang
on 6 Aug 2020
dxtrzhang
on 6 Aug 2020
PS: Since v1.38.1 can't actually "timeout" a query, so we roughly add a flag to limit the maxQueryDuration on storage end, but it seems not working :(
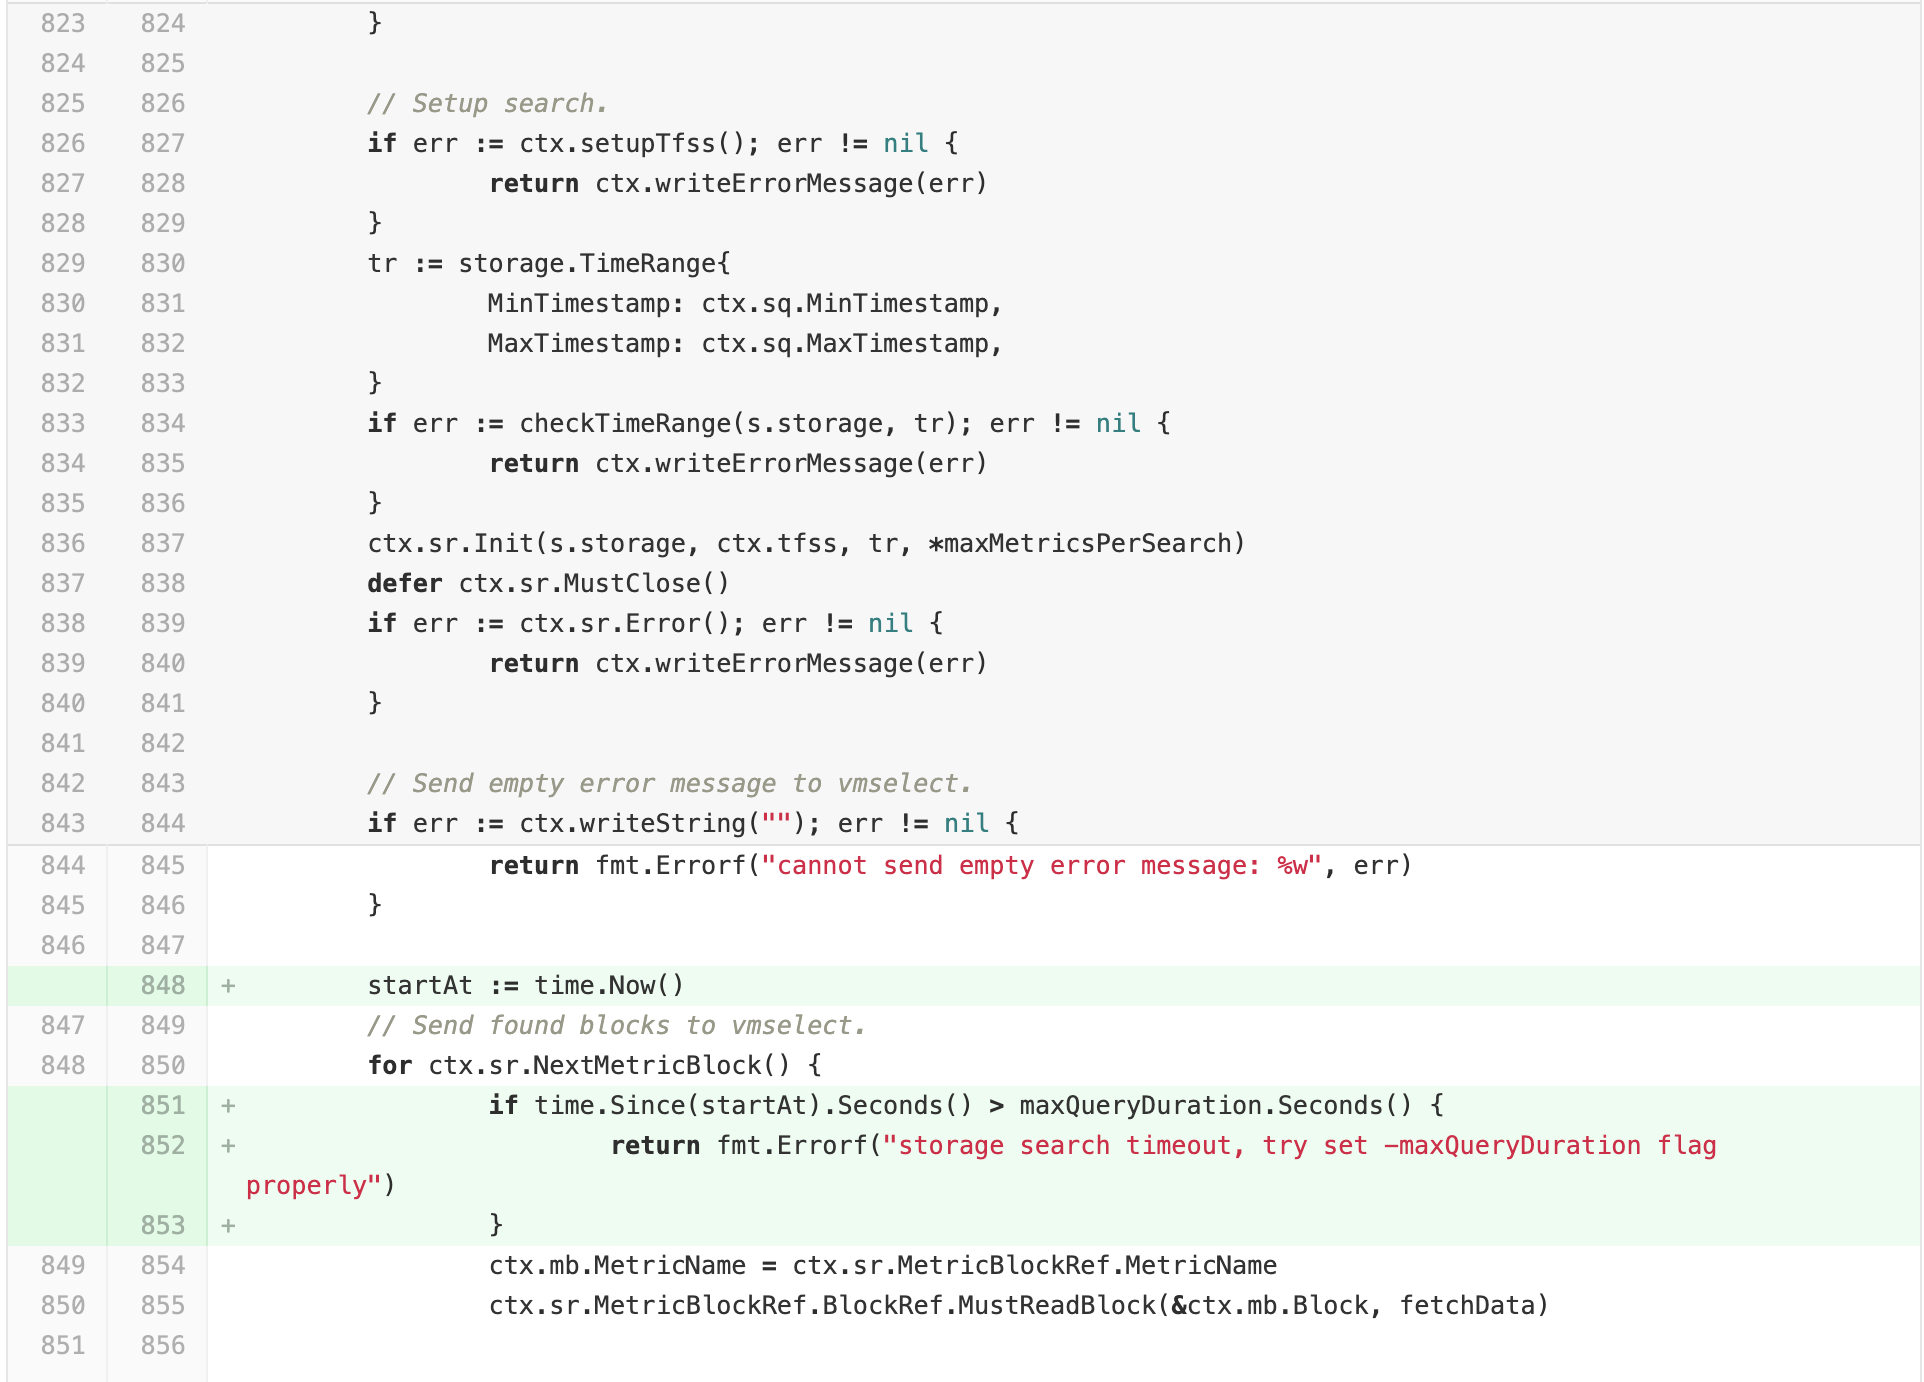
is this because the data ingestion block the metric block read?
dxtrzhang
on 6 Aug 2020
There were numerous optimizations added to v1.39.4, which are related to prioritizing data ingestion over querying. @dxtrzhang , @floppy-engineer , could you try this release and report whether it works better than v1.39.3 for your workloads?
valyala
on 9 Aug 2020
Actually, after we removing a storage node out of query scope(keep insert). The IO read load still rise rapidly. Heavy queries may be one of some reasons of the high IO reading. We are still looking for the possible reasons. We'll update what we find out to this issue.
dxtrzhang
on 9 Aug 2020
Ok, we updated to v1.39.4 but the issue is still here( Just tonight bumped into it again. Reading disk activity paralyze all other actions for ~8hours.
floppy-engineer
on 13 Aug 2020
same here @floppy-engineer .
Seems like after the high IO, It would always took a long time to recover, even if we shut down all the vmselect instances . restart all the storage nodes seems to be a solution, after shutting down select and restarting storage nodes, high IO still exists, and took about 10 minutes to recover.
I guess merging may be related...
still looking into it
dxtrzhang
on 13 Aug 2020
We have search.maxQueryDuration=30s but nevertheless see in a log something like
| 2020-08-13T15:13:17.405Z warn VictoriaMetrics/app/vmselect/promql/exec.go:29 slow query according to -search.logSlowQueryDuration=5s: duration=806.907 seconds, start=1597327170, end=1597330770, step=30, query="XXX"
I suppose it's not the root cause but just consequences because the queries are different every time.
The question is why such long queries aren't terminated after deadline?
floppy-engineer
on 13 Aug 2020
I guess merging may be related...
@dxtrzhang , could you check graphs for the following queries during high disk IO?
rate(vm_filestream_real_read_bytes_total[5m])rate(vm_filestream_buffered_written_bytes_total[5m])
These queries will show disk read and write activity related to background merging.
Monitoring of VM components must be enabled for collecting these graphs.
The following query will show disk read activity related to query execution - rate(vm_fs_read_bytes_total[5m]).
We have search.maxQueryDuration=30s but nevertheless see in a log something like
| 2020-08-13T15:13:17.405Z warn VictoriaMetrics/app/vmselect/promql/exec.go:29 slow query according to -search.logSlowQueryDuration=5s: duration=806.907 seconds, start=1597327170, end=1597330770, step=30, query="XXX"
I suppose it's not the root cause but just consequences because the queries are different every time.
The question is why such long queries aren't terminated after deadline?
This is interesting question, since VictoriaMetrics should terminate all the queries that are executed longer than -search.maxQueryDuration starting from v1.39.0 as mentioned in the previous messages. Could you search for error logs containing timeout exceeded substring around the time frame with high disk IO? It would be also great if you could share the query from the error message above. You may mangle metric names and label filters if they contain sensitive info before sharing the query.
valyala
on 14 Aug 2020
yes, we see plenty of "timeout exceeded". but the query and block differ every time.
Here is around the time of my previous log messages:
2020-08-13T16:35:56.618Z warn VictoriaMetrics/app/vmselect/main.go:244 error in "/api/v1/query_range?query=increase(container_cpu_cfs_throttled_periods_total%7Bnamespace%3D~%22.%22%2Ccluster%3D%22XXX%22%2Cpod%3D~%22.%22%2Ccontainer!%3D%22%22%7D%5B15m%5D)%2Fincrease(container_cpu_cfs_periods_total%5B15m%5D)%3E0.02&start=1597332900&end=1597336500&step=30": error when executing query="increase(container_cpu_cfs_throttled_periods_total{namespace=~\".\",cluster=\"XXX\",pod=~\".\",container!=\"\"}[15m])/increase(container_cpu_cfs_periods_total[15m])>0.02" on the time range (start=1597332900000, end=1597336500000, step=30000): cannot execute query: cannot evaluate "increase(container_cpu_cfs_periods_total[15m])": timeout exceeded while fetching data block #11582 from storage: 30.000 seconds; the timeout can be adjusted with -search.maxQueryDuration command-line flag
2020-08-13T14:58:17.657Z warn VictoriaMetrics/app/vmselect/main.go:244 error in "/api/v1/query_range?query=stddev(node_load15%7Bcluster%3D%22YYY%22%2Cnode!%3D%22%22%7D%2Fon(node%2Ccluster)%20group_right%20machine_cpu_cores)%20by(type)&start=1597327050&end=1597330650&step=30": error when executing query="stddev(node_load15{cluster=\"YYY\",node!=\"\"}/on(node,cluster) group_right machine_cpu_cores) by(type)" on the time range (start=1597327050000, end=1597330650000, step=30000): cannot execute query: cannot evaluate "machine_cpu_cores": timeout exceeded while fetching data block #743 from storage: 30.000 seconds; the timeout can be adjusted with -search.maxQueryDuration command-line flag
floppy-engineer
on 18 Aug 2020
Related issues
 oOHenry
·
4Comments
oOHenry
·
4Comments
 localpref
·
3Comments
localpref
·
3Comments
 n4mine
·
3Comments
n4mine
·
3Comments
 prdatur
·
3Comments
valyala
·
4Comments
prdatur
·
3Comments
valyala
·
4Comments