Victoriametrics: When relabelling is enabled in vminsert it's causing inconsistency in all metrics
Describe the bug
When relabelling is enabled in vminsert using the -relabelConfig CLI flag the metrics started showing inconsistency when being ingested to vmstorage, one metric has two values, one of which was inconsistent as shown in the screenshot.
To Reproduce
Install vminsert and start the process by passing the -relabelConfig CLI flag and pointing to the relabel rules file
Expected behavior
When relabelling is enabled, metric names and their labels shouldn't have any inconsistency in them and the metrics should have the relabelling rules applied to them.
Screenshots
Version
$ vminsert-prod -version
vminsert-20200708-175209-tags-v1.38.0-cluster-0-g418f0e46c
Used command-line flags
flag{name="csvTrimTimestamp", value="1ms"} 1
flag{name="enableTCP6", value="false"} 1
flag{name="envflag.enable", value="false"} 1
flag{name="envflag.prefix", value=""} 1
flag{name="fs.disableMmap", value="false"} 1
flag{name="graphiteListenAddr", value=""} 1
flag{name="graphiteTrimTimestamp", value="1s"} 1
flag{name="http.disableResponseCompression", value="false"} 1
flag{name="http.maxGracefulShutdownDuration", value="7s"} 1
flag{name="http.pathPrefix", value=""} 1
flag{name="http.shutdownDelay", value="0s"} 1
flag{name="httpListenAddr", value="127.0.0.1:8480"} 1
flag{name="import.maxLineLen", value="104857600"} 1
flag{name="influxListenAddr", value=""} 1
flag{name="influxMeasurementFieldSeparator", value="_"} 1
flag{name="influxSkipSingleField", value="false"} 1
flag{name="influxTrimTimestamp", value="1ms"} 1
flag{name="insert.maxQueueDuration", value="2m0s"} 1
flag{name="loggerErrorsPerSecondLimit", value="10"} 1
flag{name="loggerFormat", value="json"} 1
flag{name="loggerLevel", value="INFO"} 1
flag{name="loggerOutput", value="stdout"} 1
flag{name="maxConcurrentInserts", value="8"} 1
flag{name="maxInsertRequestSize", value="33554432"} 1
flag{name="maxLabelsPerTimeseries", value="30"} 1
flag{name="memory.allowedPercent", value="60"} 1
flag{name="opentsdbHTTPListenAddr", value=""} 1
flag{name="opentsdbListenAddr", value=""} 1
flag{name="opentsdbTrimTimestamp", value="1s"} 1
flag{name="opentsdbhttp.maxInsertRequestSize", value="33554432"} 1
flag{name="opentsdbhttpTrimTimestamp", value="1ms"} 1
flag{name="relabelConfig", value=""} 1
flag{name="replicationFactor", value="2"} 1
flag{name="rpc.disableCompression", value="false"} 1
flag{name="storageNode", value="vmstorage-node-1.com:8400,vmstorage-node-2.com:8400"} 1
flag{name="version", value="false"} 1
 jsanant
All 13 comments
@jsanant, look here: https://github.com/VictoriaMetrics/VictoriaMetrics/issues/599 and then upgrade to 1.38.1.
 Allineer
on 17 Jul 2020
Allineer
on 17 Jul 2020
@Allineer - Thanks I'll take a look
jsanant
on 18 Jul 2020
@valyala - Can I please get an update on this? If you need more information please let me know.
jsanant
on 20 Jul 2020
@jsanant , could you provide the following additional information?
- Which line on the graph is incorrect?
- Could you provide a screenshot for the same query that covers a time range with both cases - when
-relabelConfigis enabled and when it is disabled? - Could you provide a screenshot for the
inner_queryfromsum(inner_query_here) by (path), i.e. fordisk_used_percent{host=~"...", path!~"/snap.*"}? The screenshot should cover the time range for both cases - when-relabelConfigis enabled and when it is disabled. The screenshot should cover time series labels at the bottom of the graph. If the query returns too many time series, then try filtering out them with additional filters in the query.
 valyala
on 20 Jul 2020
valyala
on 20 Jul 2020
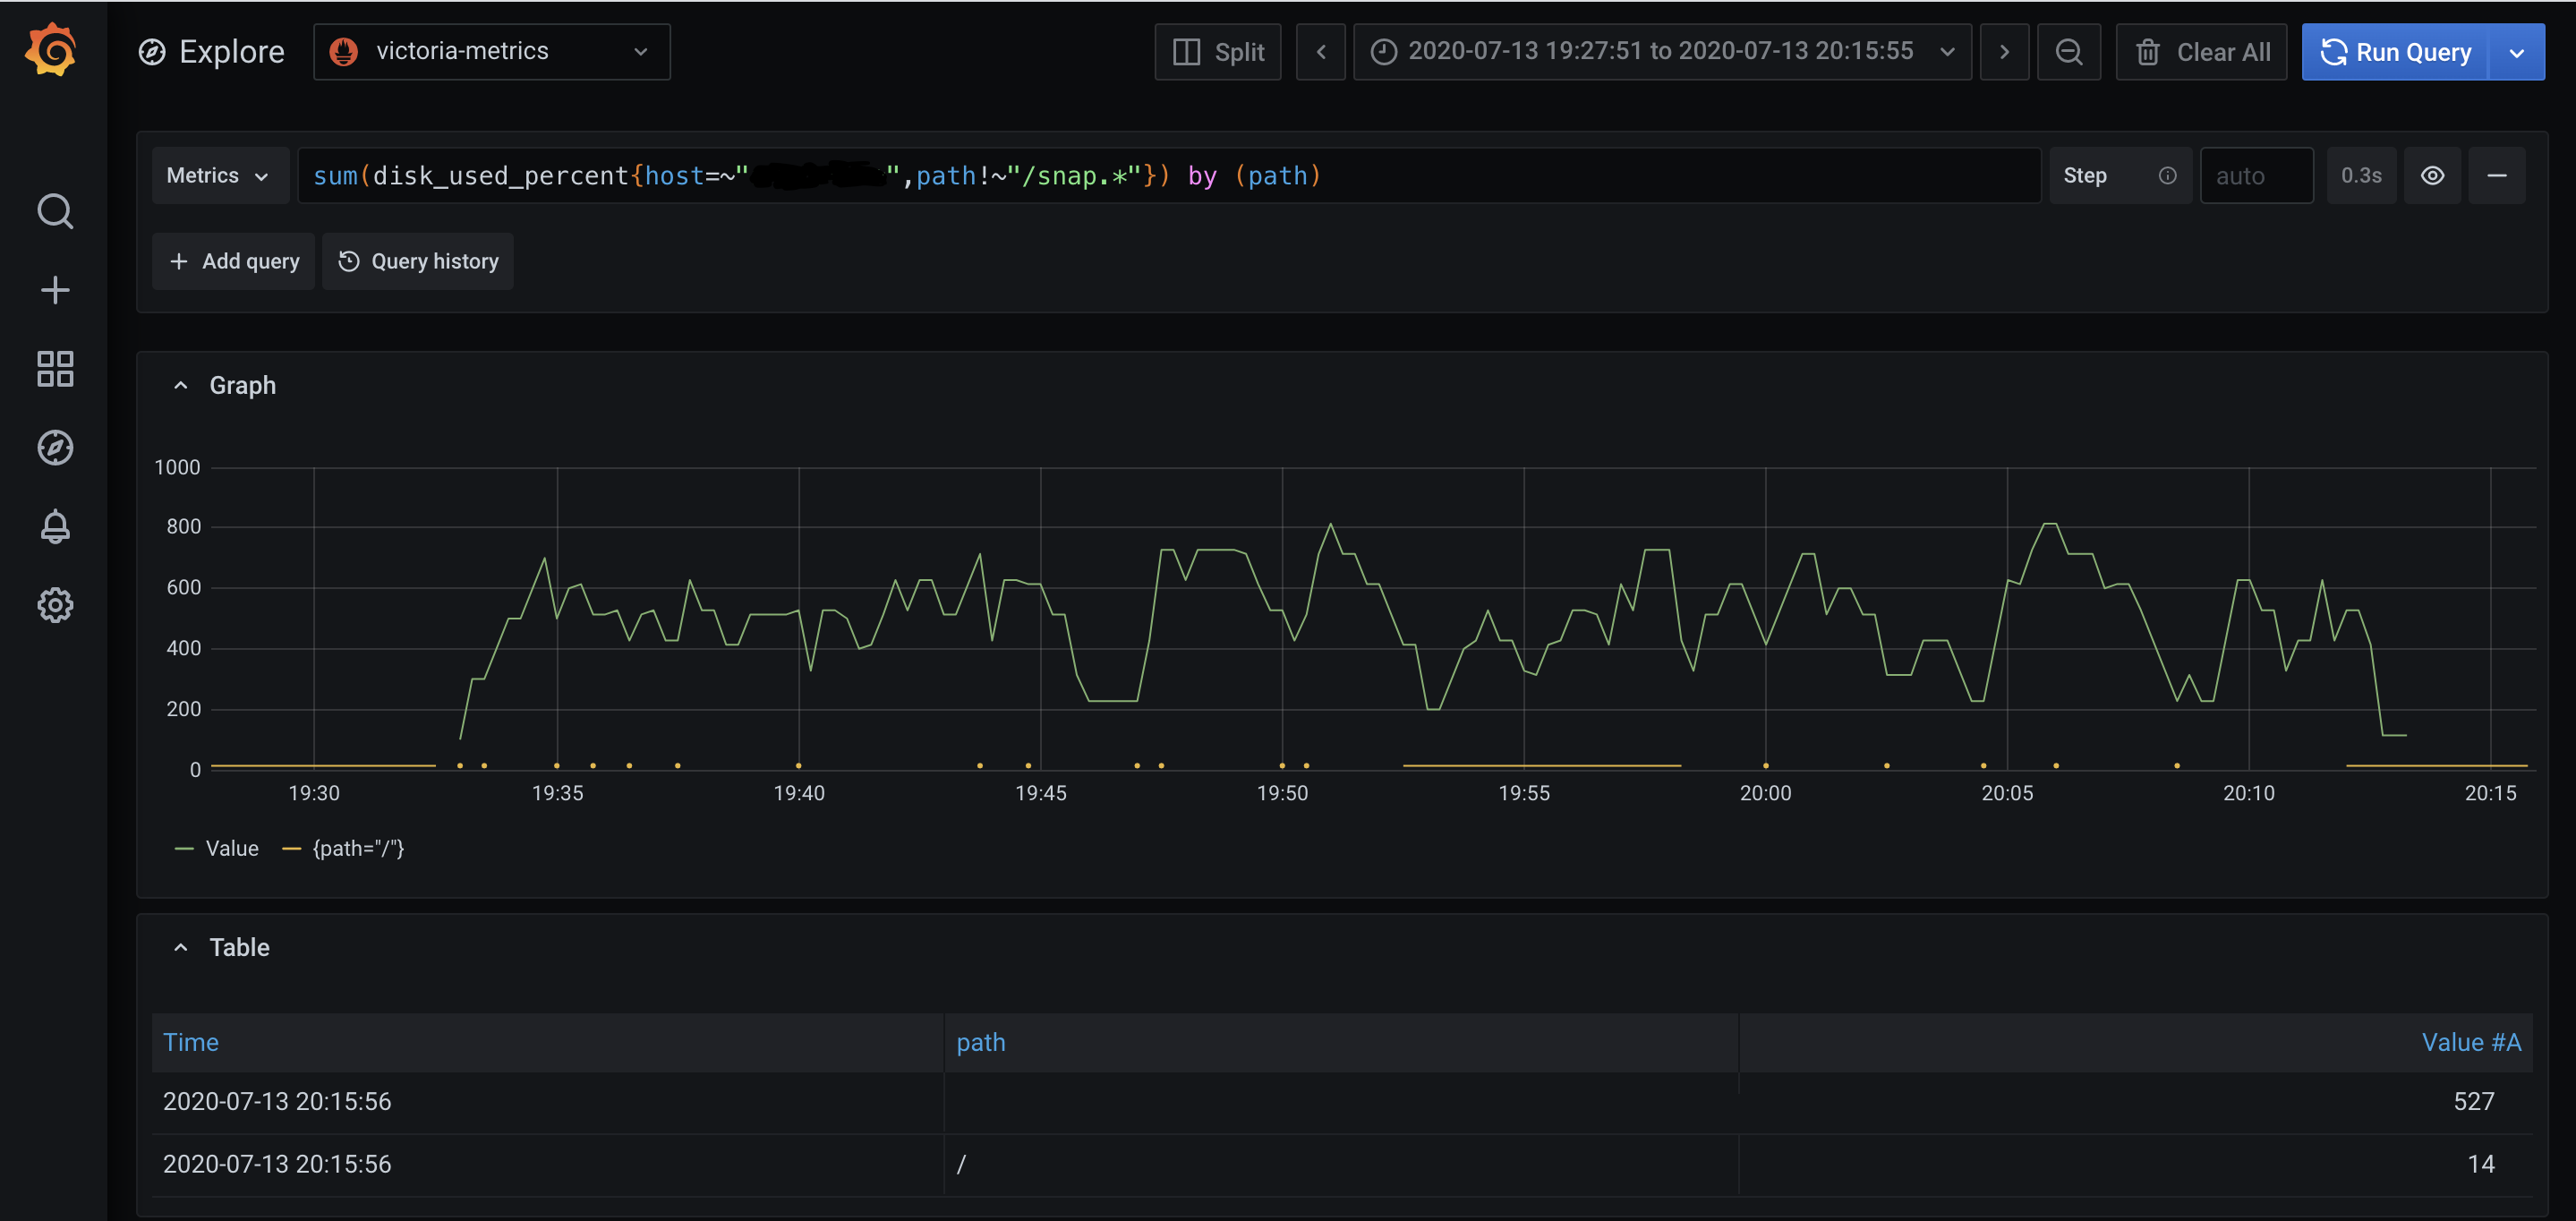
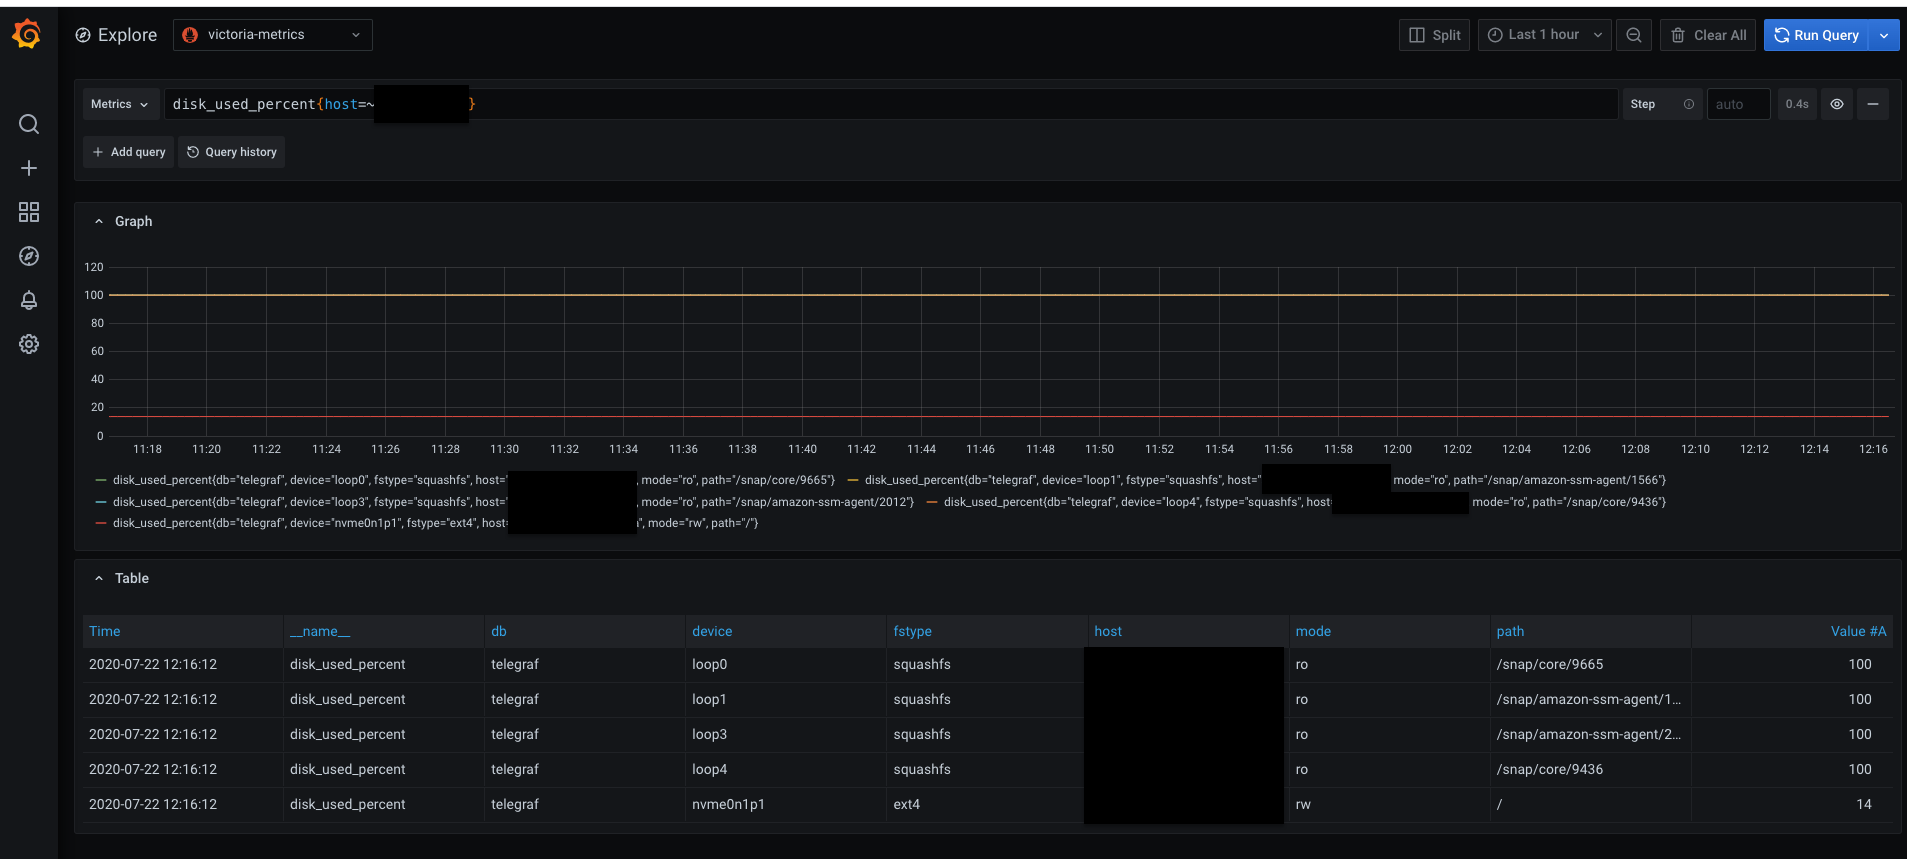
- The green line is the incorrect one
Screenshot of when -relabelConfig is enabled:

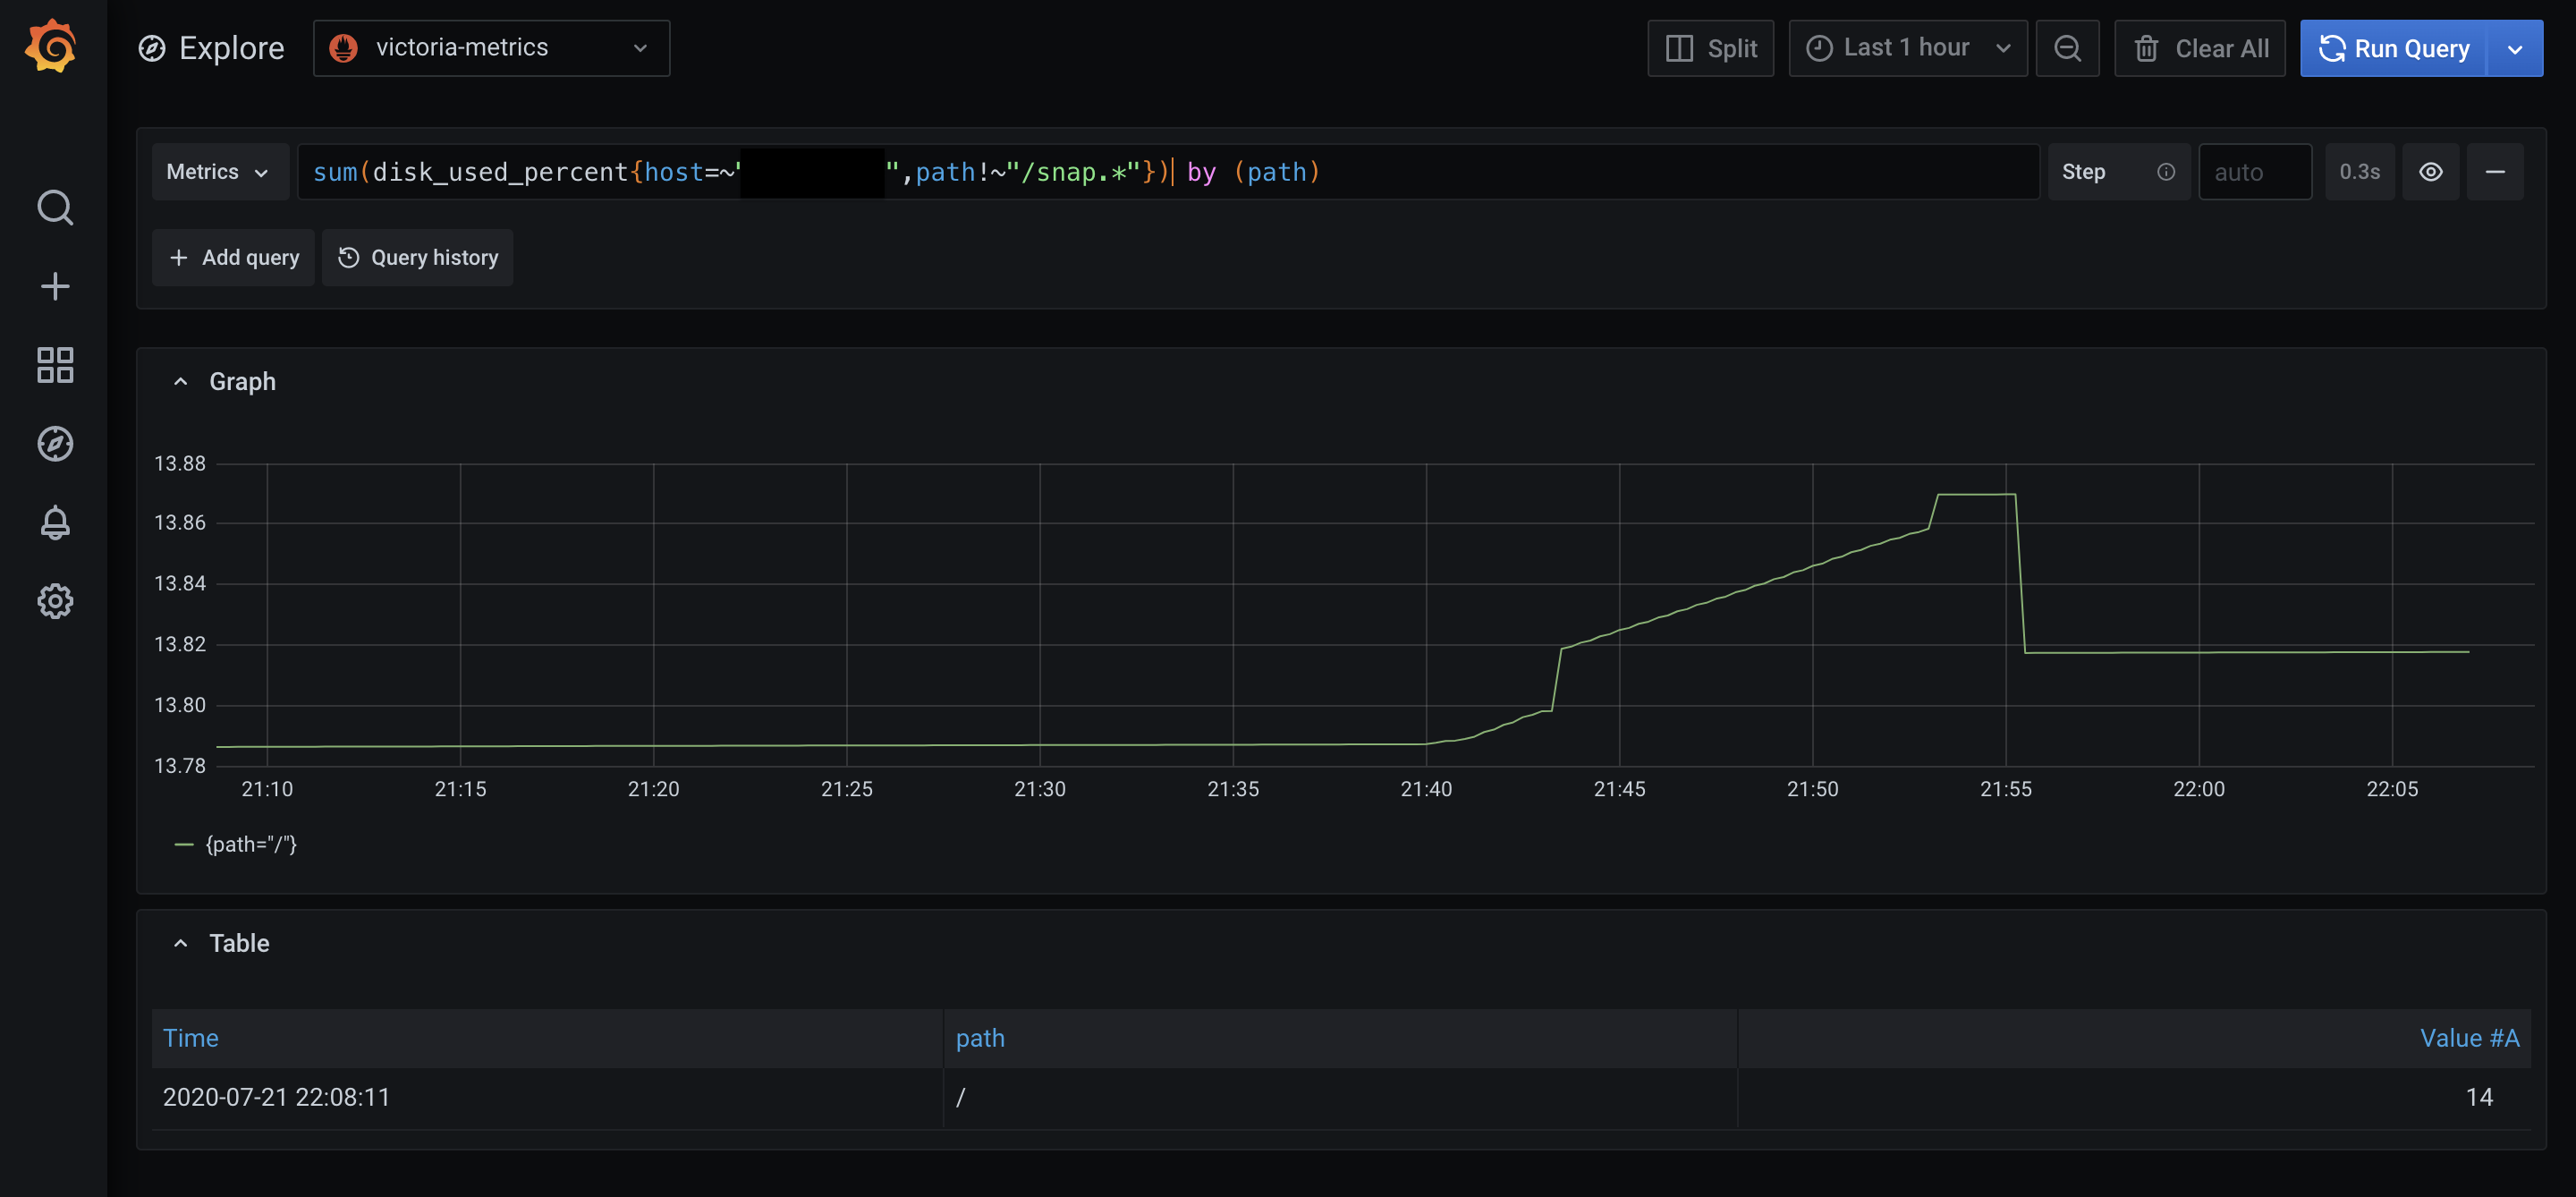
Screenshot of when -relabelConfig is not enabled:
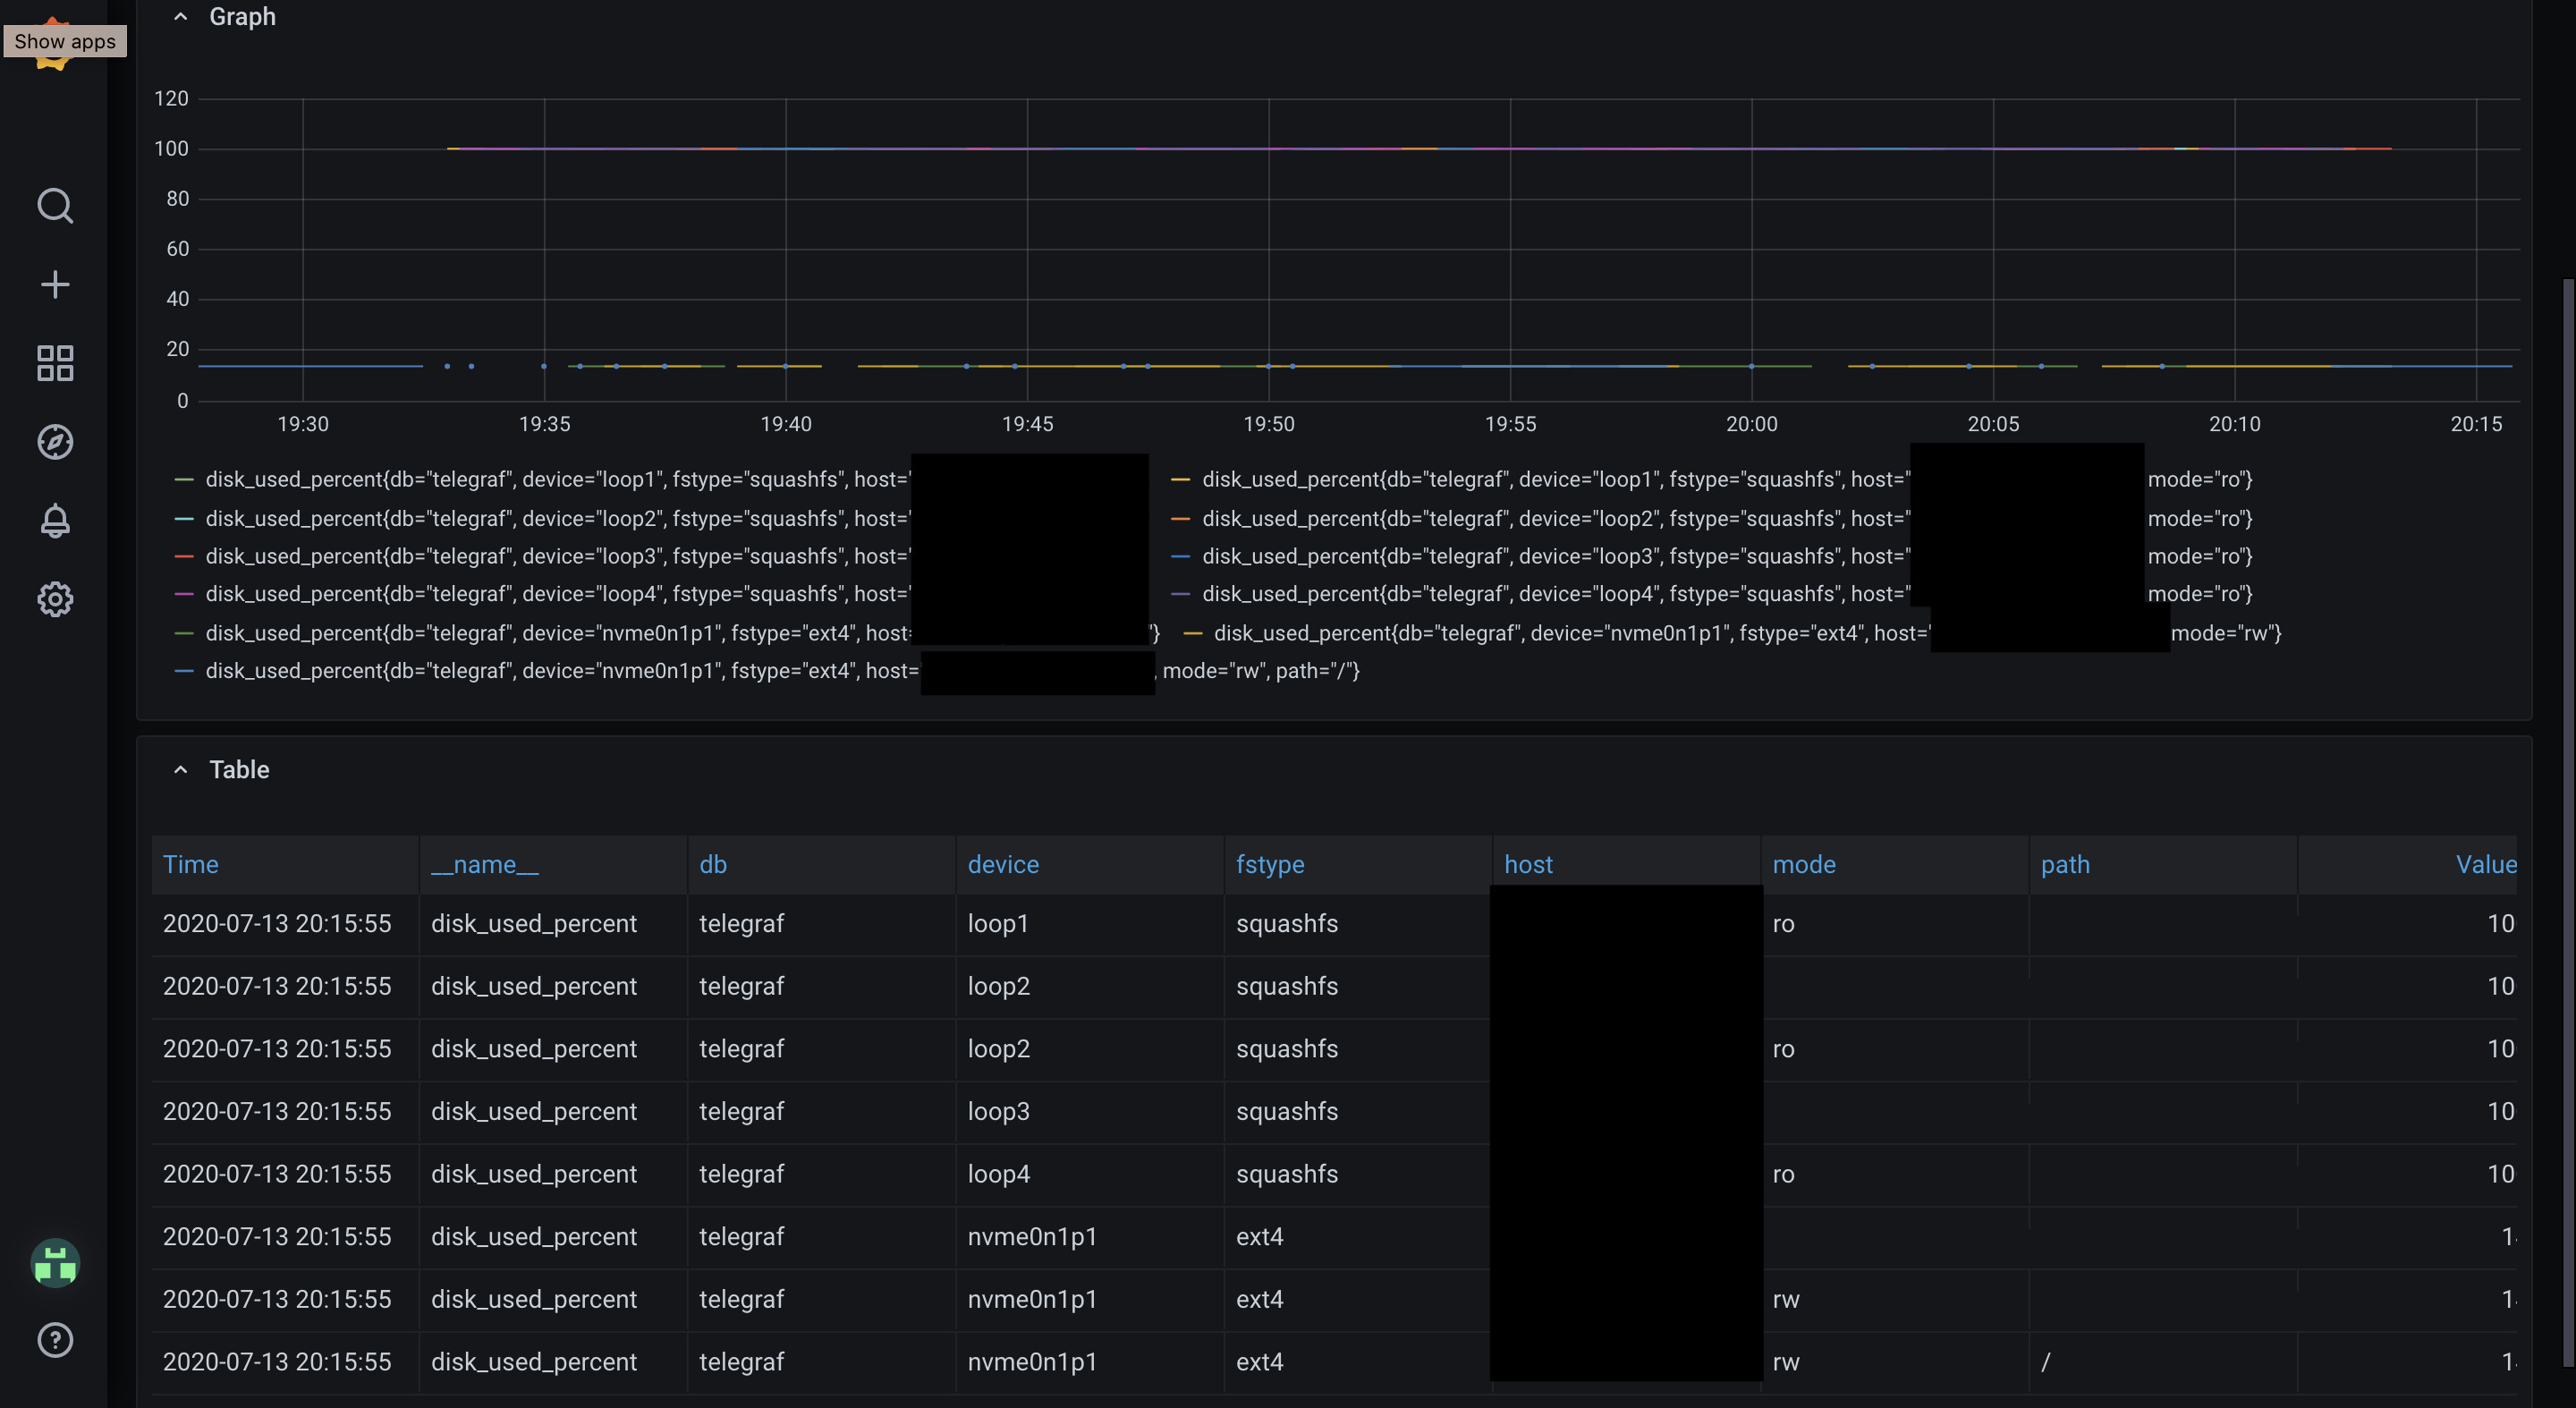
Screenshot for the inner query when -relabel is enabled:
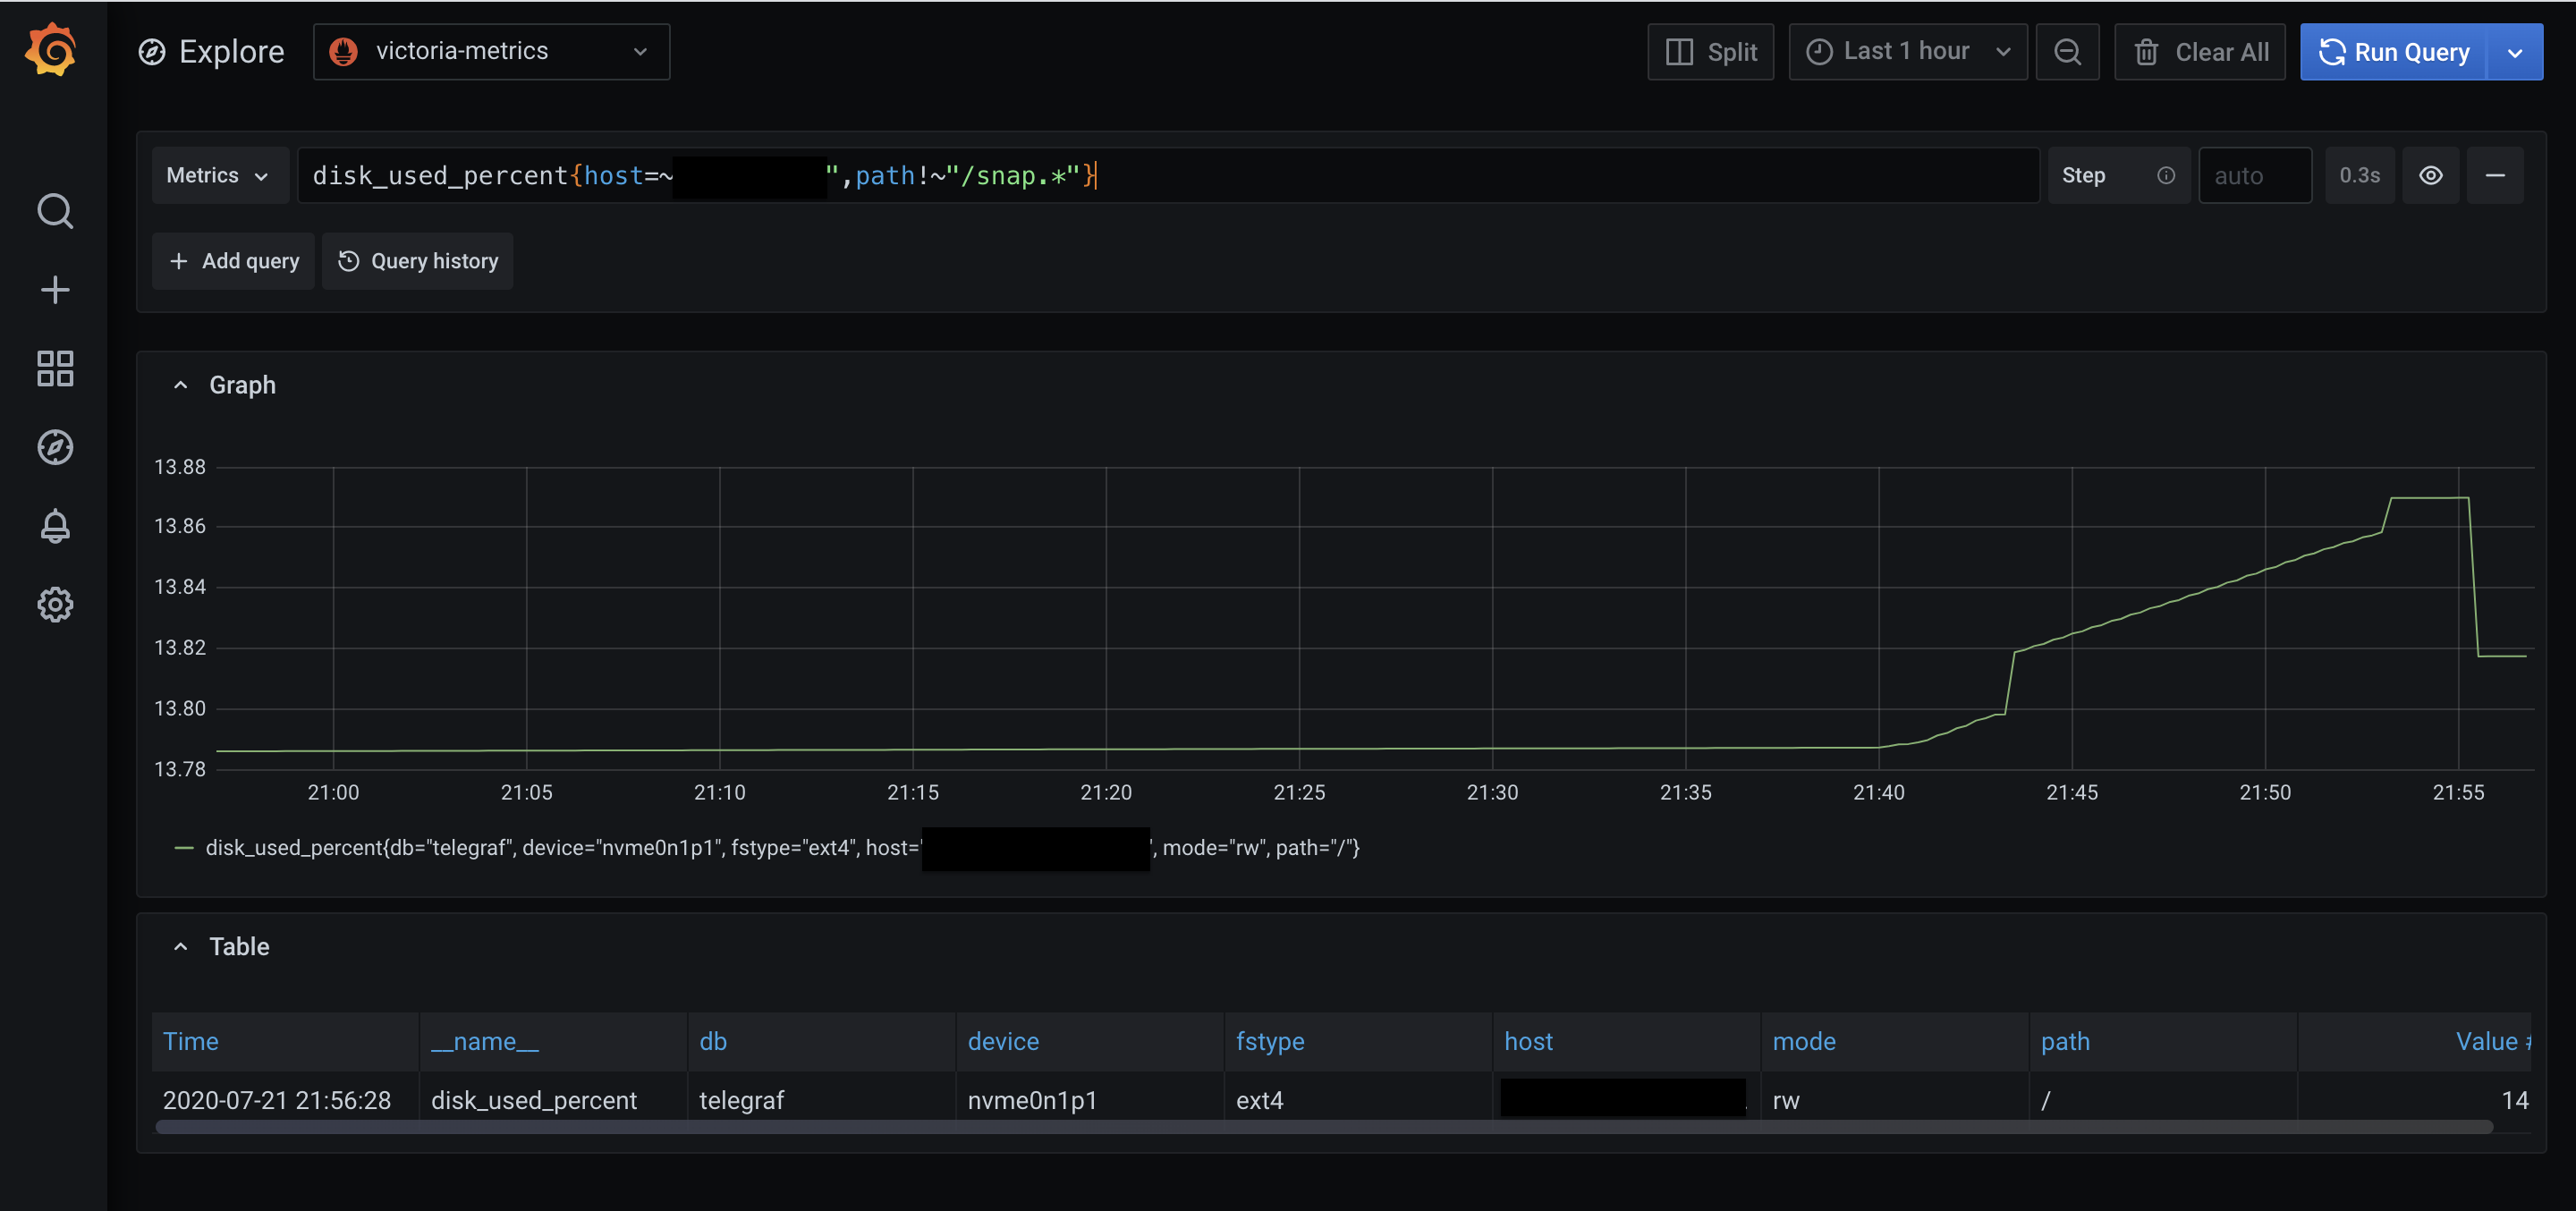
Screenshot for the inner query when -relabelConfig is not enabled:
Hope this helps!
jsanant
on 21 Jul 2020
@jsanant , thanks for the provided graphs! The last two graphs are quite interesting:
- The graph when
-relabelConfigis enabled contains 12 time series matching the given query, while the graph without-relabelConfigcontains only a single time series matching the given query. It is unclear why other metrics with such labels asdevice="loopN"orfstype="squashfs"aren't shown on the last graph. Probably, these metrics havepathlabel which starts with/snapprefix. Could you try removing thepath!~"/snap.*"filter from the query and verify this assumption? - All the labels for time series on the graph with
-relabelConfiglook correct. This rules out the case with a bug, which could lead to incorrect relabeling. - Only a single time series on the graph with
-relabelConfigcontainspathlabel, while others have no this label. There are also 5 time series withoutmodelabel. This looks suspicious. Probably, there is a bug in VictoriaMetrics, which sometimes trims a part of labels if-relabelConfigis set. I need to look into this direction.
valyala
on 21 Jul 2020
- Could you try removing the path!~"/snap.*"
@valyala , you are right, I didn't pass the
path!~"/snap.*"in screenshot 3
Screenshot of inner query without path!~"/snap.*" & -relableConfig not enabled:
- Only a single time series on the graph with -relabelConfig contains path label, while others have no this label. There are also 5 time series without mode label. This looks suspicious. Probably, there is a bug in VictoriaMetrics, which sometimes trims a part of labels if -relabelConfig is set. I need to look into this direction.
So
vminsertis performing the relablleing as expected but victoria metrics is storing it in a different format?
jsanant
on 22 Jul 2020
So vminsert is performing the relablleing as expected but victoria metrics is storing it in a different format?
No, it looks like vminsert has a bug with relabeling, which sometimes removes a part of labels on the metric such as path or mode. I'm still investigating this case.
The workaround is to perform relabeling on vmagent side.
valyala
on 22 Jul 2020
@jsanant , could you share the contents of -relabelConfig file?
valyala
on 22 Jul 2020
Here is the content for the -relabelConfig file:
- action: replace_all
  source_labels: [__name__]
  target_label: '__name__'
  regex: "-"
  replacement: "_"
- action: labelmap_all
  regex: "-"
  replacement: "_"
I am using the above one with vmagent, and it is working without any issues.
jsanant
on 22 Jul 2020
It looks like I figured out the origin of the bug and fixed it in the following commits:
- Cluster version - c91ccce50cc3f6d23e638b605c6047d4418e24d3
- Single-node version - 2f612e0c67d45e0ba539ed5ed0b63b2dbeea9797
@jsanant , try building vminsert from the commit c91ccce50cc3f6d23e638b605c6047d4418e24d3 according to these docs and verifying whether it fixes the issue.
valyala
on 23 Jul 2020
@valyala - Verified, its working without any issues! Thank you.
jsanant
on 23 Jul 2020
FYI, the bugfix has been included in v1.39.0. Closing the bug as fixed.
valyala
on 24 Jul 2020
Related issues
 faceair
·
3Comments
faceair
·
3Comments
 dima-vm
·
3Comments
valyala
·
4Comments
dima-vm
·
3Comments
valyala
·
4Comments
 jelmd
·
3Comments
jelmd
·
3Comments
 WilliamDahlen
·
3Comments
WilliamDahlen
·
3Comments
Most helpful comment
FYI, the bugfix has been included in v1.39.0. Closing the bug as fixed.