Victoriametrics: Data Loss: The graph discontinuity problem
Describe the Problem
I write a simple multiple threads java client to send the influx protocol line data to the VM via TCP/UDP method (i.e., influxListenAddr).
At every beginning, when I run the data insert program, the VM log shows
cannot handle more than 4 concurrent inserts during 1m0s; possible solutions: increase `-insert.maxQueueDuration`, increase `-maxConcurrentInserts`, increase server capacity
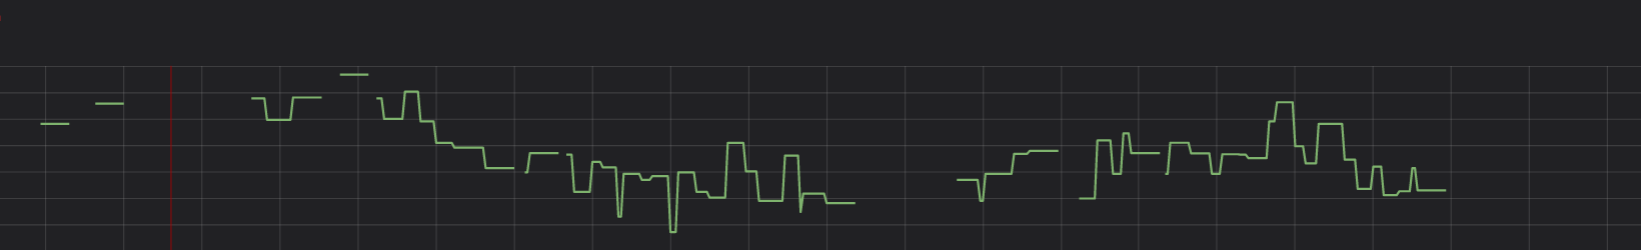
Also, the data graph turns discontinuity on the grafana explorer page. Then, I follow the suggestion of log prompt by change maxConcurrentInserts and maxQueueDuration. Fortunately, the above error didn't show again but the graph still discontinuity (however, the empty data interval seems to be shortened)
Screenshots
Version
$ ./victoria-metrics-prod --version
victoria-metrics-20200710-132635-tags-v1.38.0-0-gb66c7c13-dirty-c992dfdf
Signal-node version
Used command-line flags
-retentionPeriod=12
-influxTrimTimestamp=1s
-influxListenAddr=:10000
-maxConcurrentInserts=256
-search.latencyOffset=0s
-search.maxStalenessInterval=31536000s
-search.maxPointsPerTimeseries=300000000
-search.maxQueueDuration=10m
-serach.maxQueryLen=2560000
Additional context
Computer information: 2 core, 48G memory
Data example: test,exampleName=test0,status=3 value=6.161349147403749 1585713275000000000
- all the data are located at the time range [2019-09-01 to 2020-05-01]
- The interval of each data is 1s
- I crafted 7000 point data (from
exampleName=test0toexampleName=test6999) in one metric (test) - I used nearly 100 threads in Java to continually insert the historical data of these 7000 points.
- each data (one line) will be flush to TCP client of VM immediately instead of assembling them to batch data (multiply-line).
Suggestions?
I want to ask:
- at usual, which might cause the unsuccessful data insert (backfill) at some time point?
- Except for my own java client, is there exist any unreasonable settings for my command-line flags that might cause data loss?
- Although the
cannot handle ...error didn't show again, I still think it significantly influences the data insert. What is the execution mechanism of the concurrentInsert in VM? Due to the performance bottleneck of my machine, is it possible that sometimes, the insertion of some point was shelved in the concurrent queue and therefore lost data for some time?
If you folks cannot find any significant error on my command-line flags and the method I used for data insertion, I would turn my concentration to my own java client.
Thanks in advance for any suggestions.
 SimonHu-HN
All 10 comments
at usual, which might cause the unsuccessful data insert (backfill) at some time point?
There are the following cases for unsuccessful insert:
- if the timestamp of the datapoint is outside the configured retention (see
-retentionPeriodcommand-lime flag for details). VictoriaMetrics logs an error message in this case. - If the ingested datapoint has invalid format. VictoriaMetrics also logs this case.
There is a case when successfully ingested historical data may be missing in query responses due to response caching properties. In this case it is recommended to disable response cache via -seacrh.disableCache command-line flag during backfilling. See these docs for more details. It is likely this is your case.
Except for my own java client, is there exist any unreasonable settings for my command-line flags that might cause data loss
I'm unaware of settings that may lead to data loss. There are settings, that may lead to increased resource usage (cpu, ram, disk io, network bandwidth) or out of memory (OOM) crashes if improperly configured. Default settings should work OK in most cases, so it isn't recommended changing default values for various settings unless this is really needed. See these docs for details.
In your case the following settings look slightly incorrect:
-search.maxPointsPerTimeseries=300000000. This setting limits horizontal resolution for responses from /api/v1/query_range. This handler is mainly used by Grafana for obtaining datapoints for building graphs. The horizontal resolution (i.e. the number of datapoints per time series in the response) is limited by the horizontal resolution of monitor, since there is no much sense in requesting more than a single point per pixel on the monitor. So the default value for-search.maxPointsPerTimeseriesshould work for most cases. Too big value for this setting may lead to increased memory usage.
-search.maxQueueDuration=10mlooks too big. This setting means that incoming queries may wait for up to 10 minutes in the queue before being executed. There are high chances that the query result will become irrelevant after 10 minutes. This also may increase CPU load by spending CPU time on stale queries.-serach.maxQueryLen=2560000limits the text length of a single MetricsQL query. There are high chances that something is wrong in your setup if you need queries with 2.5MB length.
What is the execution mechanism of the concurrentInsert in VM?
-maxConcurrentInserts limits the number of insert requests, which may be actively processed at any given point in time. All the other insert requests are queued for up to -insert.maxQueueDuration in the hope they will get a chance to be processed. This queue is used mostly for absorbing spikes for incoming insert request rate. In your case you have 100 concurrent inserters, so -maxConcurrentInserts=100 should be enough. Default value for this option is much smaller, because it is tuned for processing short-living insert requests over http. It isn't tuned for processing long-living raw tcp connections with streamed data ingestion. It is likely this case will be tuned in the future, so default value for -maxConcurrentInserts will work for all the cases.
Due to the performance bottleneck of my machine, is it possible that sometimes, the insertion of some point was shelved in the concurrent queue and therefore lost data for some time?
Single-node VictoriaMetrics doesn't silently drop incoming datapoints in most cases (the only exception is data ingestion over UDP - in this case the operating system may drop udp packets under high load). If it has no enough resources for processing the incoming data, it limits the processing speed. This is pushed back to clients, so they have to reduce the ingestion speed. If they continue creating new connections and requests instead of reducing the ingestion speed, then VictoriaMetrics will start returning errors in the responses to these clients with cannot handle more than ... concurrent inserts messages. It is expected that clients must reduce the ingestion rate in this case and retry sending the data again.
It is recommended setting up monitoring of VictoriaMetrics according to these docs in order to understand better its behaviour under load.
 valyala
on 14 Jul 2020
valyala
on 14 Jul 2020
@valyala Thanks a lot, your answer is the best and most complete I ever met in the GitHub by the official person.
SimonHu-HN
on 16 Jul 2020
@valyala Sorry to bother you again, I encounter a new problem. As I mentioned before, I use TCP to backfill my data, however, recently, the VM always shutdown abnormally due to the error: too many open files, I use lsof command to investigate the file descriptors situation of VM, I found when I insert one year of data for one exampleName (test0 to test6999), the total number of file descriptors that be used by VM will increase about 24 (include FD: REG or MEM), I guess this situation is related to the merge process of VM?
Moreover, I have 7000 different exampleName, and If the VM didn't close or release some file descriptors in time, my server will have more than one hundred thousand file descriptors being used. I want to know that will the VM releases or close these file descriptors? If it will, What's the frequency?
# command lsof -p -a
  FD      TYPE
 mem       REG  ...data/small/2020_xx..
 mem       REG  ...data/small/2020_xx..
 mem       REG  ...data/small/2019_xx..
 mem       REG  ...data/small/2019_xx..
 mem       REG  ...data/small/2019_xx..
 mem       REG  ...data/small/2020_xx..
 mem       REG  ...data/small/2020_xx..

......................

  11r      REG   ...data/small/2020_xx..
 12r      REG    ...data/small/2020_xx..
 13r      REG    ...data/small/2020_xx..
 14r      REG    ...data/small/2020_xx..
 15r      REG    ...data/small/2020_xx..
 16r      REG    ...data/small/2020_xx..
 17r      REG    ...data/small/2020_xx..
 19u     IPv4    ...data/small/2020_xx..
 20u     IPv4    ...data/small/2020_xx..
 21u     IPv4    ...data/small/2020_xx..
 22r      REG    ...data/small/2020_xx..
 23r      REG    ...data/small/2020_xx..
......................
VictoriaMetrics keeps open all the data files. It stores data in LSM-like data structure. This data structure consists of a set of sorted files, which are periodically merged into bigger files in background. Newly ingested data is flushed into small files, which are eventually merged into bigger files. The background merging process allows keeping the number of files under control. See this article for more details.
The number of files may grow in two cases:
- If there is no enough free space on the disk for background merge process. It is recommended to have at least 20% of free space on the disk with data pointed by
-storageDataPathcommand-line flag. See troubleshooting docs for more details. - If the data is spread across big number of distinct months. For example, if
-retentionPeriod=100(100 months) and the ingested data has timestamps for all these 100 months, then the number of files may be 100x bigger than the number of files for a single month, since data for each month is stored in separate directories withYYYY_MMnames (for example,2020_07). Each month usually contains 20-40 files under normal conditions. So 100 months may contain 2K-4K files.
It is recommended setting up monitoring for VictoriaMetrics and investigating the official dashboard for Grafana. See these docs for details.
valyala
on 24 Jul 2020
@valyala According to your answer: my scenario now is one point (testxxx) has 12 months data from now to the last year. Each point keeps open the data files from 2019_07_xxx to 2020_07_xxx after the ingestion, and, I have 7000 points (test0 to test6999), then, 20-40 files for one month, 240-480 for one year, 1680000-3360000 for the whole 7000 points. Due to LSM-like data structure, these files will keep open by the VictoriaMetrics before the periodical merge. Am I right? if I am, I think I know why the VM shutdown abnormally...
SimonHu-HN
on 24 Jul 2020
I have 7000 points (test0 to test6999), then, 20-40 files for one month, 240-480 for one year, 1680000-3360000 for the whole 7000 points
All the data for all the points are stored in the same storage. So the total number of files for the data with timestamps over one year shouldn't exceed 1000 (usually the number must be smaller).
Due to LSM-like data structure, these files will keep open by the VictoriaMetrics before the periodical merge. Am I right?
VictoriaMetrics always keeps open all the data files.
Now the VictoriaMetrics in my server keeping ingest the historical data, but automatically turns off when the pidof victoriametrics | lsof -p -a | wc -l reach 1243. Is there exists any solution to alleviate it?
The number of open files may increase to more than 1000 (but less than a few thousands) during high-speed data ingestion, since background merge process could lag behind newly created data files. The number of open files should drop below 1000 after the data ingestion is complete or the ingestion speed lowers.
Try increasing the maximum number of open files in your system via ulimit -n - see https://victoriametrics.github.io/#tuning for details. Default value - usually 1024 - may be too small for VictoriaMetrics. Try increasing it to 10000 - this should be enough for your case. And keep an eye on free disk space - if it isn't enough for background merging, then the number of open files may grow to big values.
valyala
on 24 Jul 2020
@valyala NICE documentation and NICE answer. The VM works well now, waiting for your further contribution to the VM that makes it better and provides more cool features.
SimonHu-HN
on 26 Jul 2020
@SimonHu-HN , it has been appeared that v1.39.0 and v1.39.1 releases have incorrect prioritizing between merging of small parts and big parts. This could result in increased number of parts and increased CPU usage during queries. This has been fixed in v1.39.2.
valyala
on 30 Jul 2020
FYI, additional optimizations related to this issue were included in v1.39.4.
valyala
on 9 Aug 2020
@valyala Thanks, I will try the new version that strengthens by these optimizations.
SimonHu-HN
on 11 Aug 2020
Related issues
 genericgithubuser
·
4Comments
genericgithubuser
·
4Comments
 0xBF
·
3Comments
0xBF
·
3Comments
 faceair
·
3Comments
faceair
·
3Comments
 Serrvosky
·
3Comments
Serrvosky
·
3Comments
 localpref
·
3Comments
localpref
·
3Comments