Victoriametrics: The same query produces different results from prometheus and victoria-metrics datasource
Describe the bug
The same query produces different results from prometheus and victoria-metrics datasource.
Data in the both datasources are equal. I'm using remote write APIs for populating data in Victoria Metrics.
For prometheus datasource result is always equal to 1.
For victoria-metrics datasource result is periodically changes.
To Reproduce
Run the query for both datastores with the same data.
Expected behavior
The query should return exactly the same result as from prometheus datasource.
Screenshots

Version
The line returned when passing --version command line flag to binary. For example:
[root@elastic-log ~]# victoria-metrics -version
victoria-metrics-20200701-124459-tags-v1.37.4-0-g8da3f773a
Used command-line flags
-storageDataPath /mnt/storage/victoria-data -retentionPeriod 24
Additional context
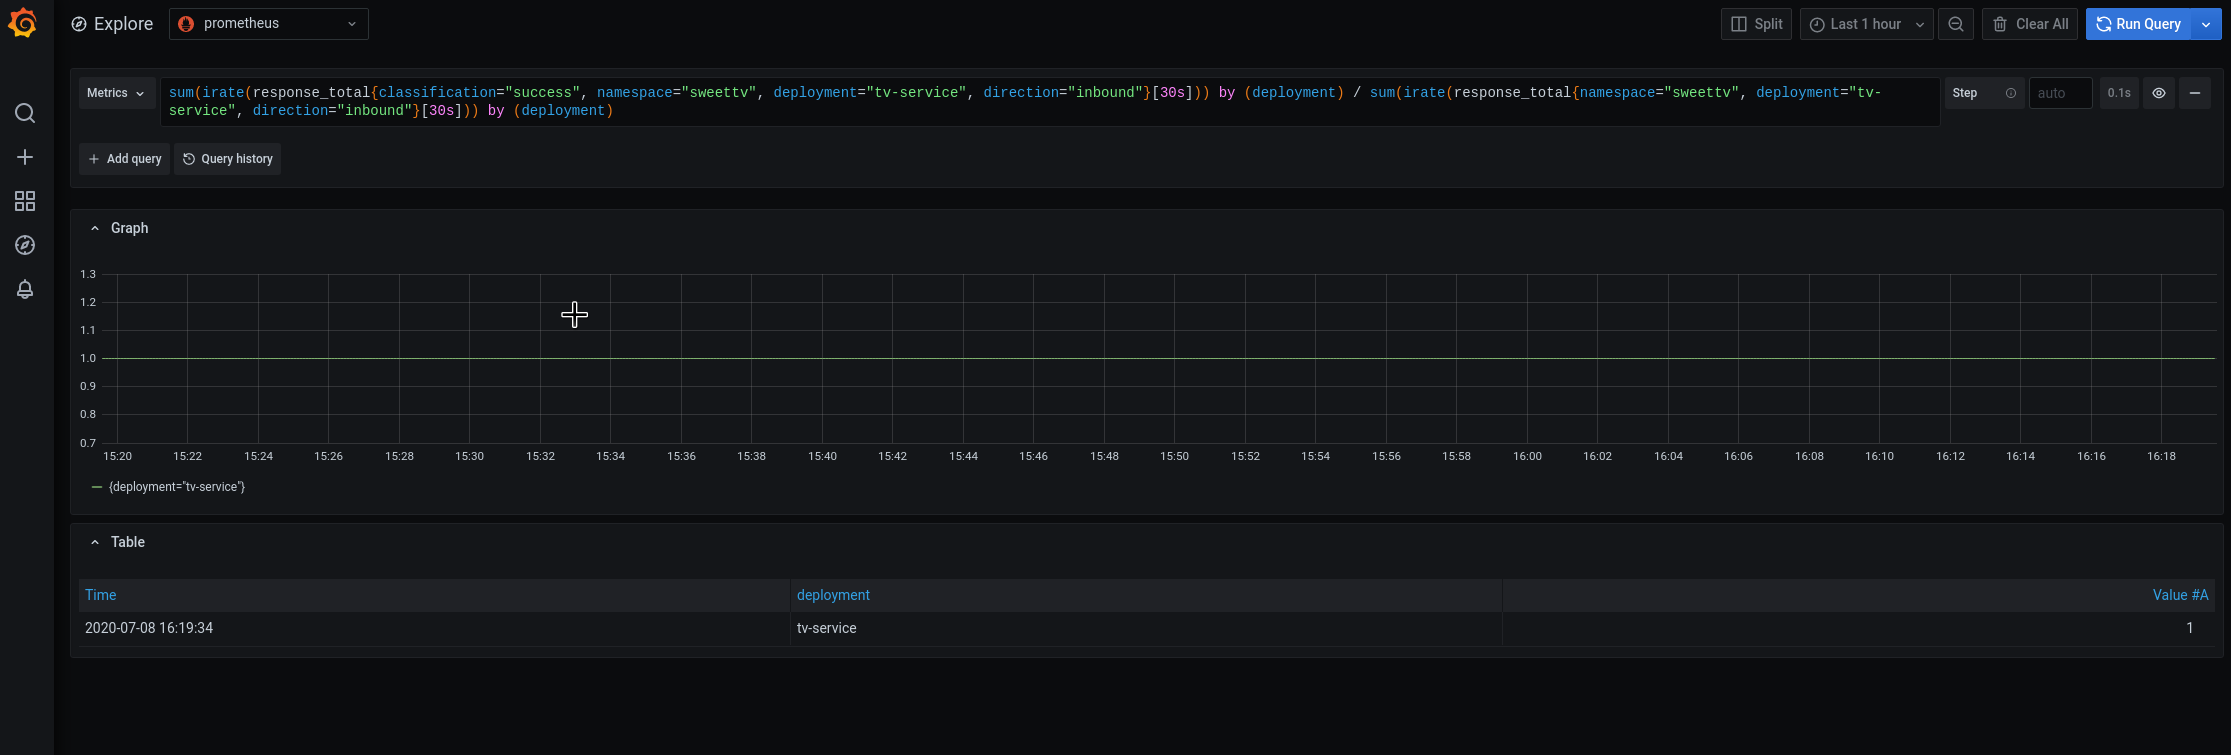
This query is taken from linkerd2 grafana dashboards.
 strobil
All 5 comments
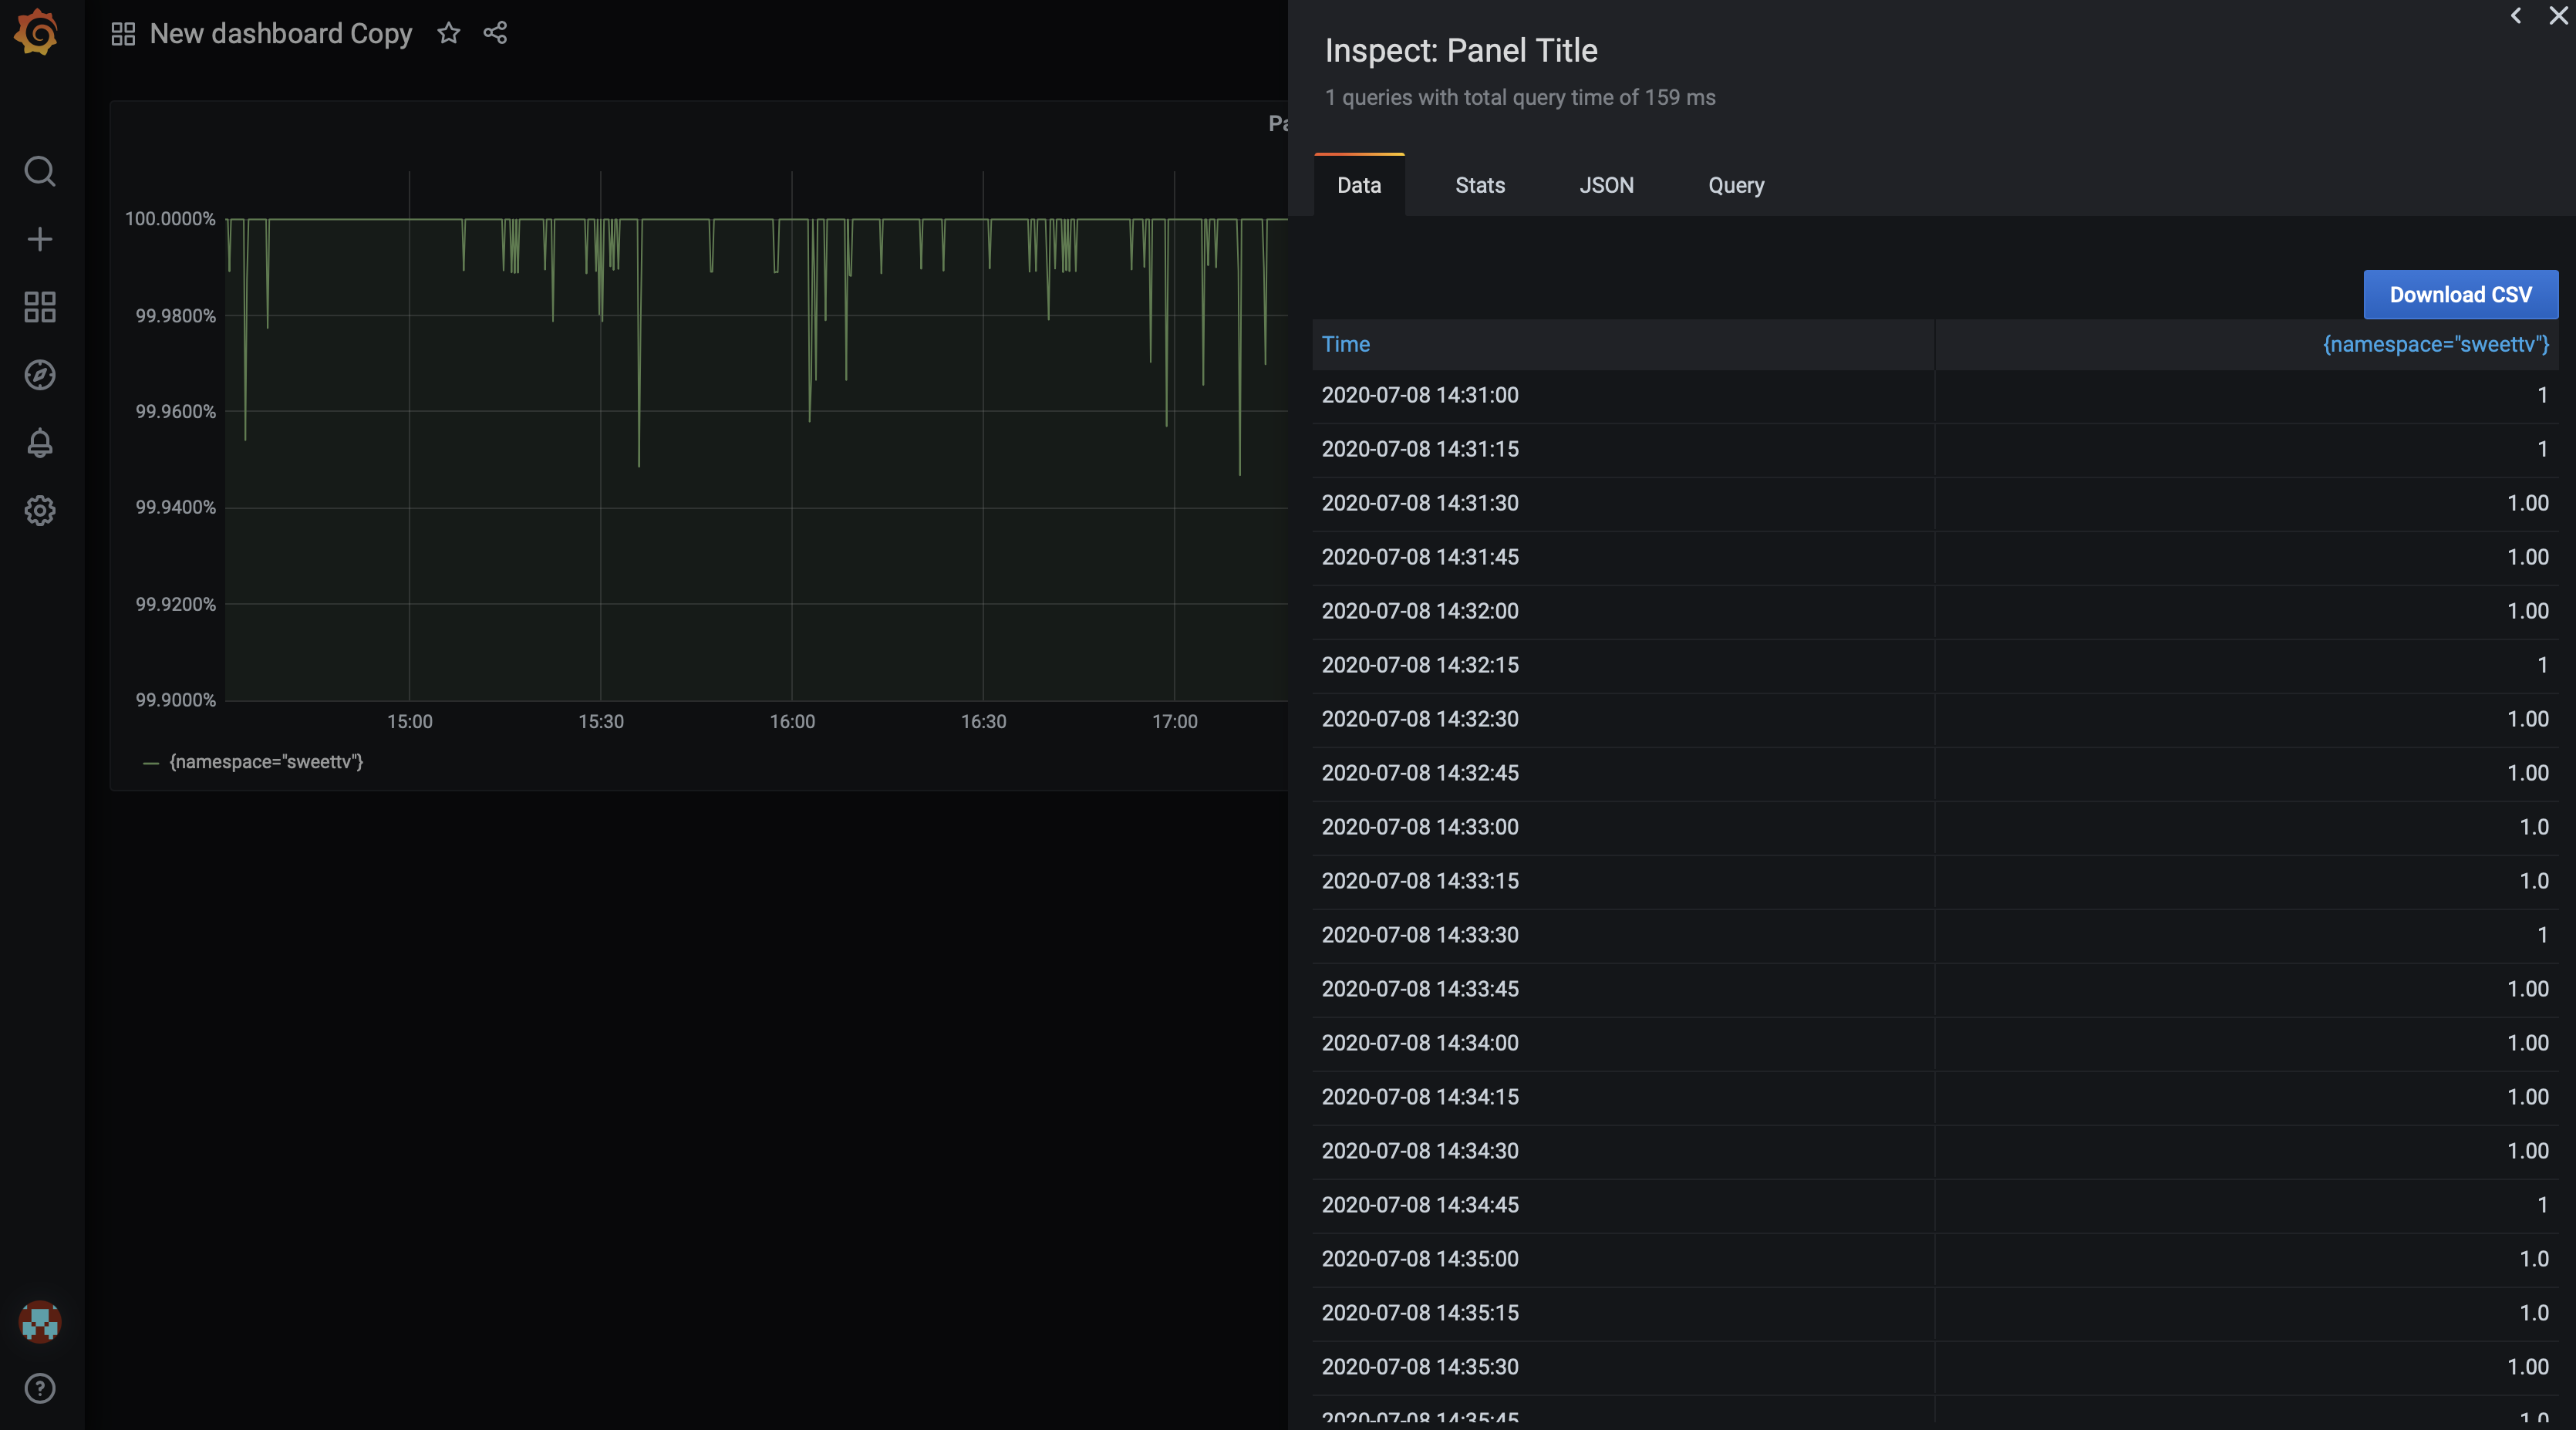
Note that the graph with Prometheus data has 0.7 ... 1.3 value range, while the graph with VictoriaMetrics data has 0.999(many nines here)9 ... 1.000(many zeroes here)1 value range. That's why the line for VictoriaMetrics looks jumpy - the jumps are in the range of 0.000(many zeroes here)1, which looks like floating-point rounding error. It should look identical to the line from Prometheus on the 0.7 ... 1.3 value range. Make sure both graphs have identical settings in Grafana.
 valyala
on 8 Jul 2020
valyala
on 8 Jul 2020
Note that the graph with Prometheus data has
0.7 ... 1.3value range, while the graph with VictoriaMetrics data has0.999(many nines here)9 ... 1.000(many zeroes here)1value range. That's why the line for VictoriaMetrics looks jumpy - the jumps are in the range of0.000(many zeroes here)1, which looks like floating-point rounding error. It should look identical to the line from Prometheus on the0.7 ... 1.3value range. Make sure both graphs have identical settings in Grafana.
On the first graph - data from VictoriaMetrics, on the second - from Prometheus.
Screenshots

strobil
on 8 Jul 2020
On the graphs where Y Min and Y Max is not set it looks like this:
Screenshots
Prometheus

VictoriaMetrics

And the most interesting thing.
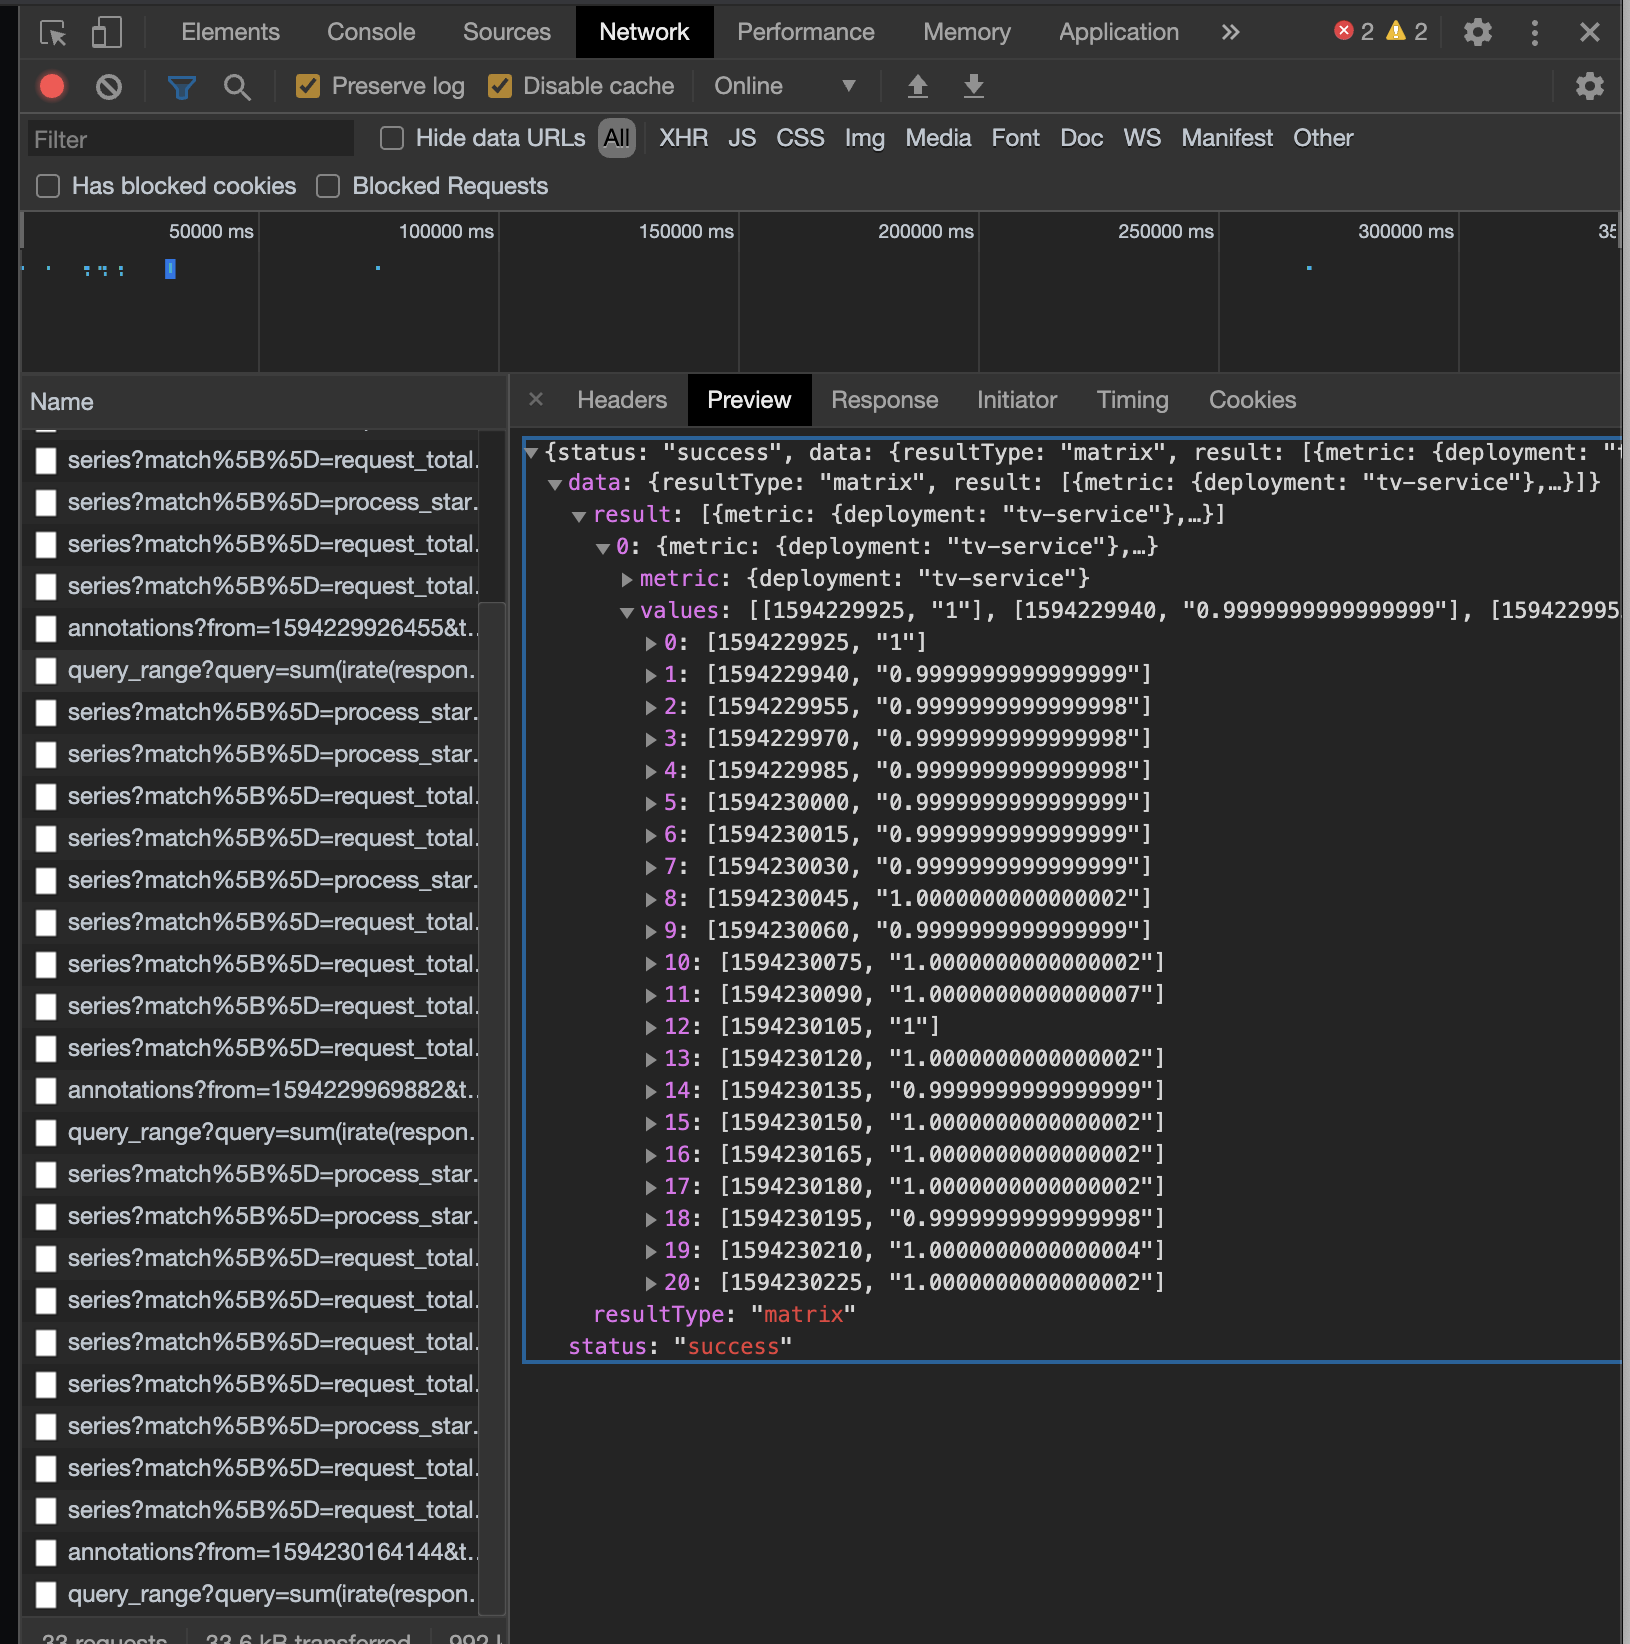
Query in Google chrome developer tools
VictoriaMetrics
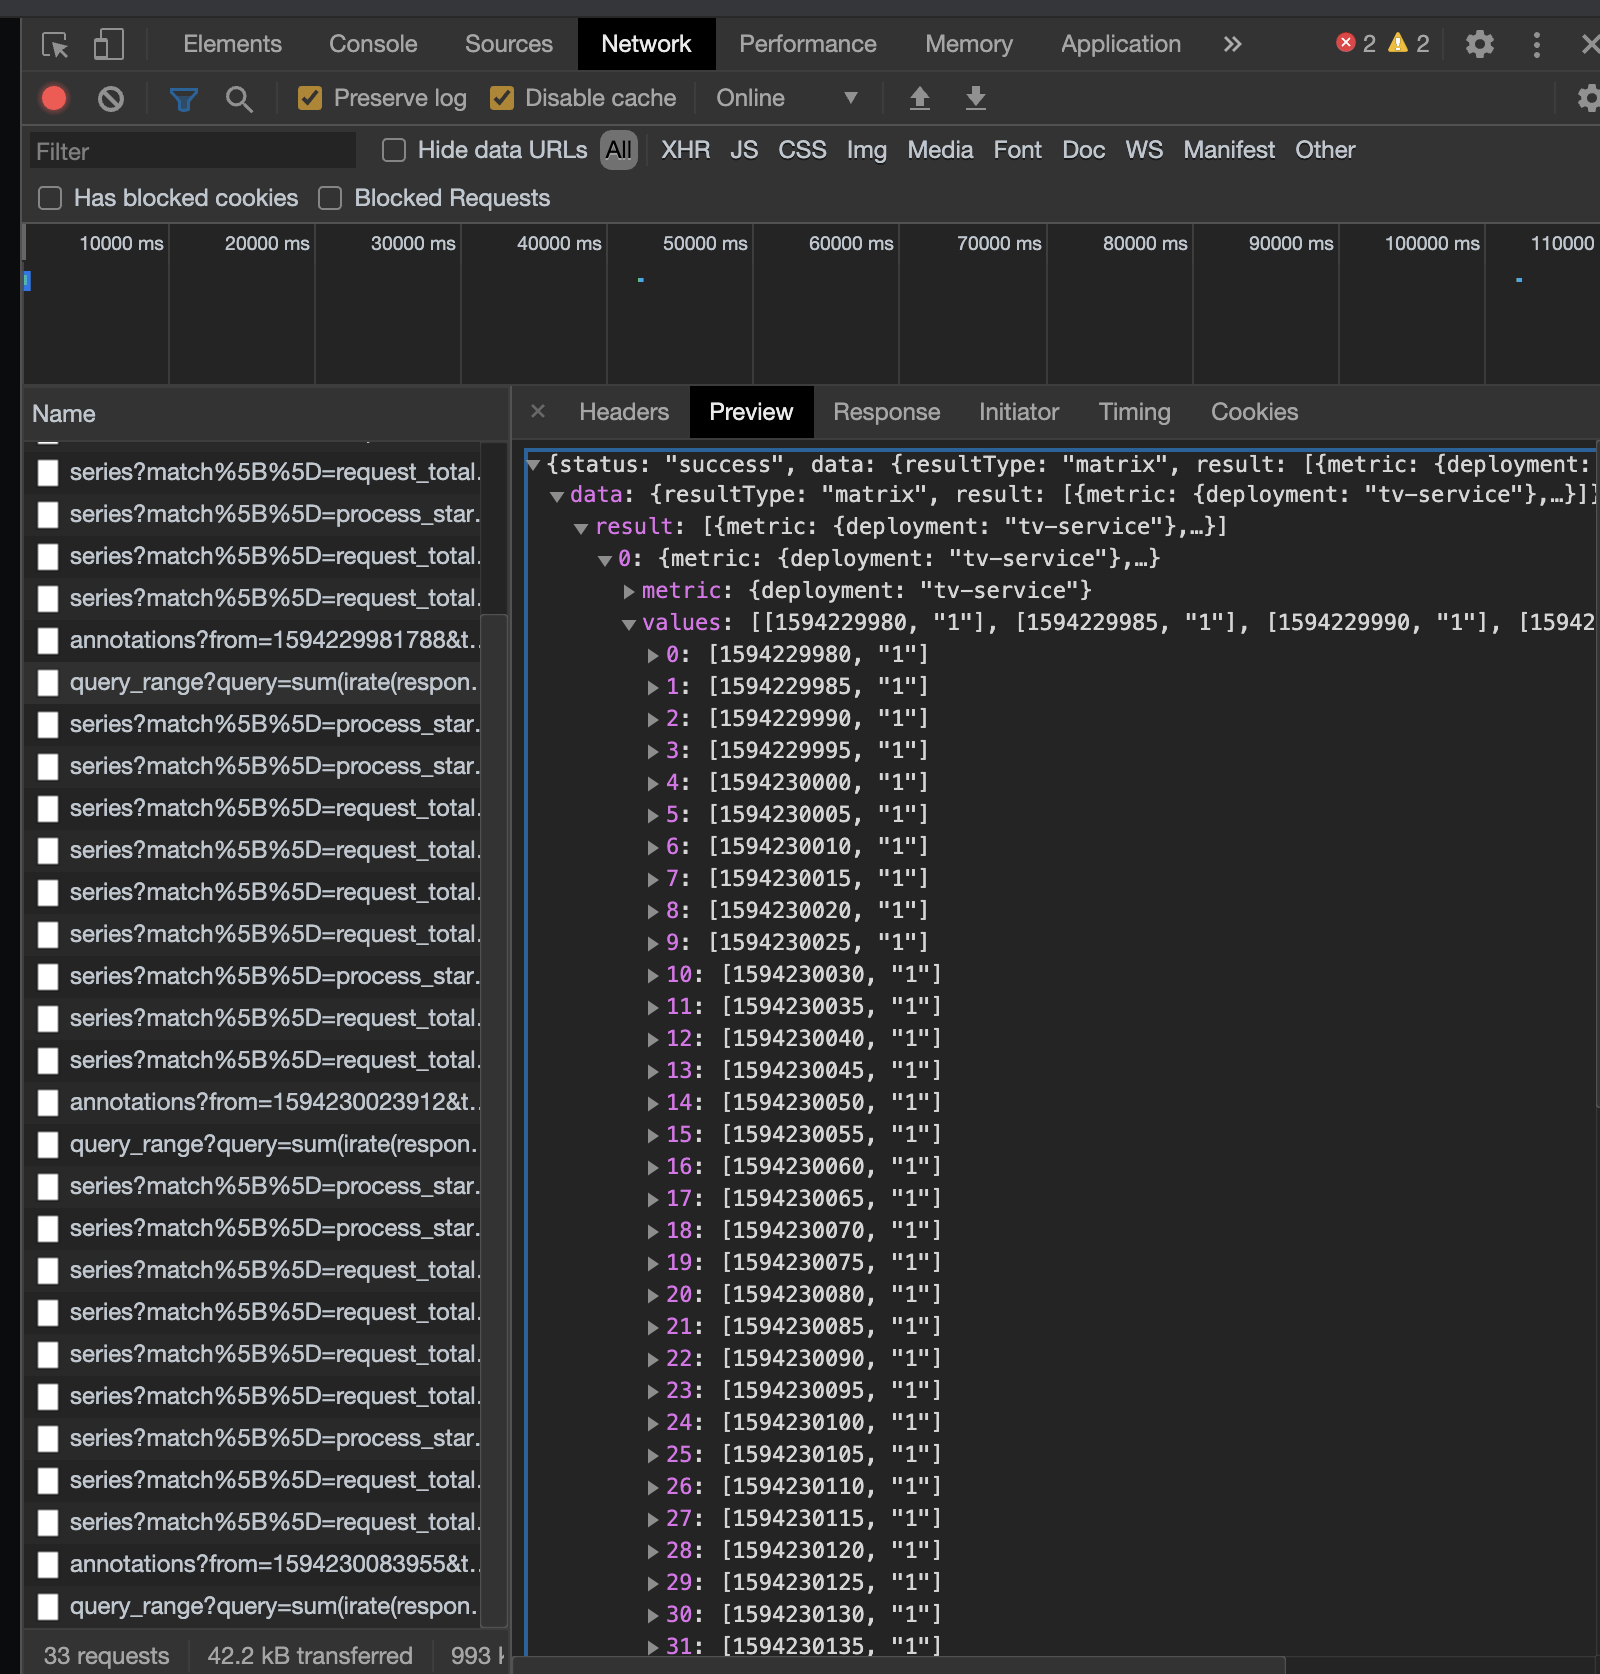
Prometheus
It's strange, but Inspect -> Data on graph not showing this numbers. It can be saw only in http response.
strobil
on 8 Jul 2020
There are the following pssible reasons the discrepancy on the last screenshots:
- Prometheus may round values with big number of floating-point digits.
- VictoriaMetrics may accumulate floating-point errors during slightly different calculations.
Try the following workarounds:
- Replacing
iratewithincreasein the original query in order to reduce the probability of accumulating floating-point errors during calculations. - Wrapping the original query into
round(q, 0.01). This will limit the floating-point errors to 2 decimal digits after the point. - Explicitly setting
yminandymaxin Grafana dashboard settings.
valyala
on 9 Jul 2020
Thanks for your help. Replacing irate with increase really helped for me.
irate
        "values": [
          [
            1594367625,
            "0.9999999999999998"
          ],
          [
            1594367640,
            "1"
          ],
          [
            1594367655,
            "0.9999999999999999"
          ],
          [
            1594367670,
            "1"
          ],
          [
            1594367685,
            "1.0000000000000002"
          ],
          [
            1594367700,
            "1.0000000000000002"
          ],
          [
            1594367715,
            "1.0000000000000002"
          ],
          [
            1594367730,
            "1.0000000000000002"
          ],
          [
            1594367745,
            "1.0000000000000002"
          ],
          [
            1594367760,
            "1.0000000000000002"
          ],
increase
"values": [
          [
            1594367625,
            "1"
          ],
          [
            1594367640,
            "1"
          ],
          [
            1594367655,
            "1"
          ],
          [
            1594367670,
            "1"
          ],
          [
            1594367685,
            "1"
          ],
          [
            1594367700,
            "1"
          ],
          [
            1594367715,
            "1"
          ],
          [
            1594367730,
            "1"
          ],
          [
            1594367745,
            "1"
          ],
          [
            1594367760,
            "1"
          ],
Related issues
 ozn0417
·
3Comments
ozn0417
·
3Comments
 genericgithubuser
·
4Comments
genericgithubuser
·
4Comments
 faceair
·
3Comments
faceair
·
3Comments
 Serrvosky
·
3Comments
Serrvosky
·
3Comments
 WilliamDahlen
·
3Comments
WilliamDahlen
·
3Comments