Victoriametrics: VM not returning the same results as prometheus
Describe the bug
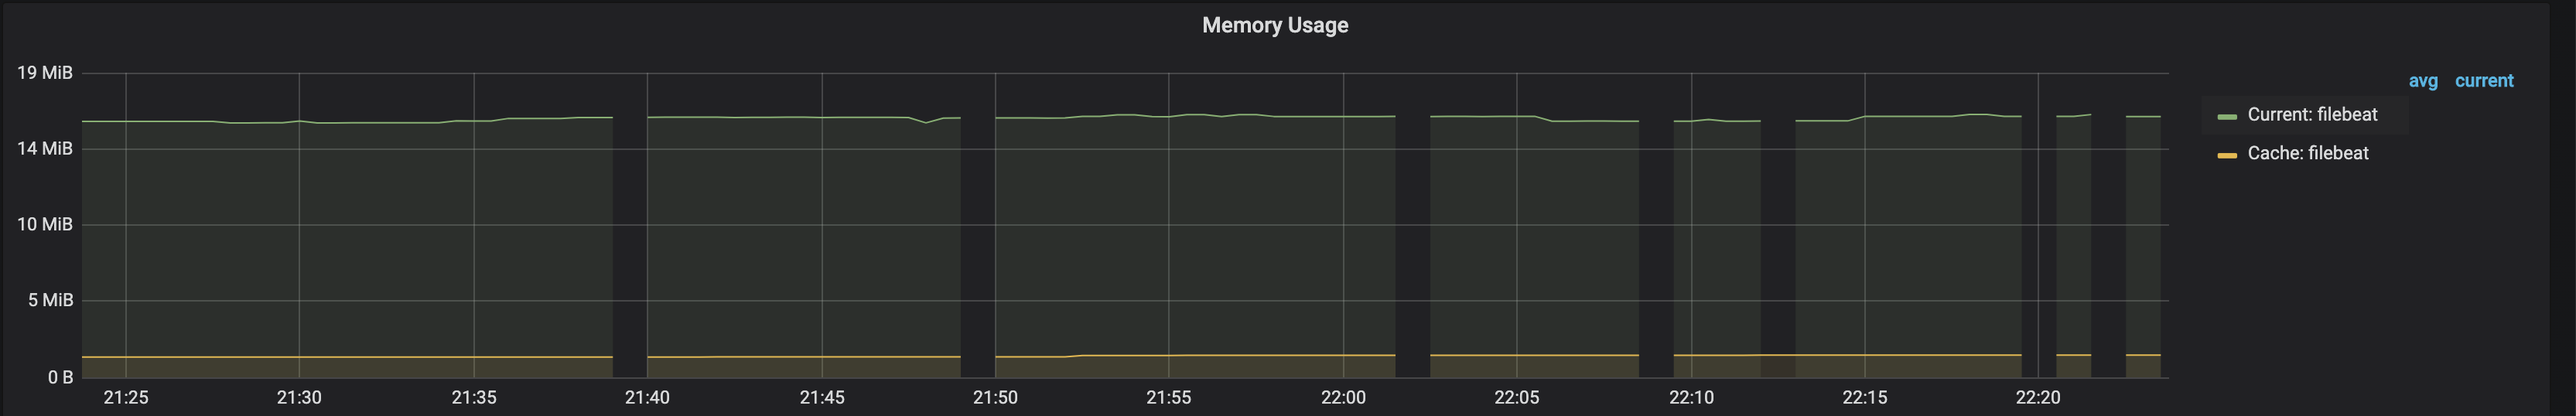
I just started using VM and started noticing a few gaps in various dashboards (Kubernetes). I noticed when I inspect the query result from Grafana, I get intermittent gaps in the timestamps and see gaps in graphs.
VM Datasource
api/datasources/proxy/1/api/v1/query_range?query=sum%20by(container)%20(container_memory_usage_bytes%7Bjob%3D%22kubelet%22%2C%20cluster%3D%22%22%2C%20namespace%3D%22default%22%2C%20pod%3D%22filebeat-72npk%22%2C%20container%3D~%22filebeat%22%2C%20container!%3D%22POD%22%7D)&start=1587358050&end=1587358260&step=30
Result:
0:Array[1587358050,1339392]
1:Array[1587358080,1339392]
2:Array[1587358110,1343488]
3:Array[1587358140,1343488]
4:Array[1587358200,1343488]
5:Array[1587358230,1343488]
6:Array[1587358260,1343488]
Prometheus Datasource:
api/datasources/proxy/1/api/v1/query_range?query=sum%20by(container)%20(container_memory_usage_bytes%7Bjob%3D%22kubelet%22%2C%20cluster%3D%22%22%2C%20namespace%3D%22default%22%2C%20pod%3D%22filebeat-72npk%22%2C%20container%3D~%22filebeat%22%2C%20container!%3D%22POD%22%7D)&start=1587358050&end=1587358260&step=30
Result:
0:Array[1587358050,1339392]
1:Array[1587358080,1339392]
2:Array[1587358110,1343488]
3:Array[1587358140,1343488]
4:Array[1587358170,1343488]
5:Array[1587358200,1343488]
6:Array[1587358230,1343488]
7:Array[1587358260,1343488]
^There seems to be a timestamp missing for the same query.
To Reproduce
Inspect results when calling api/datasources/proxy/1/api/v1/query_range with Prometheus and VM
Expected behavior
I expect both results to have matching timestamps
Screenshots
VM Datasource
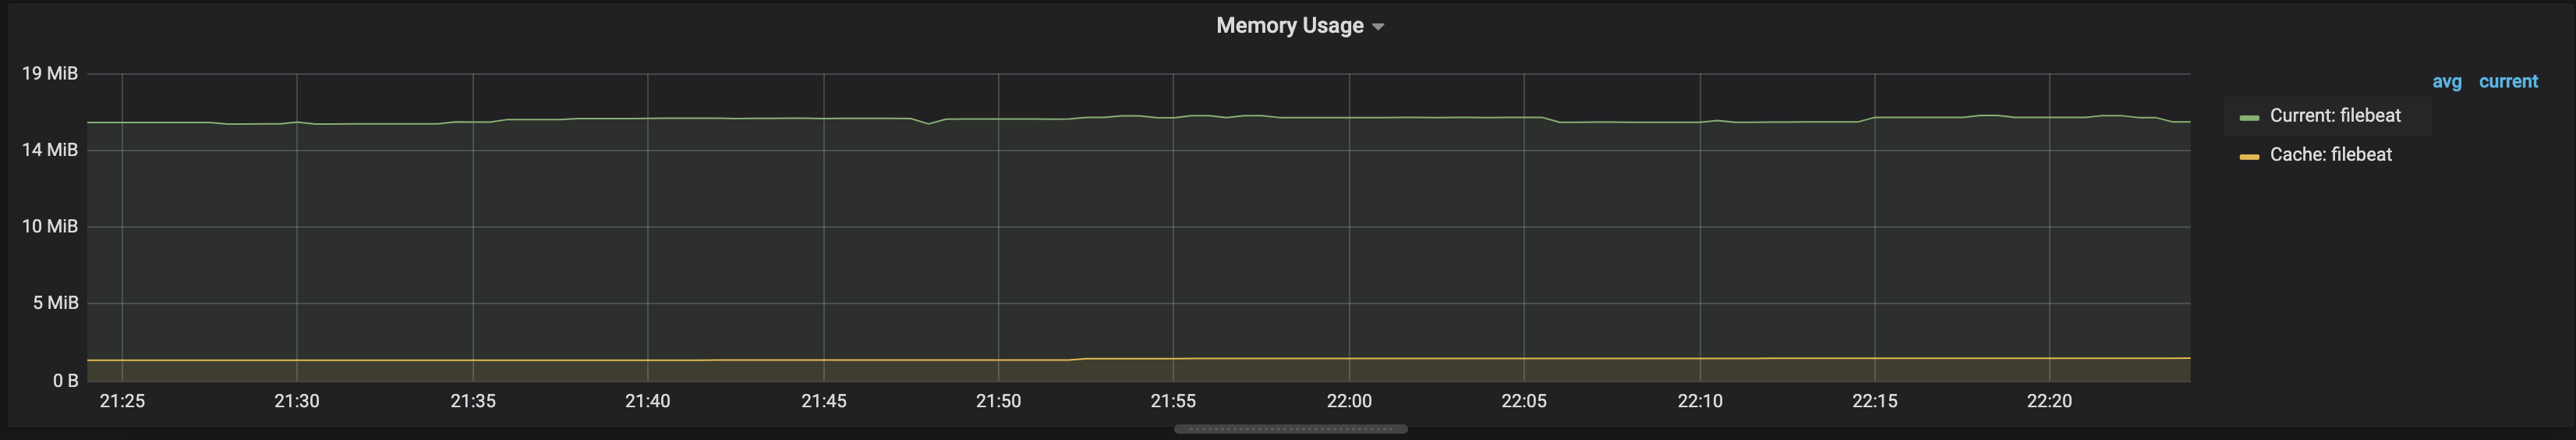
Prometheus Datasource
Version
The line returned when passing --version command line flag to binary. For example:
$ ./victoria-metrics-prod --version
victoria-metrics-20200417-111636-tags-v1.34.9-0-g43375df9
Used command-line flags
Command-line flags are listed as flag{name="httpListenAddr", value=":443"} 1 lines at /metrics page.
-retentionPeriod=12 -search.maxStalenessInterval=15m -search.maxLookback=10m
Additional context
My Prometheus scrape interval is currently set to 30s.
I have tried changing the values of both maxStalenessInterval and maxLookback to higher numbers but I still see the gaps, any ideas what I could be missing?
Thanks in advance!
 IpaliboWhyte
All 8 comments
@IpaliboWhyte , thanks for the detailed bug report! The /api/v1/query_range returns calculated data. It would be great to look at raw data in order to determine the part of VictoriaMetrics responsible for the issue - either incorrect raw data or a bug in the query engine.
Could you look at the data returned from /api/v1/export for the following match[] arg on the same time range :
container_memory_usage_bytes{job="kubelet", cluster="", namespace="default", pod="filebeat-72npk", container=~"filebeat", container!="POD"}
The query should look like the following:
api/datasources/proxy/1/api/v1/export?match[]=container_memory_usage_bytes%7Bjob%3D%22kubelet%22%2C%20cluster%3D%22%22%2C%20namespace%3D%22default%22%2C%20pod%3D%22filebeat-72npk%22%2C%20container%3D~%22filebeat%22%2C%20container!%3D%22POD%22%7D&start=1587358050&end=1587358260
If the query will return too many time series, then try narrowing down the query by adding more specific label filters to it in order to reduce the number of returned time series.
If the raw data has no data points on the time range (1587358140...1587358170] (note that /api/v1/export returns unix timestamps in milliseconds, so just ignore the last 3 digits in the returned timestamps), then this means that VictoriaMetrics didn't receive this data from Prometheus. Then look into Prometheus and VictoriaMetrics logs around this time range - probably there were errors during transferring the data from Prometheus to VictoriaMetrics.
If the raw data has the same amount of data points on the time range (1587358140...1587358170], then the issue is in query engine. I'd recommend starting with resetting response cache by calling /internal/resetRollupResultCache handler in VictoriaMetrics and then verifying whether the issue is fixed. If this fixes the issue, then this means that Prometheus sometimes writes samples with timestamps older than 5 minutes from now to VictoriaMetrics (this duration can be tuned with -search.cacheTimestampOffset command-line flag). Such issues may be due to the following reasons:
Too high ingestion rate from Prometheus to VictoriaMetrics, which leads to periodic lags in data ingestion. The solution is to tune
remote_write->queue_configsection in Prometheus as described in the docs. Make sure that both Prometheus and VictoriaMetrics have enough CPU resources for data ingestion. See capacity planning docs for details. It is also recommended setting up monitoring for VictoriaMetrics in order to understand better how does it work. See these docs for details.Unsynchronized time on Prometheus and VictoriaMetrics machines. Make sure that
dateoutput for both machines return identical times.
 valyala
on 20 Apr 2020
valyala
on 20 Apr 2020
@valyala Thanks a lot for the quick response!
I did inspect the query response of /api/v1/export and got the following:
"values": [
    16707584,
    17014784,
    17027072,
    17031168,
    17027072,
    17027072
  ],
  "timestamps": [
    1587358071338,
    1587358099308,
    1587358129520,
    1587358170653,
    1587358187053,
    1587358221655
  ]
Looks like the only value within that range is 1587358170, So the issue is likely on the Prometheus side? I just checked my prometheus container logs, around the same timestamp and I don't see any errors, I do see a few warning though:
ts=2020-04-20T04:48:32.244Z caller=dedupe.go:112 component=remote level=warn remote_name=52c21e url=http://<victoria-metrics-host>:8428/api/v1/write msg="Skipping resharding, last successful send was beyond threshold" lastSendTimestamp=1587358059 minSendTimestamp=1587358102
ts=2020-04-20T04:48:42.244Z caller=dedupe.go:112 component=remote level=warn remote_name=52c21e url=http://<victoria-metrics-host>:8428/api/v1/write msg="Skipping resharding, last successful send was beyond threshold" lastSendTimestamp=1587358059 minSendTimestamp=1587358112
ts=2020-04-20T04:48:52.244Z caller=dedupe.go:112 component=remote level=warn remote_name=52c21e url=http://<victoria-metrics-host>:8428/api/v1/write msg="Skipping resharding, last successful send was beyond threshold" lastSendTimestamp=1587358059 minSendTimestamp=1587358122
ts=2020-04-20T04:49:02.244Z caller=dedupe.go:112 component=remote level=warn remote_name=52c21e url=http://<victoria-metrics-host>:8428/api/v1/write msg="Skipping resharding, last successful send was beyond threshold" lastSendTimestamp=1587358059 minSendTimestamp=1587358132
ts=2020-04-20T04:49:12.244Z caller=dedupe.go:112 component=remote level=warn remote_name=52c21e url=http://<victoria-metrics-host>:8428/api/v1/write msg="Skipping resharding, last successful send was beyond threshold" lastSendTimestamp=1587358059 minSendTimestamp=1587358142
ts=2020-04-20T04:49:22.244Z caller=dedupe.go:112 component=remote level=warn remote_name=52c21e url=http://<victoria-metrics-host>:8428/api/v1/write msg="Skipping resharding, last successful send was beyond threshold" lastSendTimestamp=1587358059 minSendTimestamp=1587358152
ts=2020-04-20T04:49:32.244Z caller=dedupe.go:112 component=remote level=warn remote_name=52c21e url=http://<victoria-metrics-host>:8428/api/v1/write msg="Skipping resharding, last successful send was beyond threshold" lastSendTimestamp=1587358059 minSendTimestamp=1587358162
ts=2020-04-20T04:49:42.244Z caller=dedupe.go:112 component=remote level=warn remote_name=52c21e url=http://<victoria-metrics-host>:8428/api/v1/write msg="Skipping resharding, last successful send was beyond threshold" lastSendTimestamp=1587358059 minSendTimestamp=1587358172
ts=2020-04-20T04:49:52.244Z caller=dedupe.go:112 component=remote level=warn remote_name=52c21e url=http://<victoria-metrics-host>:8428/api/v1/write msg="Skipping resharding, last successful send was beyond threshold" lastSendTimestamp=1587358059 minSendTimestamp=1587358182
I don't see these warnings when trying to match log timestamps with newer gaps though so I'm not sure how relevant this is, VM metric logs seems to be quiet, no error/warning logs.
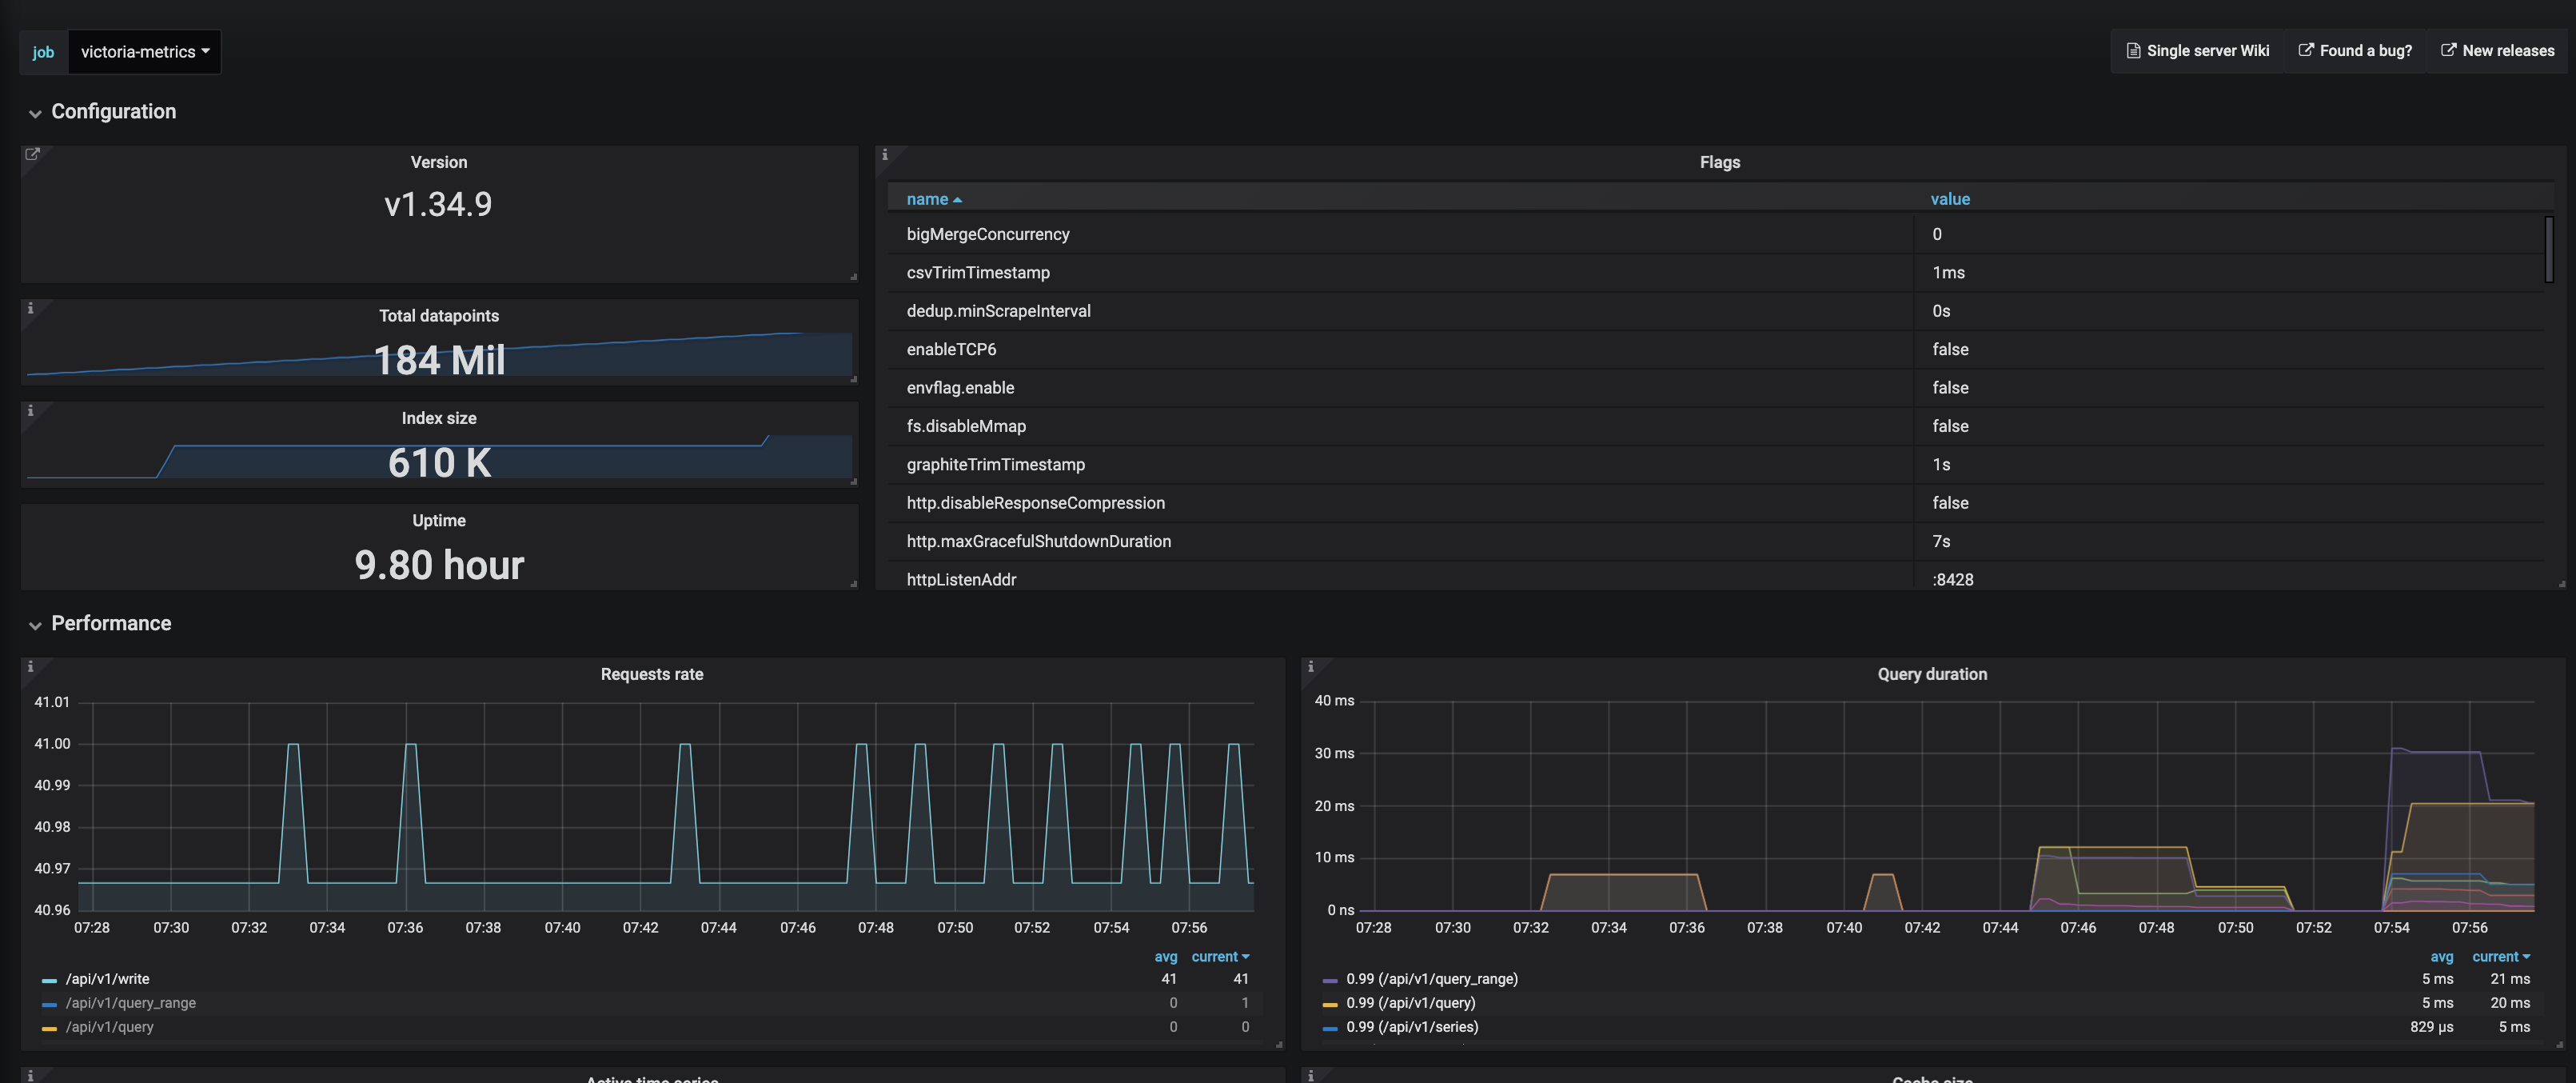
I do have monitoring setup for VM and Prometheus remote writes:
Prometheus Remote Writes:
I wonder if Pending samples could be the culprit here:
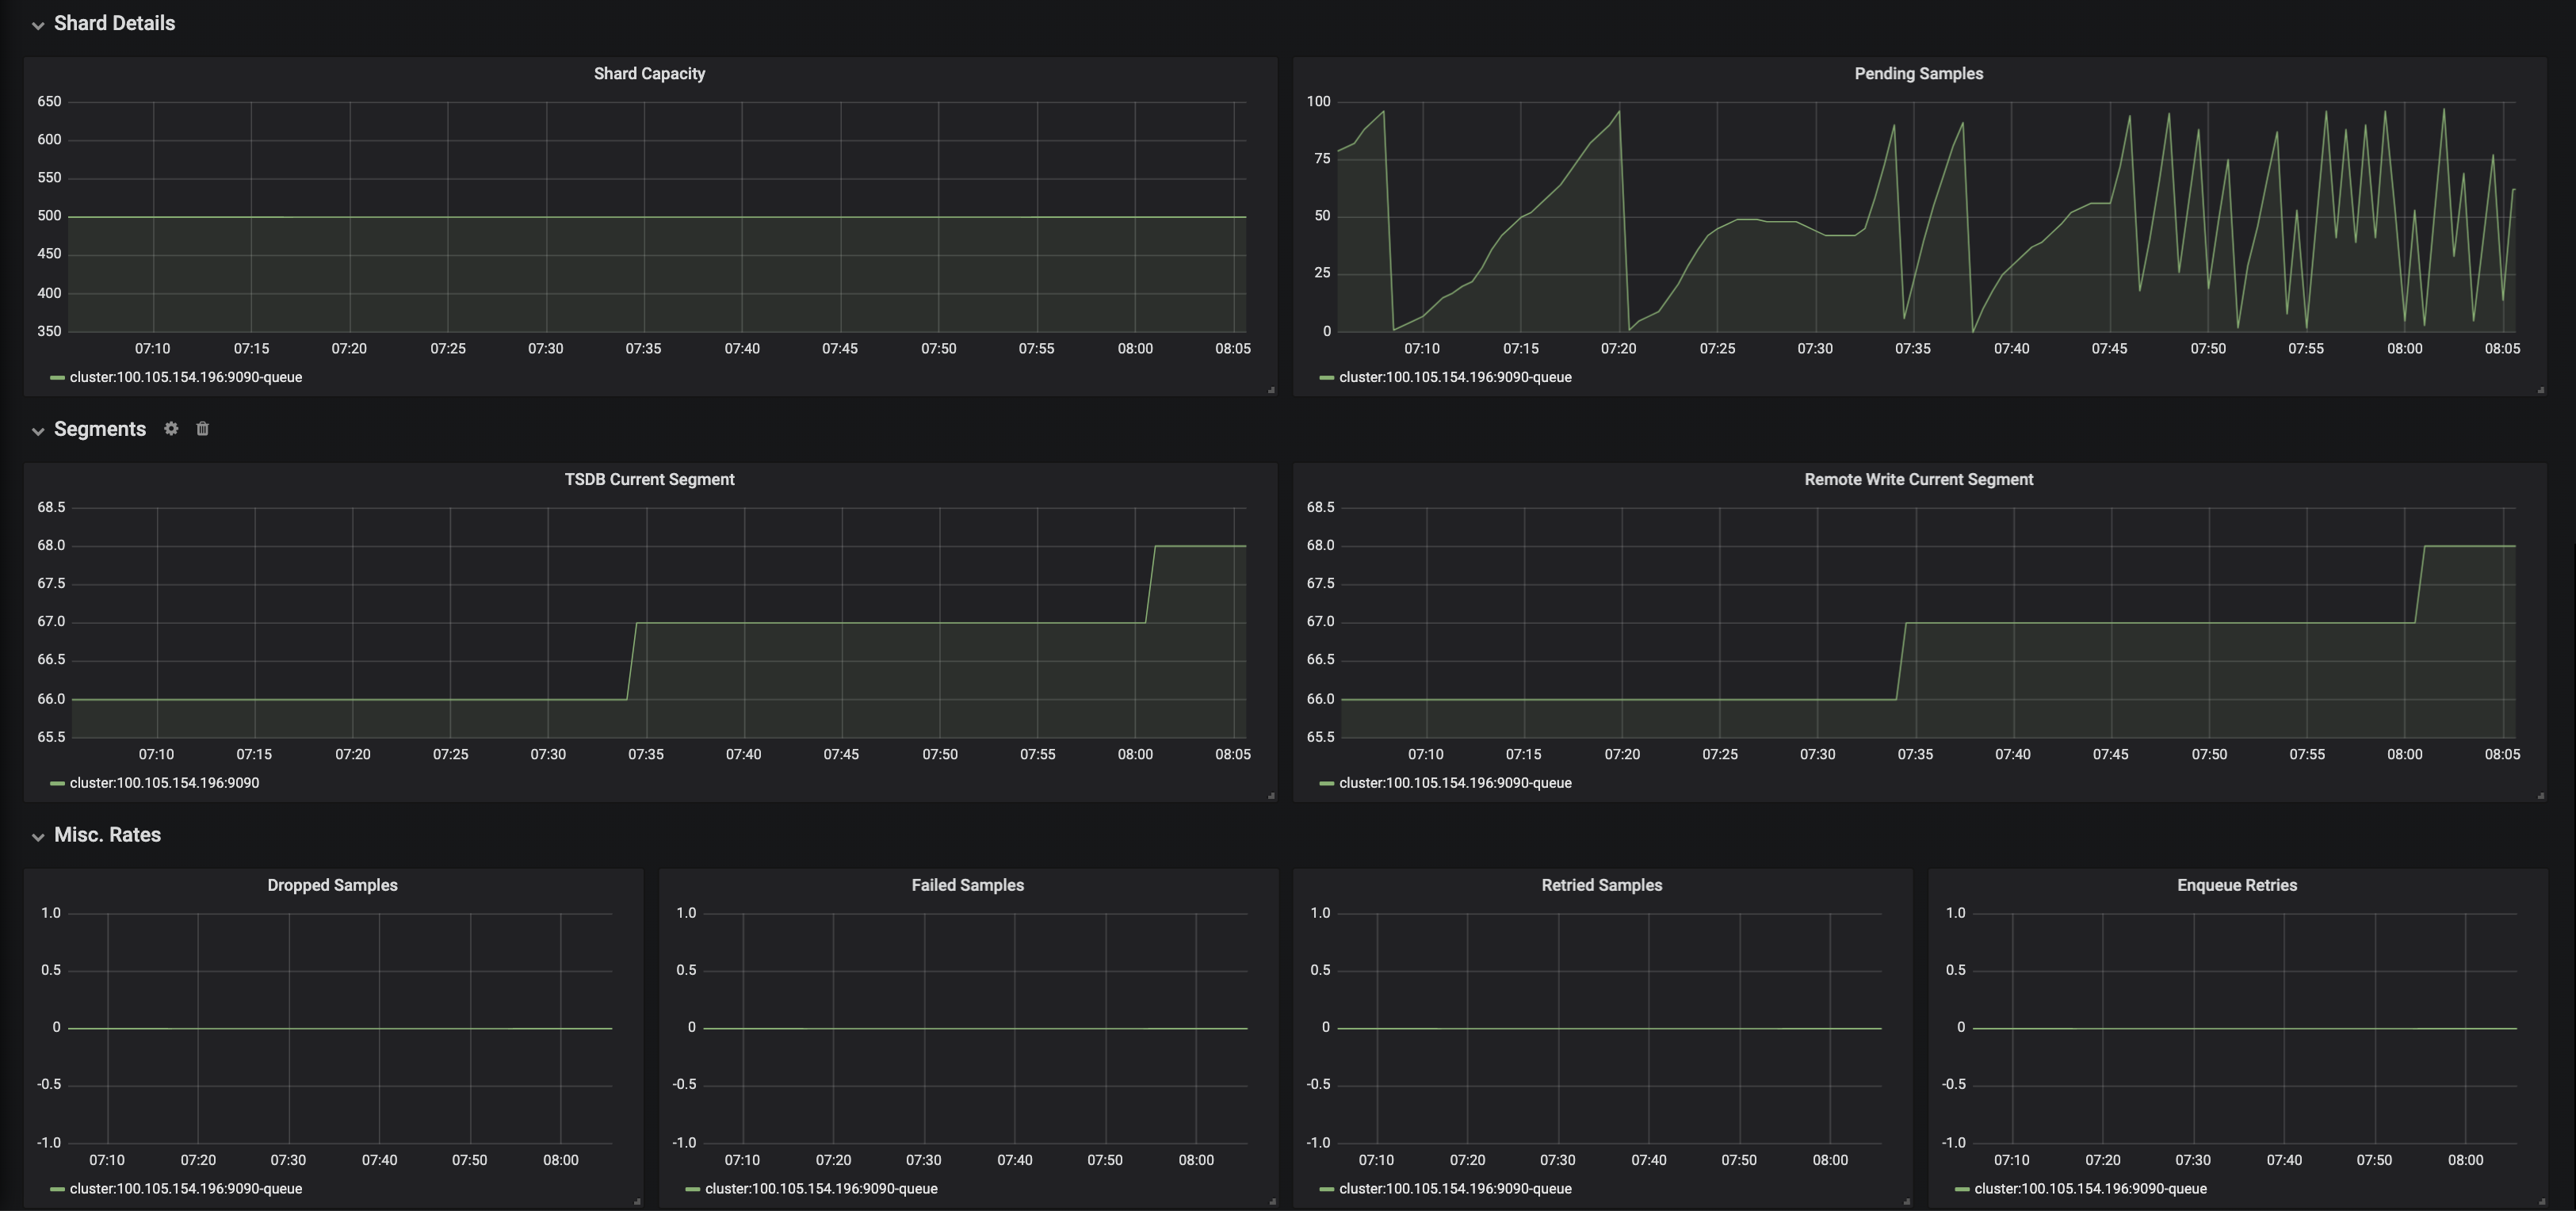
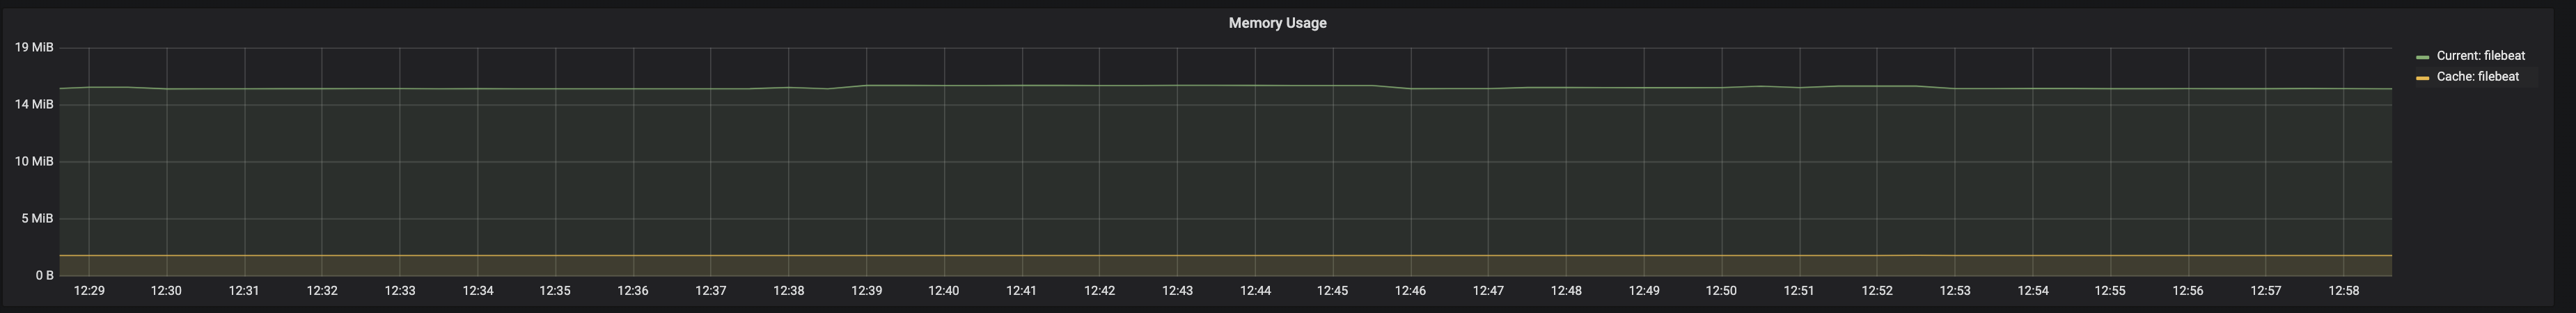
VM
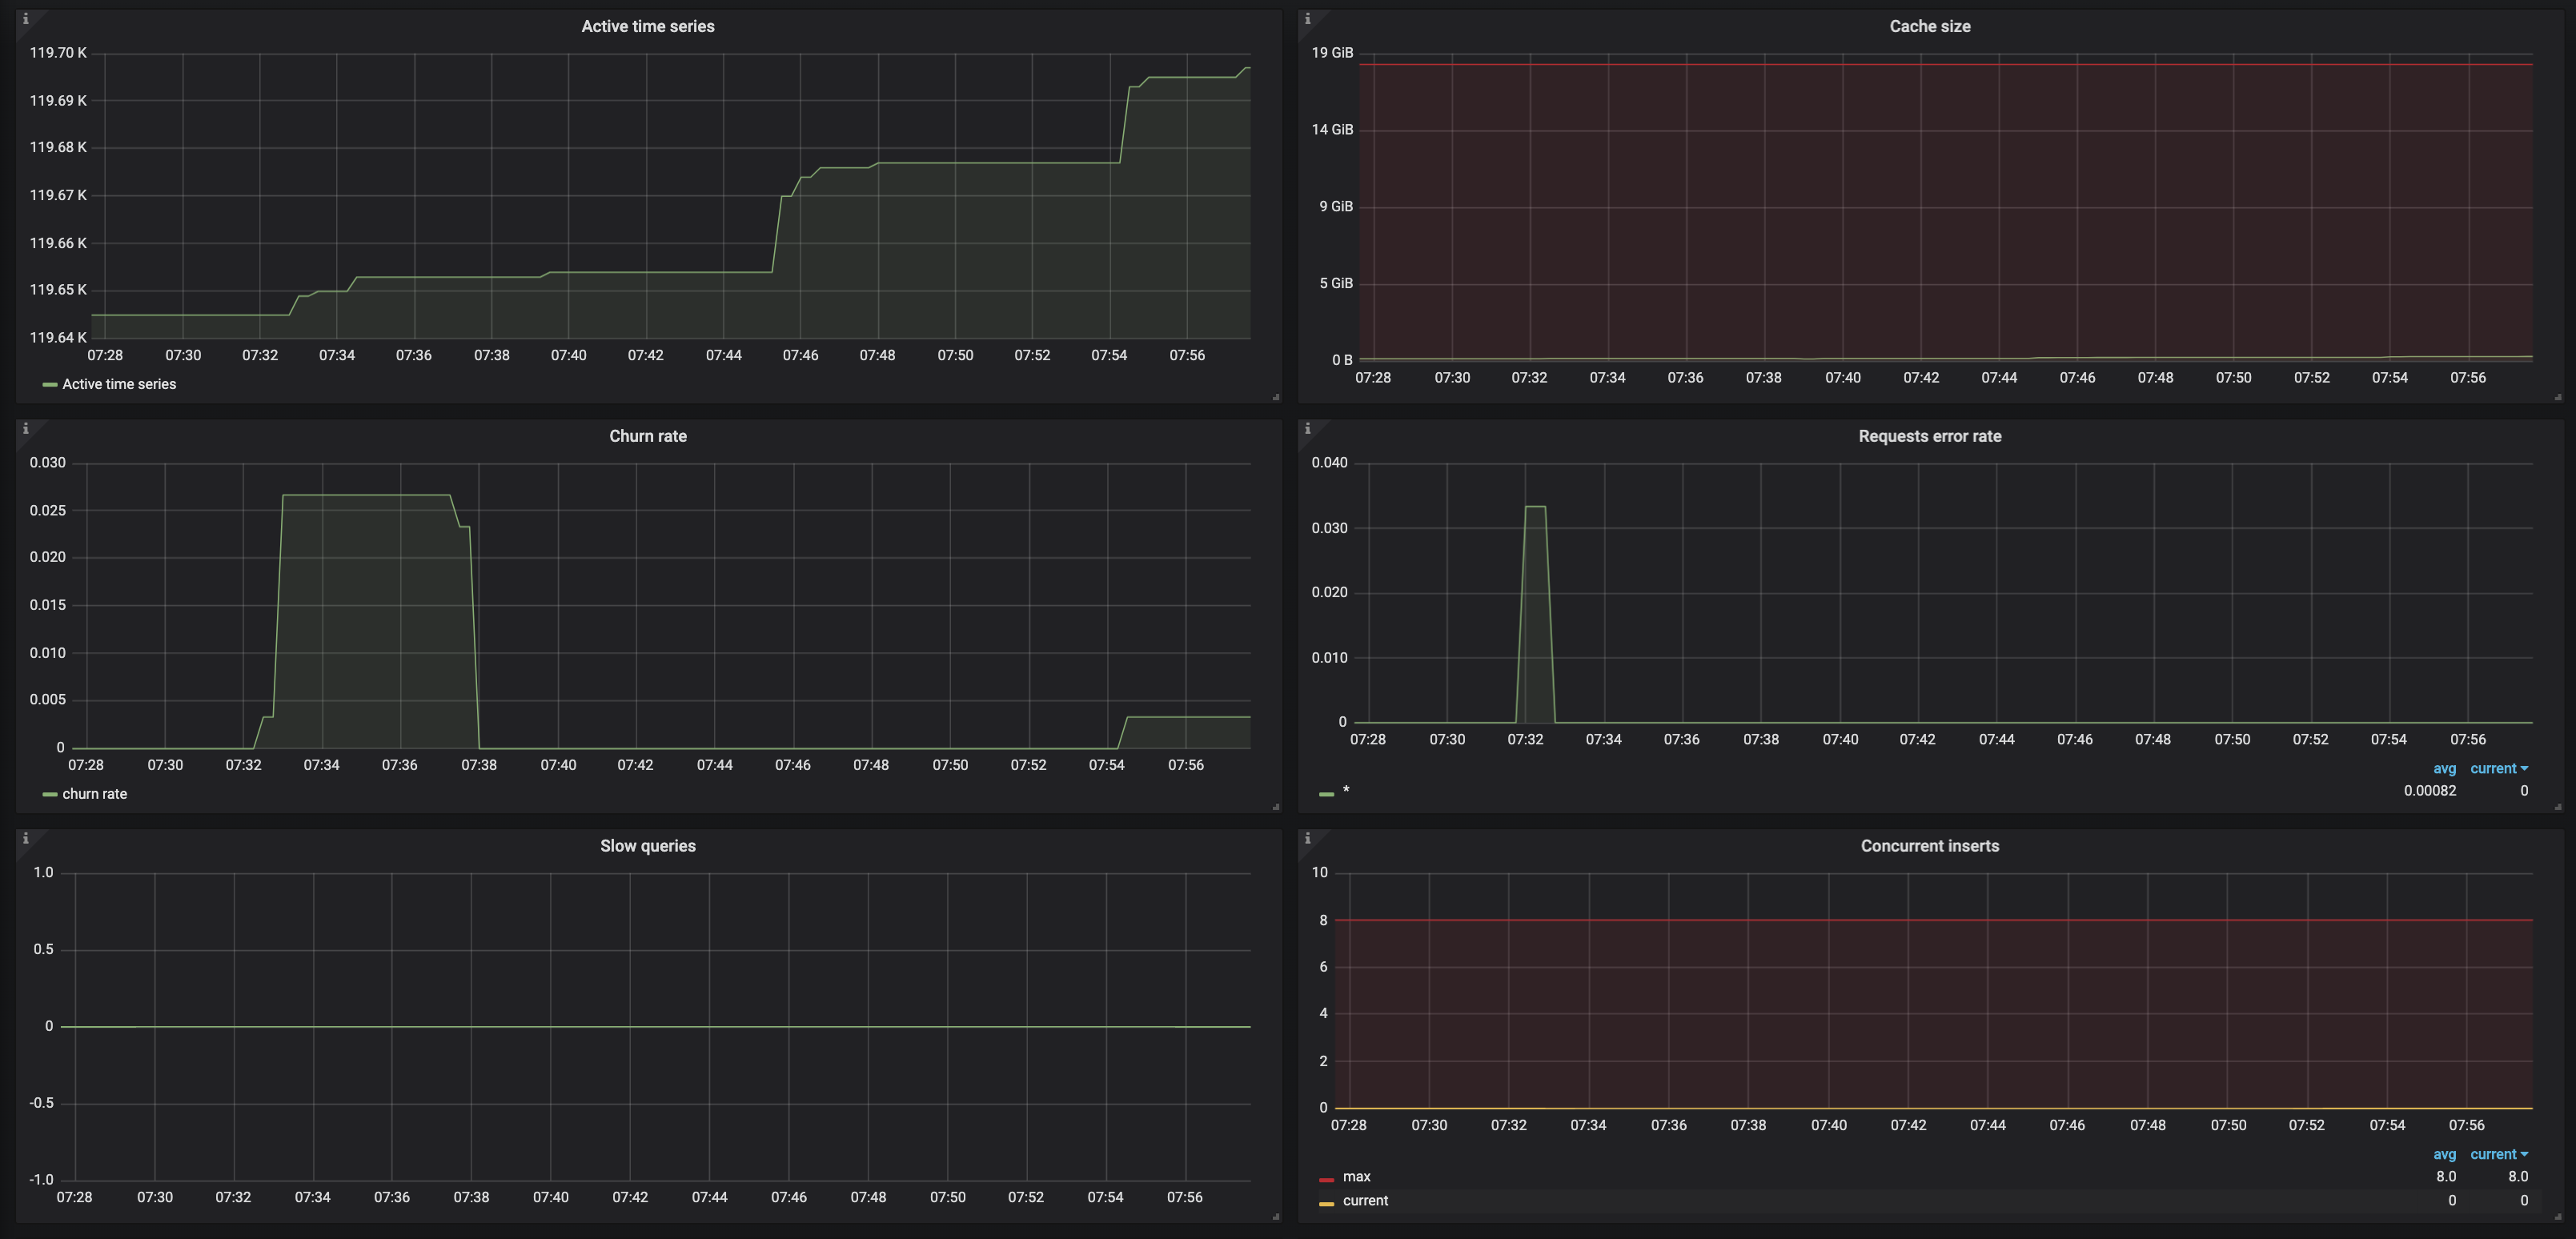
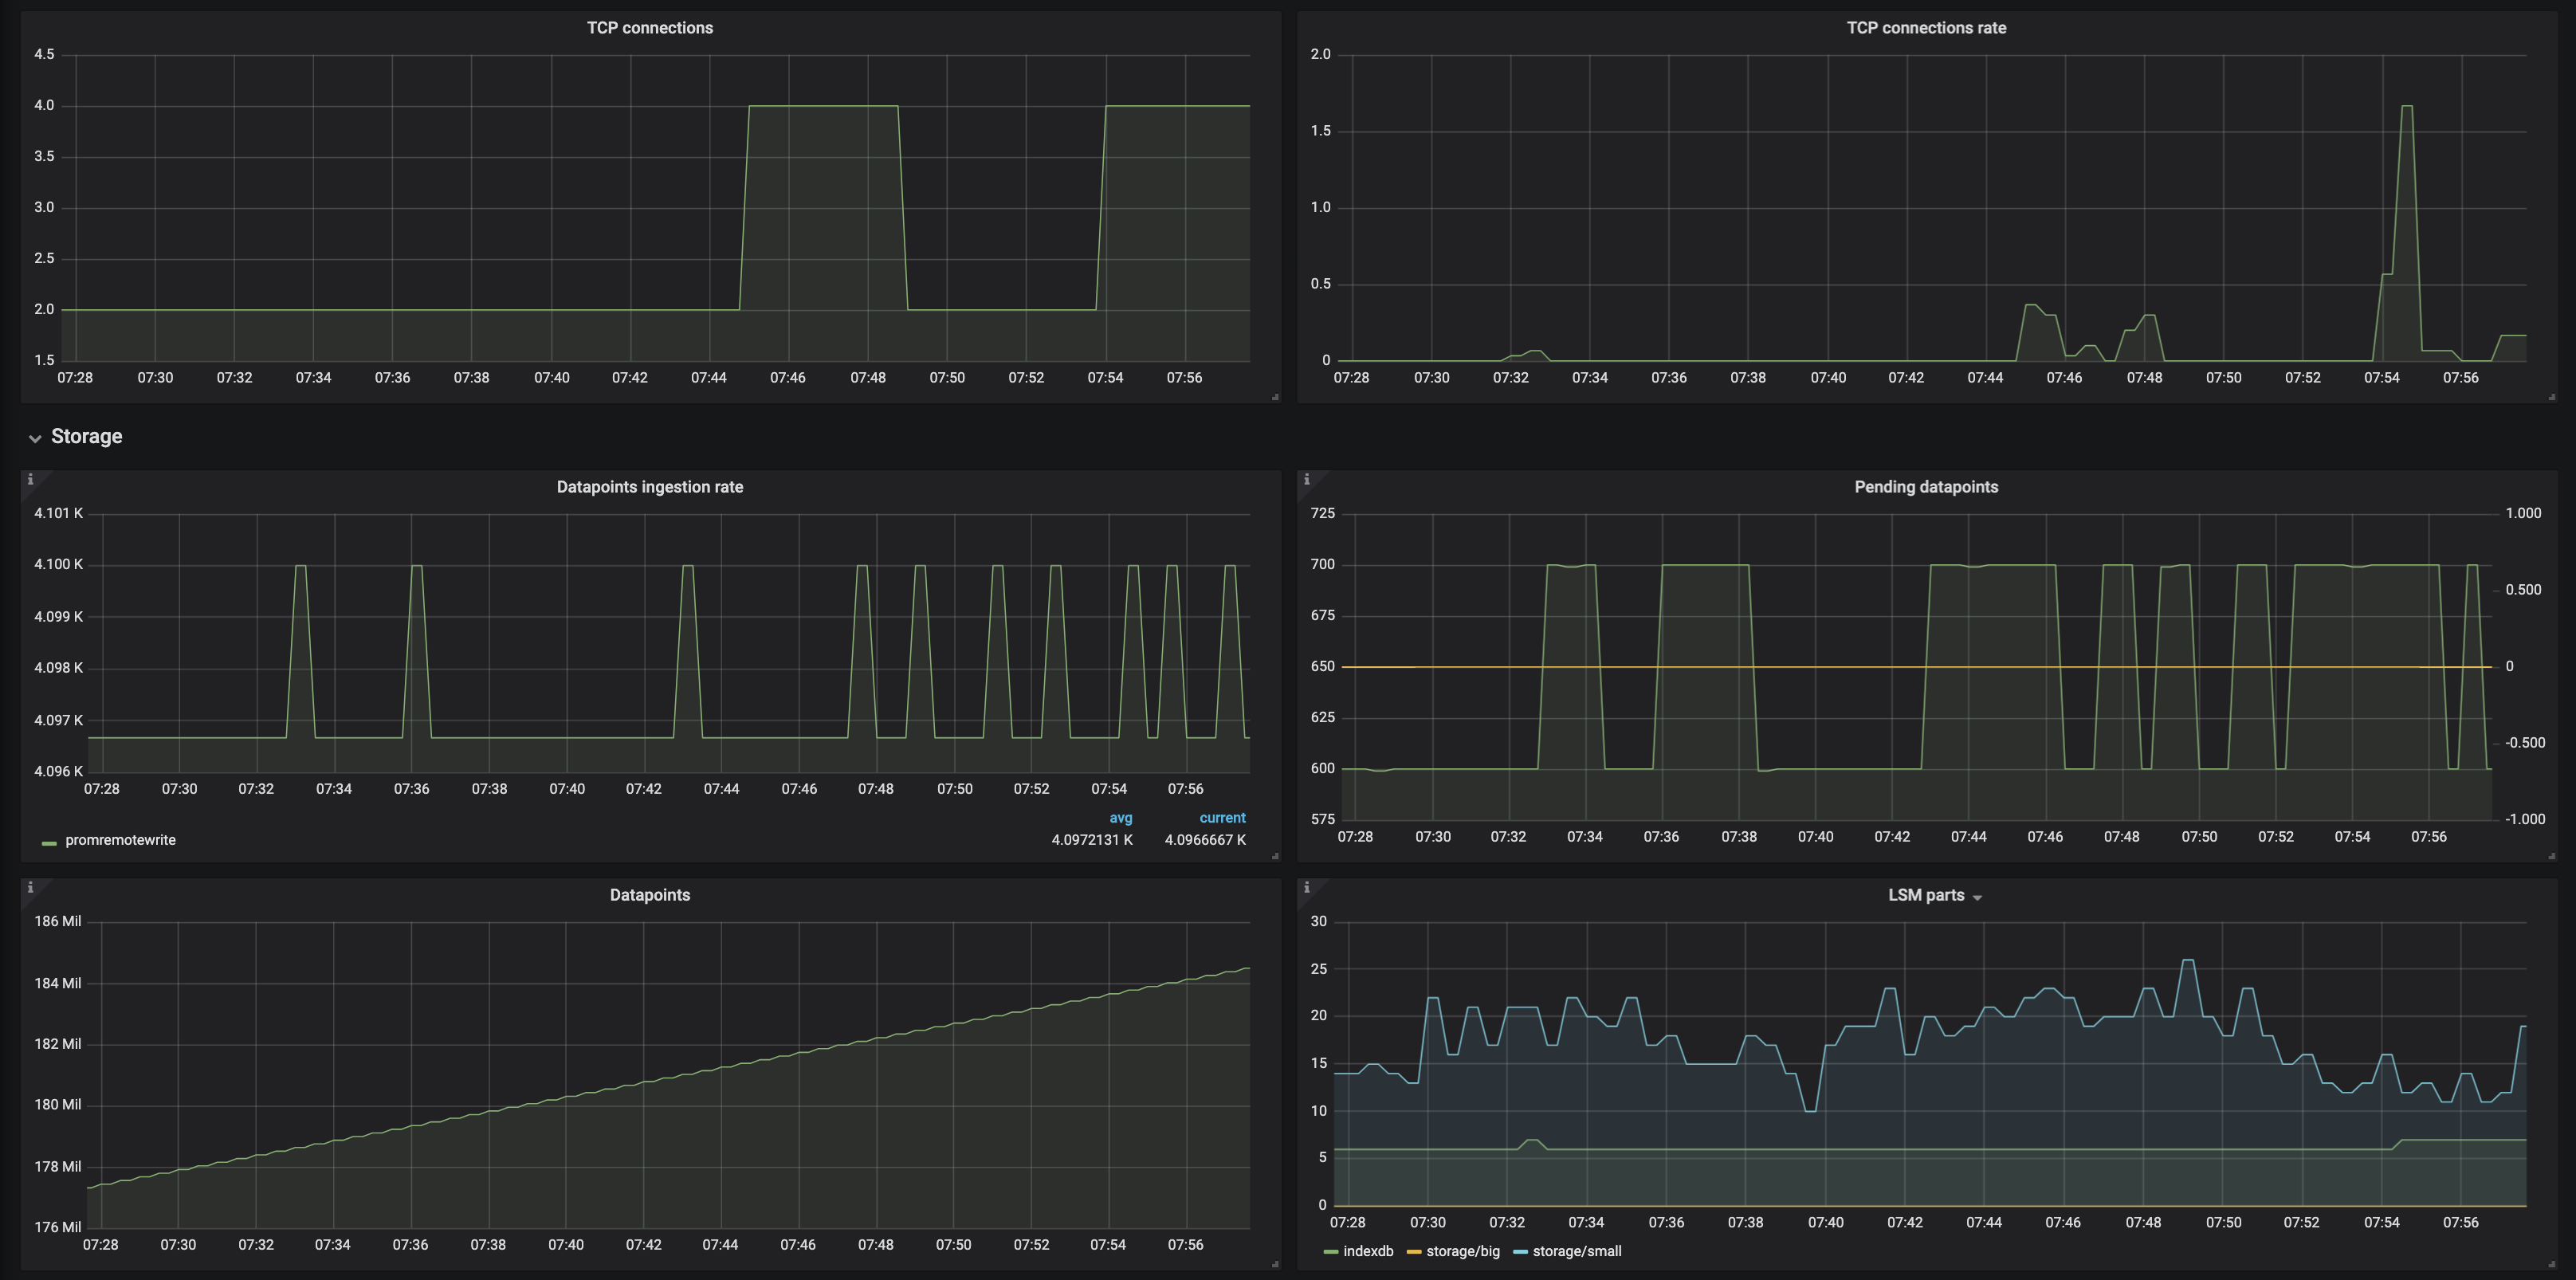
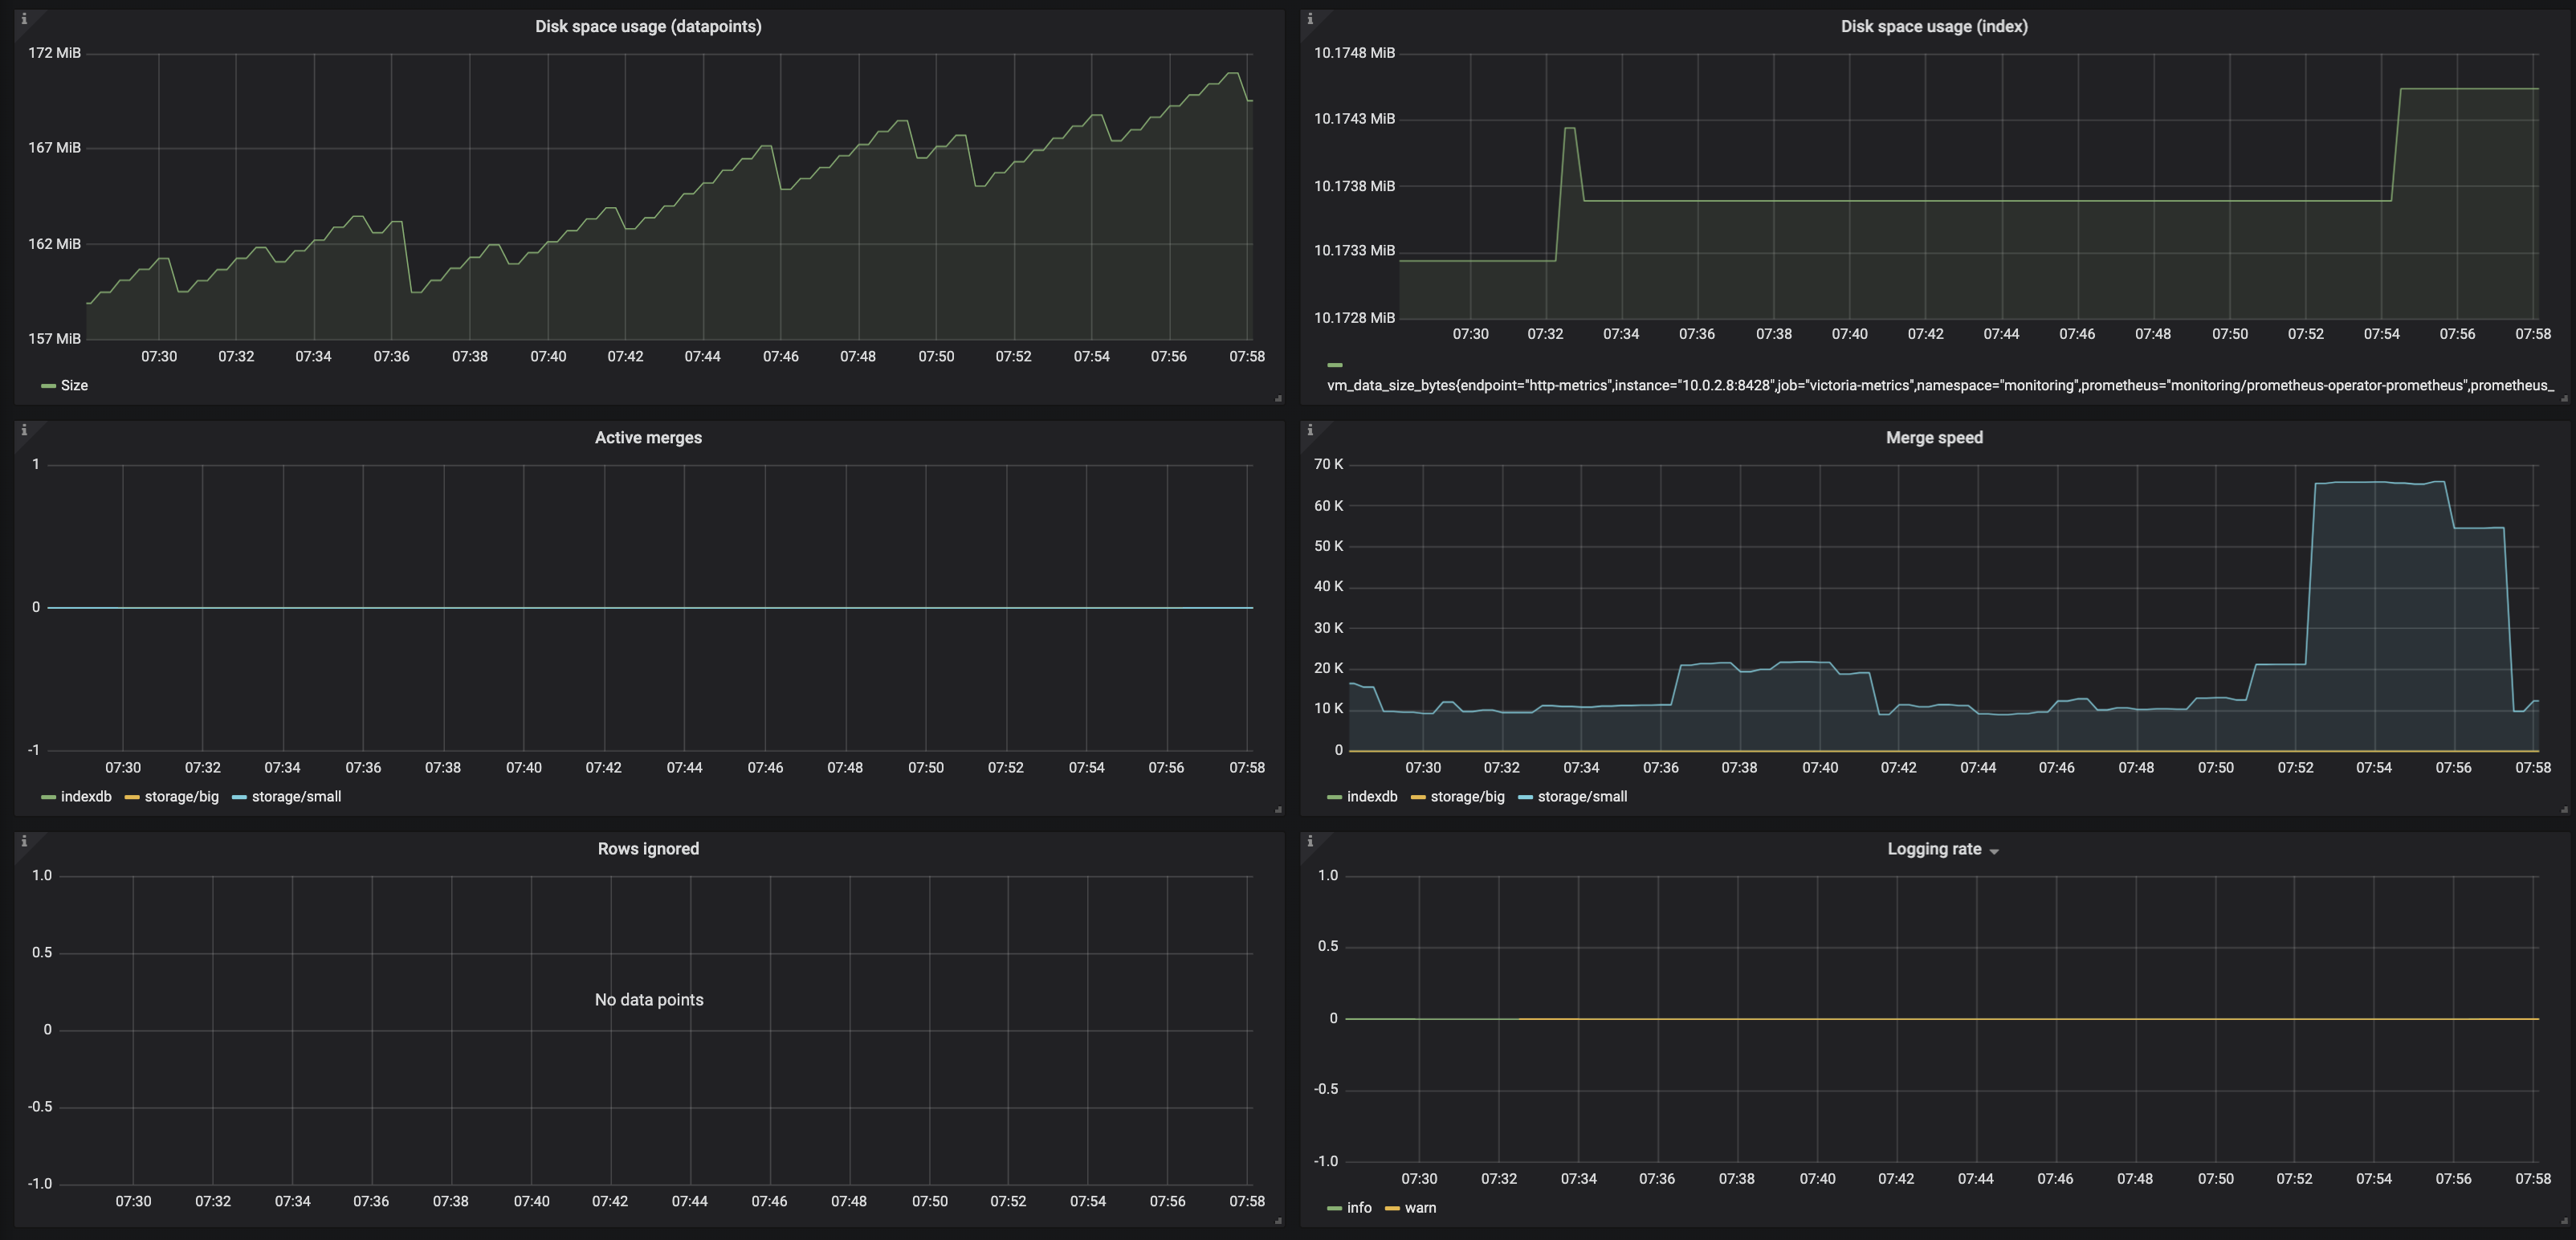
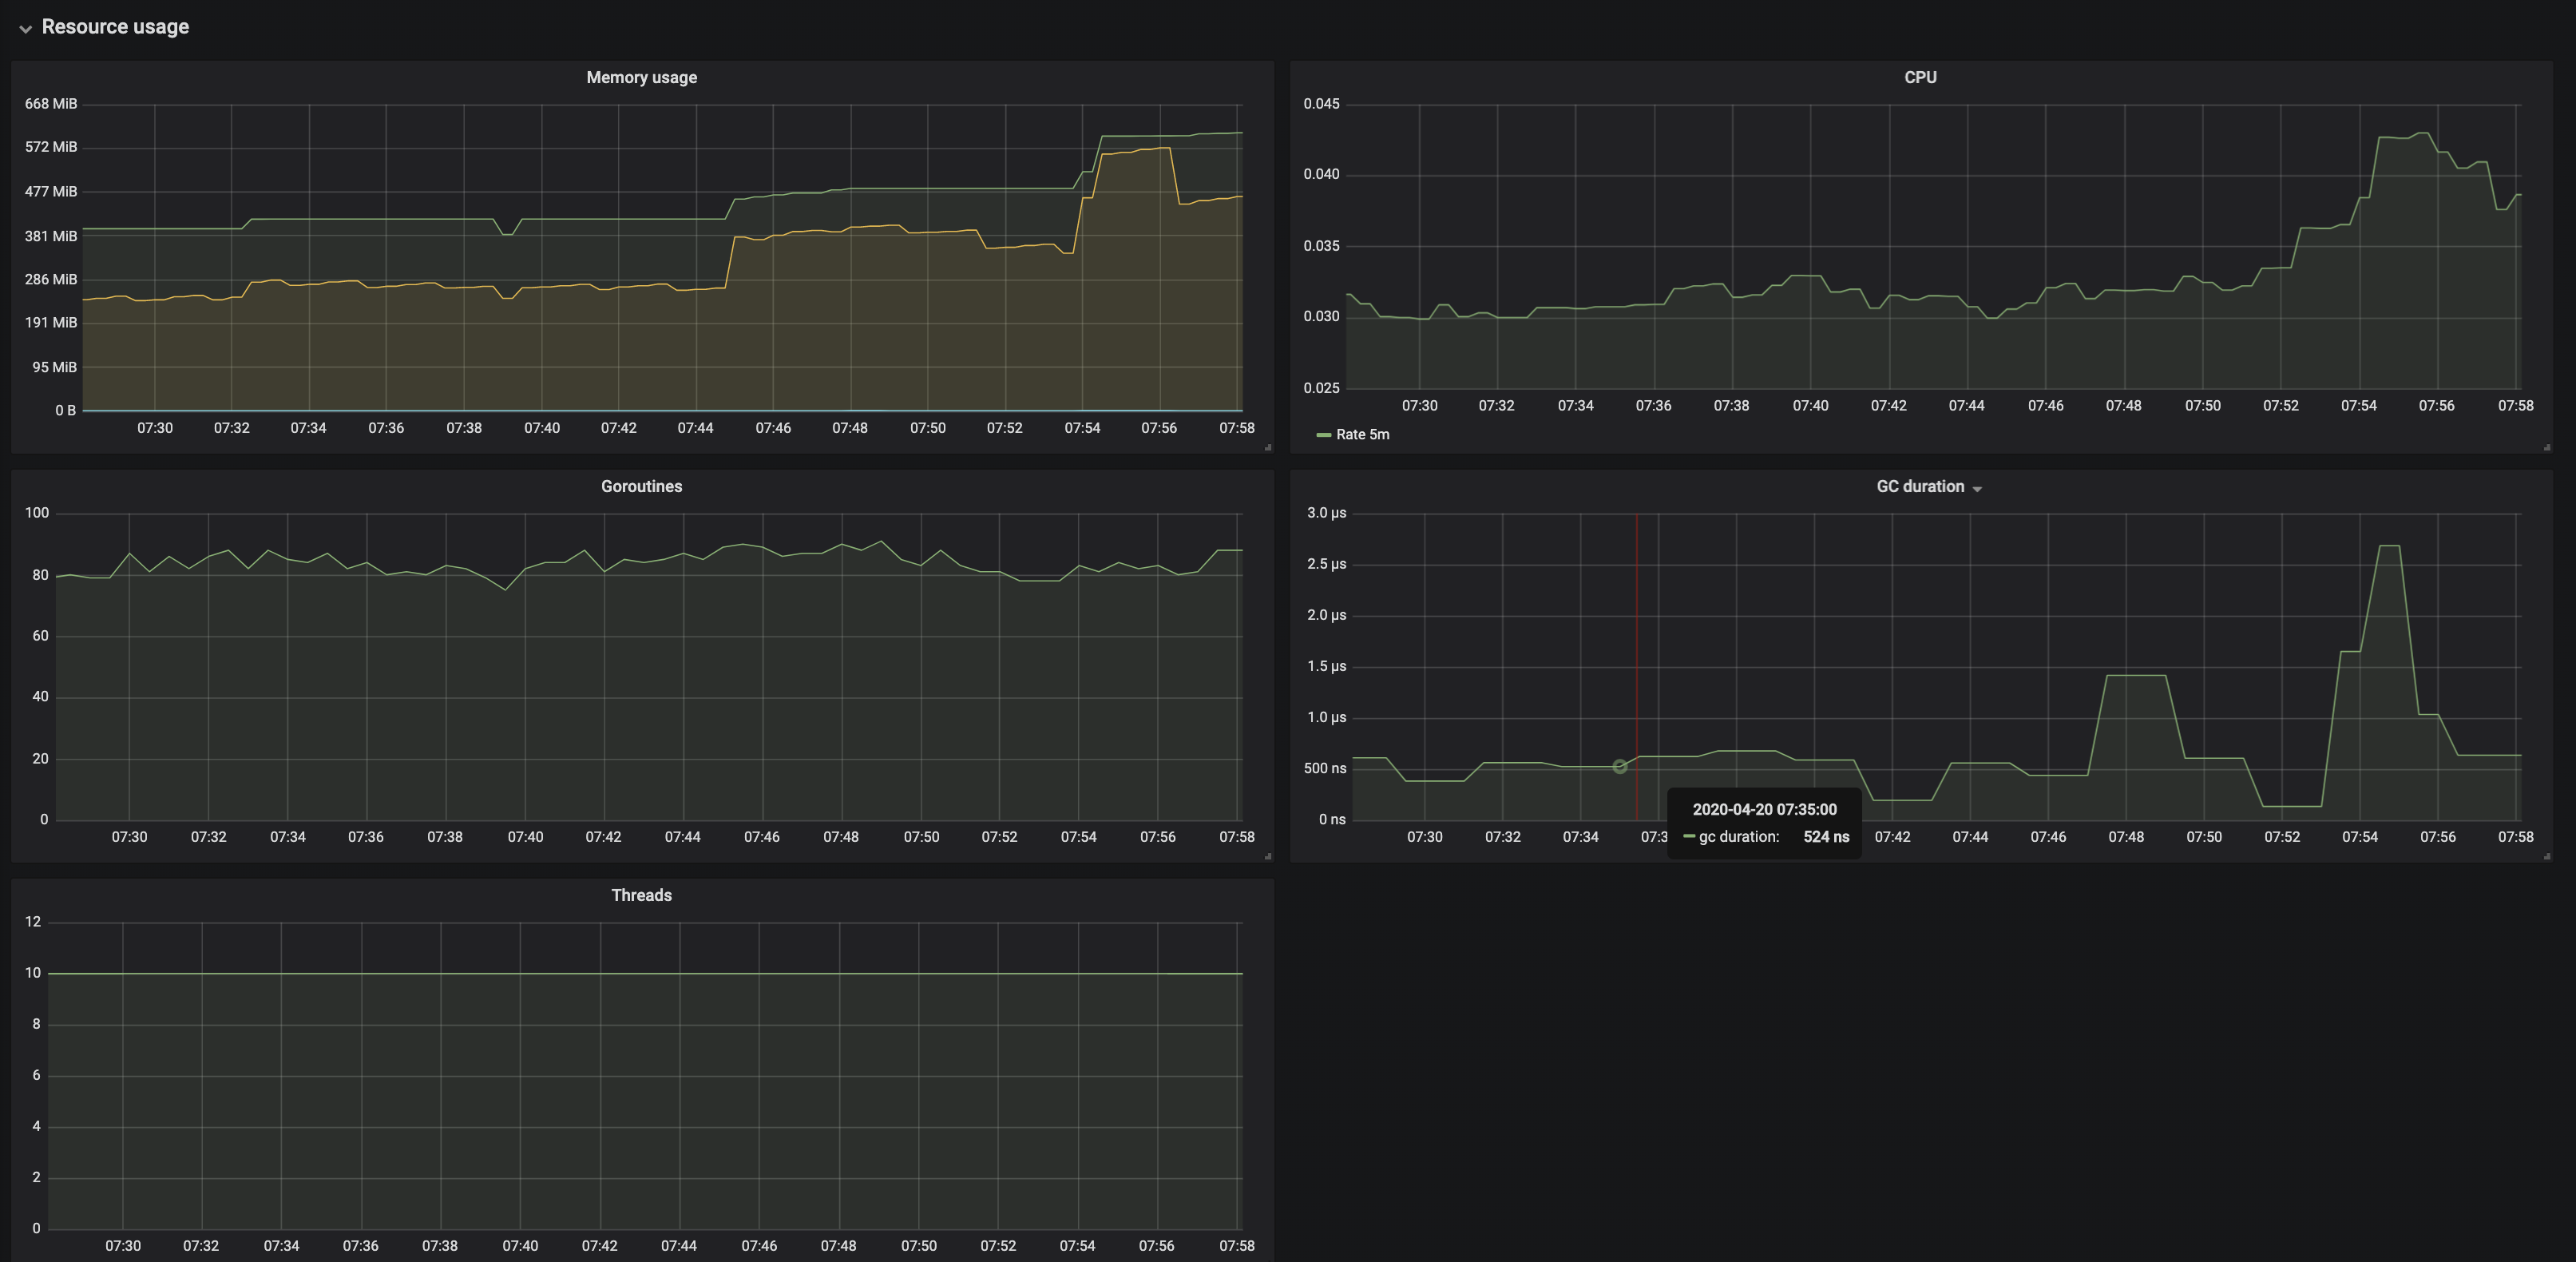
The gaps are still happening and the above screenshots are more recent. Let me know what your thoughts are.
I did attempt requesting /internal/resetRollupResultCache just in case, but no luck with that either (The gaps are still visible)
Thank you once again!
IpaliboWhyte
on 20 Apr 2020
The delta between timestamps at raw data (I assume these timestamps belong to a single time series) look suspicions:
    1587358071338,
    1587358099308,
    1587358129520,
    1587358170653,
    1587358187053,
    1587358221655
Usually Prometheus should scrape metrics with regular interval defined in scrape_interal option. See docs about this option here. The delta between timestamps above suggests that something is wrong with scrape_interval on Prometheus side:
    1587358099308 - 1587358071338 = 27970 (close to 30s),
    1587358129520 - 1587358099308 = 30212 (close to 30s).
    1587358170653 - 1587358129520 = 41133 (much bigger than 30s)
    1587358187053 - 1587358170653 = 16400 (much smaller than 30s)
    1587358221655 - 1587358187053 = 34602 (bigger than 30s)
Probably, Prometheus discovered new targets around 1587358129 time, which could increase the next scrape interval from 30 seconds to more than 41 seconds. Or the target response was too slow.
BTW, it is possible to look into the same raw data on Prometheus side via query to /api/v1/query?query=q[d] with properly set [d] value and start arg as described in this article.
I noticed an issue with -search.maxLookback and -search.maxStalenessInterval - it looks like these two configs adjust the same value - the maximum lookback interval :( See #209 for details. Merged common code for these flags at fe57d466875d149388d982eb4ce1735e3f574e40 .
I decided adding -search.minStalenessInterval command-line flag in order to handle cases with time series with irregular intervals between samples like in this case. See 9ebc9376859565013451a3e9511f8954ae1f0f4a for details. Try building VictoriaMetrics from this commit according to these docs and verify whether setting -search.minStalenessInterval=60s fixes your issue.
Another workaround, which should work with time series with irregular intervals between samples is to add [60s] to the end of label matchers, i.e. to use the following query in your case:
sum by (container) (container_memory_usage_bytes{job="kubelet", cluster="", namespace="default", pod="filebeat-72npk", container=~"filebeat", container!="POD"}[60s])
Great! It looks like that fixed it! I don't see the gaps anymore after using search.minStalenessInterval=60s
Request to
api/v1/query_range?query=sum%20by(container)%20(container_memory_usage_bytes%7Bjob%3D%22kubelet%22%2C%20cluster%3D%22%22%2C%20namespace%3D%22default%22%2C%20pod%3D%22filebeat-72npk%22%2C%20container%3D~%22filebeat%22%2C%20container!%3D%22POD%22%7D)&start=1587358050&end=1587358260&step=30
now returns:
"values": [
          [
            1587358050,
            "17055744"
          ],
          [
            1587358080,
            "16707584"
          ],
          [
            1587358110,
            "17014784"
          ],
          [
            1587358140,
            "17027072"
          ],
          [
            1587358170,
            "17027072"
          ],
          [
            1587358200,
            "17027072"
          ],
          [
            1587358230,
            "17027072"
          ],
          [
            1587358260,
            "17027072"
          ]
        ]
4:Array[1587358170,1343488] Was missing but It's now in the response when using 9ebc937
IpaliboWhyte
on 20 Apr 2020
Glad to see that -search.minStalenessInterval fixes the issue! Did you try an alternative solution with [60s] in the query when -search.minStalenessInterval isn't set?
sum by (container) (container_memory_usage_bytes{job="kubelet", cluster="", namespace="default", pod="filebeat-72npk", container=~"filebeat", container!="POD"}[60s])
Yep, using [60s] in the label matcher seems to have fixed the gaps without using-search.minStalenessInterval!
I do prefer using -search.minStalenessInterval though, otherwise, I'd need to update all my dashboards 😅
Thank you so much for the quick responses! Let me know if you need anything else 🙂. In the meantime, I'll continue to run v1.34.9 until -search.minStalenessInterval is available 🙌
IpaliboWhyte
on 20 Apr 2020
The -search.minStalenessInterval flag is available in VictoriaMetrics starting from v1.35.0.
Closing the issue as fixed.
valyala
on 28 Apr 2020
Awesome! It looks like v1.35.0. has not yet been published to docker hub? :) I see the change now, works great, Thanks! 🙌🙌
IpaliboWhyte
on 28 Apr 2020
Related issues
 oOHenry
·
4Comments
oOHenry
·
4Comments
 WilliamDahlen
·
3Comments
WilliamDahlen
·
3Comments
 n4mine
·
3Comments
n4mine
·
3Comments
 ozn0417
·
3Comments
ozn0417
·
3Comments
 genericgithubuser
·
4Comments
genericgithubuser
·
4Comments