Victoriametrics: Failed to get some metrics after update
Describe the bug
I was doing versions update both for Prometheus(from 2.10.0 to 2.15.2) and VictoriaMetrics(from 1.28.3 to 1.32.0). Prometheus update was done first, VictoriaMetrics next to it.
Everything was looking fine, but later I noticed that some metrics stopped to be updated. The problem appeared right after the update.
It was not possible to get new data for some metrics. Most of the metrics were working fine, but some of them stopped receive new data points. The first screenshot should help to understand the problem.
At the same time, it was possible to receive the missing data from Prometheus, but VictoriaMetrics was not returning it for some reason.
Versions downgrade(both Prometheus and VictoriaMetrics) didn't help.
The problem was not related to any specific metric. The same metrics with different labels were not accessible, meanwhile, the same metric with other labels was available.
Let's say system_uptime{host="host4"} stopped to be updated, but other hosts(like system_uptime{host="host5"}) were receiving updates.
Added another VictoriaMetrics container with the same configuration. New VictoriaMetrics was receiving all data points with no issue. At the same moment, old VictoriaMetrics was keeping the problem.
-search.disableCache flag didn't change anything.
After some investigation found that export endpoint returns datapoints that is missing on normal query:
http://localhost:8428/api/v1/export -d 'match[]=system_uptime{instance="grafana.host”}'
Another note, If adding time filter to export endpoint VictoriaMetrics does not return data points after update. Last data point is 01/09/2020 @ 8:28am (UTC) (update time)
curl http://localhost:8428/api/v1/export?start=2020-01-08T10:00:00.000Z -d 'match[]=system_uptime{instance=“grafana.host”}’
Without time filter last data point is 01/09/2020 @ 11:36am (UTC) (current time)
curl http://localhost:8428/api/v1/export -d 'match[]=system_uptime{instance=“grafana.host”}’
Doing export+import adds missing data point, but the problem persists, new data points from Prometheus is not coming for broken metrics.
Logs both for Prometheus and VictoriaMetrics didn't show any error or problem for me.
To Reproduce
I didn't find a way to reproduce the problem.
Expected behavior
All metrics keep working as before the update. 👀
Screenshots


Version
docker container victoriametrics/victoria-metrics:v1.32.0
docker container prom/prometheus:v2.15.2
Additional context
I have resolved the problem for me by installing another VictoriaMetrics container beside broken. Exported data from broken container and imported to the new one. And keep using the new instance with no problem.
Unfortunately, I cannot share the data from the broken instance, but still keeping it. Let me know if any assistance required from me for debugging. I can perform the required tests and give information to you if it will not expose private information.
 soffokl
All 9 comments
it seems I have encountered similiar problems when upgrade from v1.28.0 to v1.31.5,but downgrade is ok.
 davidsome
on 17 Jan 2020
davidsome
on 17 Jan 2020
This can be related to cache issues during the upgrade. Try stopping old VictoriaMetrics, deleting <-storageDataPath>/cache folder and starting it again.
Another note, If adding time filter to export endpoint VictoriaMetrics does not return data points after update
This could be related to per-day inverted index, which has been added in v1.29.0. Probably there are issues with queries for date range covering the upgrade day. Wait for a day after the upgrade, then remove cache folder while VictoriaMetrics is stopped and see whether the issue still persists for newly added data.
Also check for errors in both VictoriaMetrics and Prometheus logs. Probably a part of metrics fail to be written due to various reasons.
 valyala
on 17 Jan 2020
valyala
on 17 Jan 2020
There are a couple of days passed since I moved to the new VictoriaMetrics container.
Cleaned up <-storageDataPath>/cache directory and started the service again. It helped and now I can observe all metrics as before.
I was trying to start VictoriaMetrics with a -search.disableCache flag and this did not work for me on the day of upgrade.
Does this flag do something different comparing to <-storageDataPath>/cache removal or my problem was related to the per-day inverted index?
soffokl
on 18 Jan 2020
Does this flag do something different comparing to <-storageDataPath>/cache removal or my problem was related to the per-day inverted index?
The flag -search.disableCache disables only a single type of cache, which is used for caching query responses. VictoriaMetrics contains many other cache types, which are persisted at cache folder under -storageDataPath directory.
It looks like your issue was related to bad interaction of per-day inverted index with other cache type than the response cache, which can be disabled with -search.disableCache.
valyala
on 21 Jan 2020
Had similar issue after restarting vmstorage in cluster version (v1.31.5) several days ago. Some metrics with particular label disappeared in VictoriaMetrics, however was available in Prometheus. Upgrading to v1.32.6 didn't solve the issue, but removing -storageDataPath/cache directory at all vmstorage nodes helped.
 pavdmyt
on 24 Jan 2020
pavdmyt
on 24 Jan 2020
@pavdmyt , thanks for the information. The issue is still under investigation. If somebody encounters something similar again, then it would be great posting here with some details. It looks like the issue is related to VictoriaMetrics upgrades. VictoriaMetrics introduced per-day inverted index in v1.29.0, which could result in missing time series on the upgrade day if the upgrade is performed from the version below v1.29.0 to any newer version. The issue should automatically disappear on the next day after the upgrade.
valyala
on 10 Feb 2020
@valyala hi, just had to deal with something like this (on version 1.33.1). Metrics from a single service were not displayed from Victoria, yet they were definitely collected by prometheus. See screenshots, query to filter out every other but the impacted service.
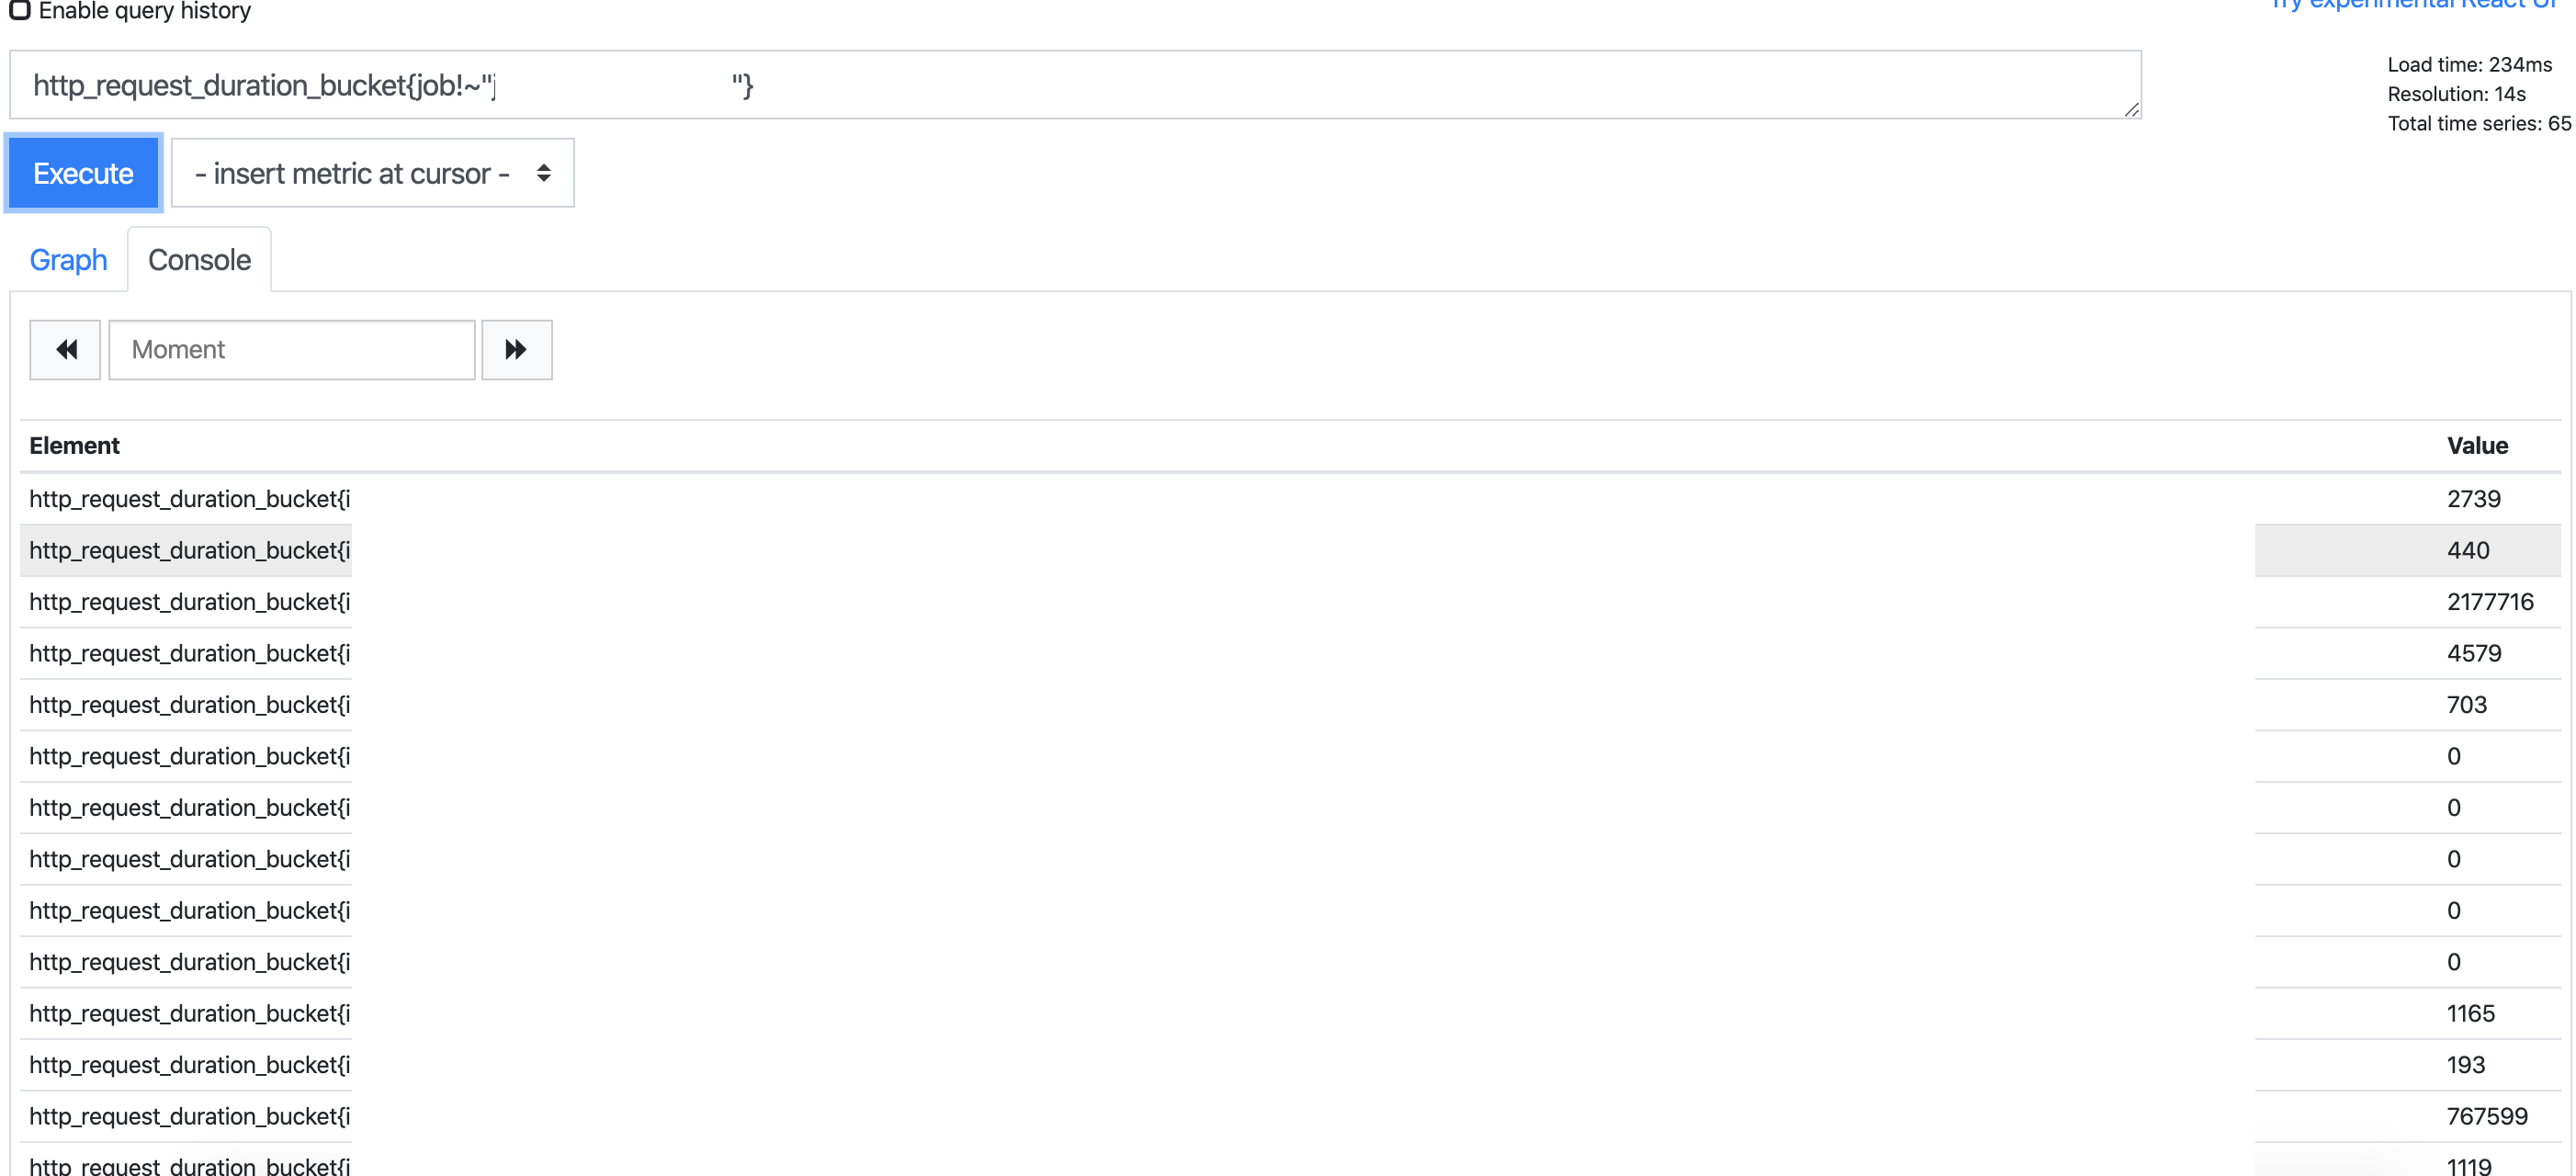
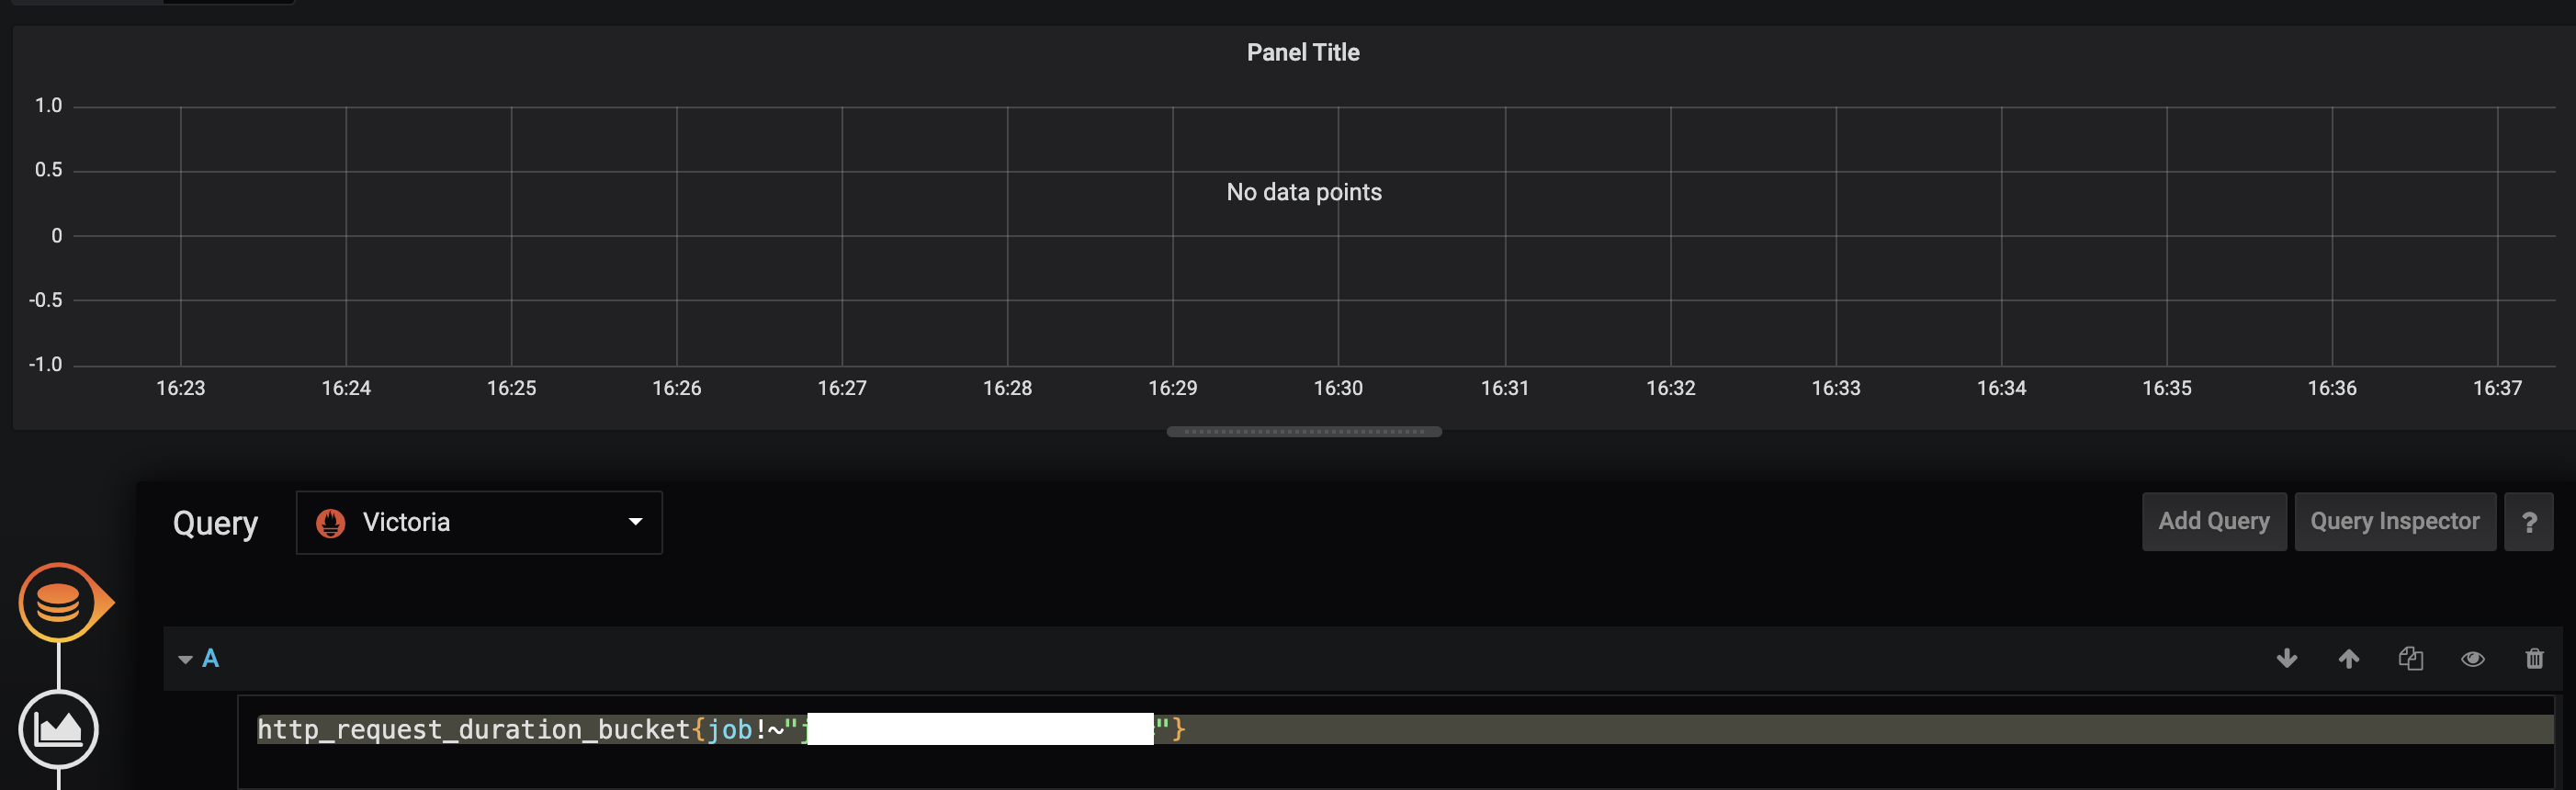 Requests to api with curl met the same results.
I initially upgraded to newest version, to see if it helps, but it didn't solve the issue. Then I found this thread and tried deleting /cache That did indeed solved the problem and showed that the service metrics were stored - displayed 90 days back with no missing points.
I've anonymised the screens but should you have specific questions about the metrics involved, I'll try to provide best answers I can.
 ZVilusinsky
on 20 Mar 2020
ZVilusinsky
on 20 Mar 2020
It would be nice if there would be a way to drop the cache programmatically or via an argument. We are running VM in Kubernetes and the image does not have a shell to exec and manually delete the folder. I can't think of a way to achieve this other then mounting the pvc in a temporary pod.
 acondrat
on 24 Apr 2020
acondrat
on 24 Apr 2020
@acondrat , the cache can be dropped programmatically by requesting /internal/resetRollupResultCache. See https://github.com/VictoriaMetrics/VictoriaMetrics/blob/master/README.md#troubleshooting for details.
valyala
on 24 Apr 2020
Related issues
 oOHenry
·
4Comments
oOHenry
·
4Comments
 Serrvosky
·
3Comments
Serrvosky
·
3Comments
 v98765
·
3Comments
v98765
·
3Comments
 pmitra43
·
3Comments
pmitra43
·
3Comments
 localpref
·
3Comments
localpref
·
3Comments