Victoriametrics: When I stopped one of the vmstorage services, I lost part of the data
When I stopped one of the vmstorage services, I lost part of the data. How can I set up a cluster so as not to lose data when one of the cluster nodes is unavailable?
 NikolayShama
All 25 comments
Hi,
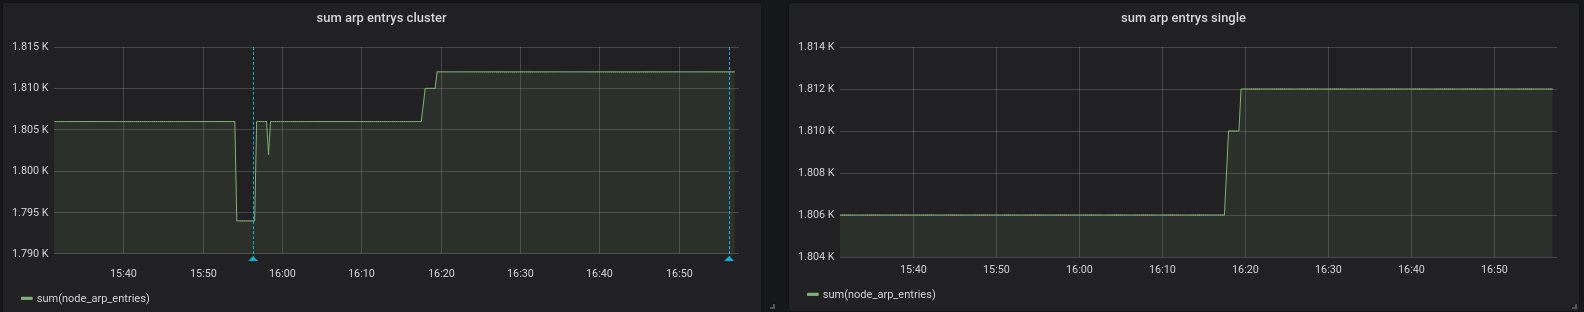
I am having the same problem, I stopped one node of my vm cluster for ~1 hour:
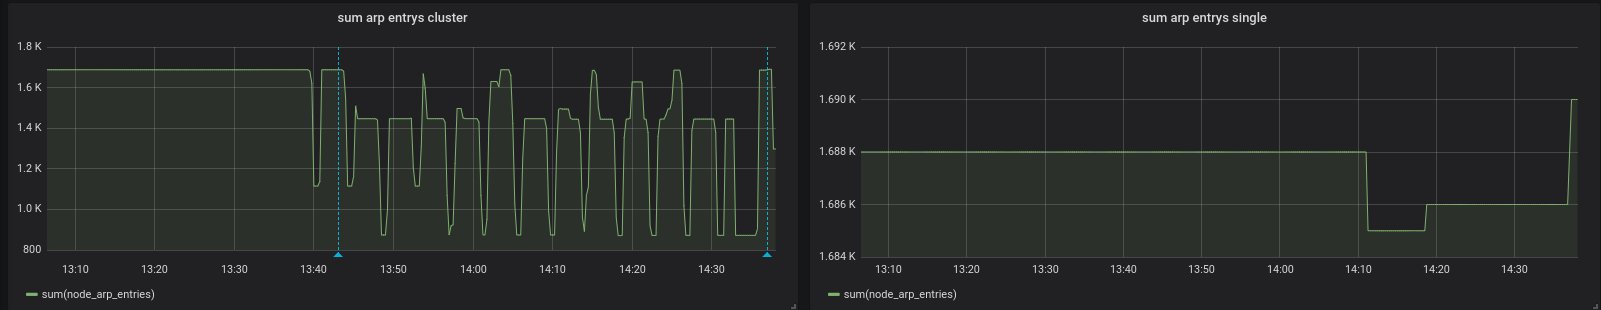
On the left my vm cluster, on the right graph my single node.
Versions:
- vmstorage-20190725-091741-heads-cluster-0-gf2e8d54
- vminsert-20190725-091733-heads-cluster-0-gf2e8d54
- vmselect-20190725-091738-heads-cluster-0-gf2e8d54
 oOHenry
on 29 Jul 2019
oOHenry
on 29 Jul 2019
When I stopped one of the vmstorage services, I lost part of the data. How can I set up a cluster so as not to lose data when one of the cluster nodes is unavailable?
Each vmstorage node owns a part of data. If vmstorage node becomes unavailable, the data stored on it also becomes unavailable until the vmstorage node returns to the cluster. vmselect returns partial data if at least a single vmstorage node is unavailable. See https://github.com/VictoriaMetrics/VictoriaMetrics/blob/cluster/README.md#replication-and-data-safety .
Newly written data shouldn't be lost if at least a single vmstorage node remains available. vminsert re-routes incoming data to the remaining healthy vmstorage nodes while certain vmstorage nodes are unavailable. See https://github.com/VictoriaMetrics/VictoriaMetrics/blob/cluster/README.md#cluster-availability .
Let's narrow down your issue by answering the following questions:
- Do you see the lost data after returning the stopped
vmstoragenode to the cluster? The lost data must return back after returning back the stoppedvmstoragenode. - Did you delete the data pointed by
-storageDataPathon the stoppedvmstoragenode? The data is lost if deleted, since VictoriaMetrics cluster doesn't replicate data owned byvmstoragenodes. - How did you stop
vmstoragenode? The proper approach is to sendSIGINTsignal tovmstoragenode. Otherwise a few seconds of recent data may be lost. - Did you update
-storageNodeargs in the remainingvmselectandvminsertnodes after stoppingvmstoragenode?-storageNodeargs in all thevmselectandvminsertnodes of the cluster must contain the same set ofvmstoragenodes, including temporarily unavailable nodes.
 valyala
on 29 Jul 2019
valyala
on 29 Jul 2019
I am having the same problem, I stopped one node of my vm cluster for ~1 hour
@oOHenry , thanks for the graphs! Could you answer the following questions:
- How many
vmstoragenodes does your cluster have? - Did you return
vmstoragenode to the cluster when capturing these graphs? - When
vmstoragenode was stopped - before 13:40 or after 14:50?
See also my message above explaining how data is spread among vmstorage nodes in the cluster.
valyala
on 29 Jul 2019
How many vmstorage nodes does your cluster have?
I have 3 vmstorage nodes
Did you return vmstorage node to the cluster when capturing these graphs?
yes, when I captured the graph all nodes where online
When vmstorage node was stopped - before 13:40 or after 14:50?
The node was offline between the two grafana annotations(first picture, first graph) ~ from 13:42 till 14:38
vmstorage was stopped by SIGINT signal
oOHenry
on 29 Jul 2019
Thanks for details, @oOHenry . This looks like a bug in the cluster implementation. Will notify you with findings.
valyala
on 29 Jul 2019
@NikolayShama , @oOHenry , could you look into error logs on all the vminsert nodes when vmstorage node was unavailable and post these errors here? It would be great if error logs for the remaining vmstorage nodes would be posted too.
Additionally, could you provide output for the following command executed against every vminsert node:
curl -s http://<vminsert-host>:8480/metrics | grep reroute
curl -s http://<vminsert-host>:8480/metrics | grep rows_lost
curl -s http://<vminsert-host>:8480/metrics | grep rows_sent
curl -s http://<vminsert-host>:8480/metrics | grep rows_pushed
I found nothing in my logfiles
Metrics:
vm_rpc_reroute_errors_total{name="vminsert"} 0
vm_rpc_rerouted_buf_overflows_total{name="vminsert"} 0
vm_rpc_rerouted_buf_pending_bytes{name="vminsert"} 0
vm_rpc_rerouted_rows_pending{name="vminsert"} 0
vm_rpc_rerouted_rows_processed_total{name="vminsert"} 22465736
vm_rpc_reroutes_total{name="vminsert"} 14772
vm_rpc_rows_rerouted_from_here_total{name="vminsert", addr="node01.server.lan:8400"} 3366
vm_rpc_rows_rerouted_from_here_total{name="vminsert", addr="node02.server.lan:8400"} 22425621
vm_rpc_rows_rerouted_from_here_total{name="vminsert", addr="node03.server.lan:8400"} 6646
vm_rpc_rows_rerouted_to_here_total{name="vminsert", addr="node01.server.lan:8400"} 11195732
vm_rpc_rows_rerouted_to_here_total{name="vminsert", addr="node02.server.lan:8400"} 13891
vm_rpc_rows_rerouted_to_here_total{name="vminsert", addr="node03.server.lan:8400"} 11256113
vm_rpc_rows_lost_total{name="vminsert"} 0
vm_rpc_rows_sent_total{name="vminsert", addr="node01.server.lan:8400"} 270046008
vm_rpc_rows_sent_total{name="vminsert", addr="node02.server.lan:8400"} 236511582
vm_rpc_rows_sent_total{name="vminsert", addr="node03.server.lan:8400"} 270581924
vm_rpc_rows_pushed_total{name="vminsert", addr="node01.server.lan:8400"} 258933761
vm_rpc_rows_pushed_total{name="vminsert", addr="node02.server.lan:8400"} 259003168
vm_rpc_rows_pushed_total{name="vminsert", addr="node03.server.lan:8400"} 259402585
I just looked at my test dashboard, I think my cluster is in a strange state now:
Edit:
If I zoom in it looks normal:
oOHenry
on 29 Jul 2019
This may be related to issues in response cache. Try disabling the response cache with -search.disableCache command-line argument passed to vmselect and check whether the issue is reproduced.
valyala
on 30 Jul 2019
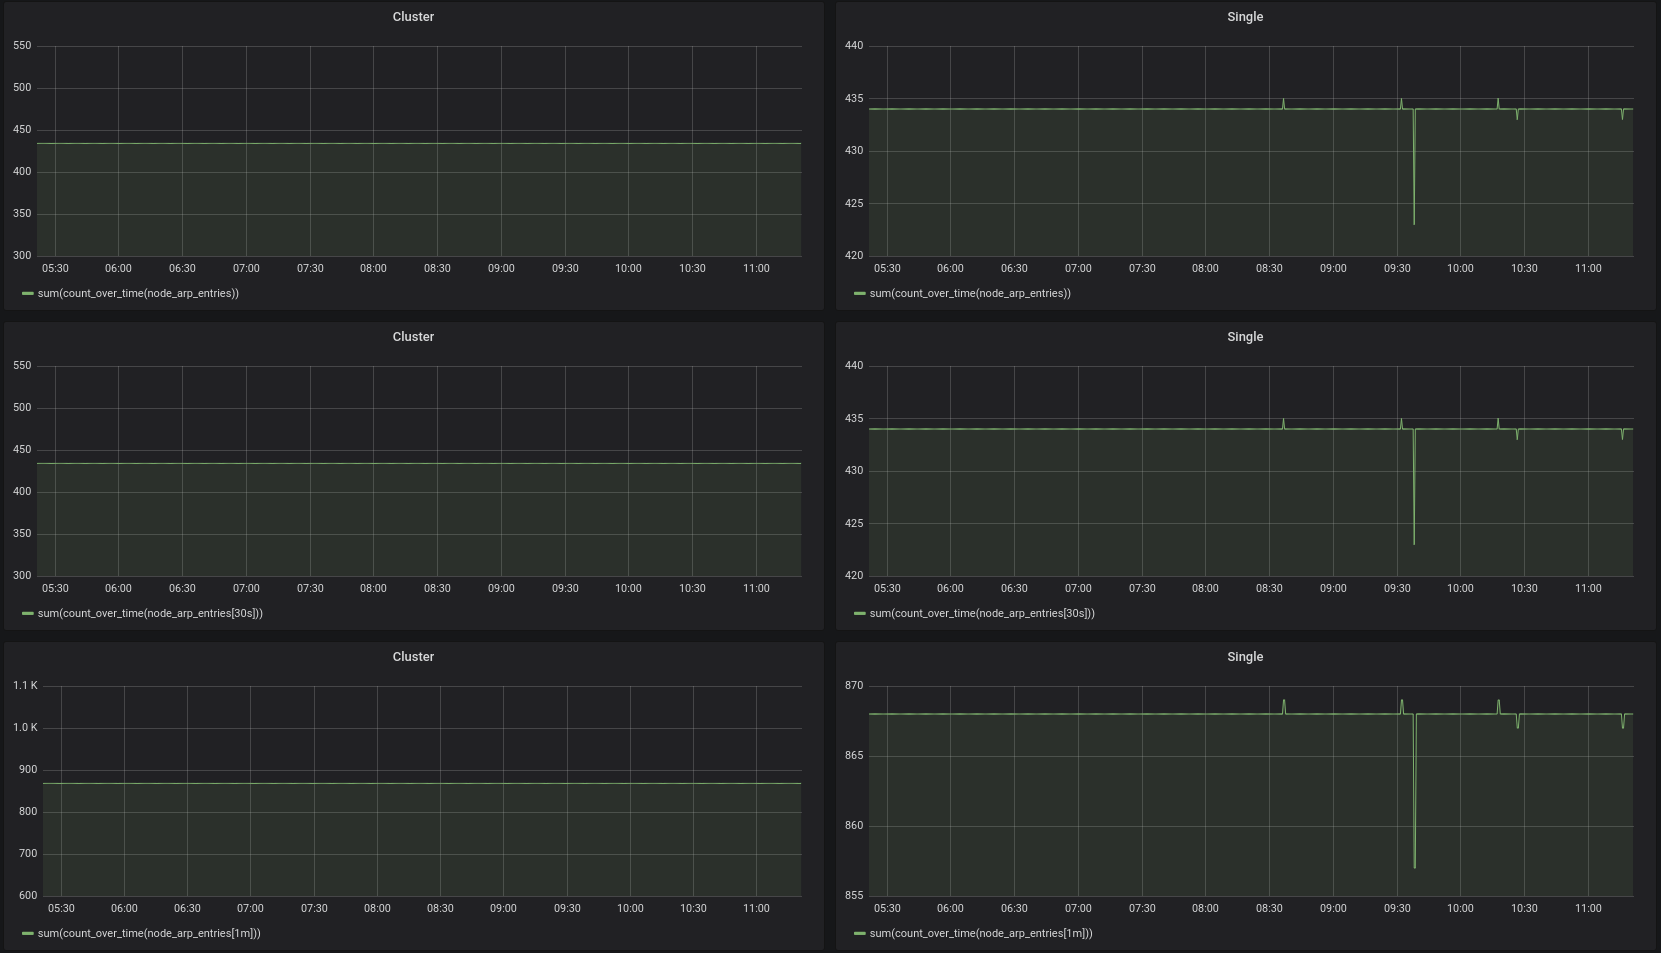
@valyala set -search.disableCache brought no improvement. I found out when I set the grafana min step parameter to 30s the spikes occur, but when I set it to 1m they are gone.
oOHenry
on 30 Jul 2019
@oOHenry , thanks for the valuable update. Could you build VictoriaMetrics cluster components from the commit b9a16b93e7a95fb5c1966191b4d7d1689cb4a75d and verify whether the issue is gone? See instructions on how to build cluster components from sources.
valyala
on 30 Jul 2019
@oOHenry , could you verify whether the issue is fixed in v1.23.1? The corresponding docker images for cluster version are published on docker hub under vminsert, vmselect and vmstorage names with v1.23.1-cluster tag.
valyala
on 31 Jul 2019
The gaps I showed in https://github.com/VictoriaMetrics/VictoriaMetrics/issues/134#issuecomment-516149519, are gone thanks for this :). But I'm about to repeat my tests(restarting nodes)
I keep you updated.
oOHenry
on 31 Jul 2019
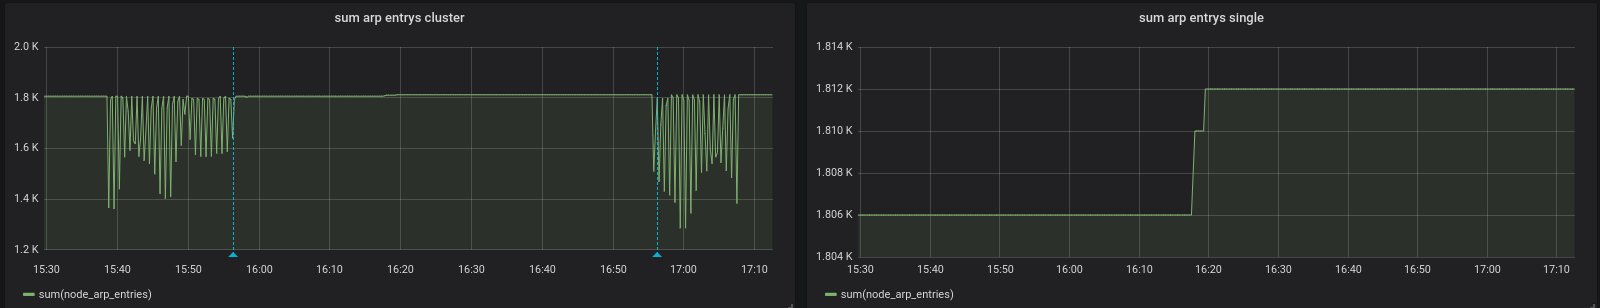
@valyala I finished my test, seems that I've lost a few metrics while stopping:
Stop signal in my systemd unit:
ExecStop=/bin/kill -s SIGTERM $MAINPID
The nodes where offline between the blue lines in the graph, but all online when I took the screenshot.
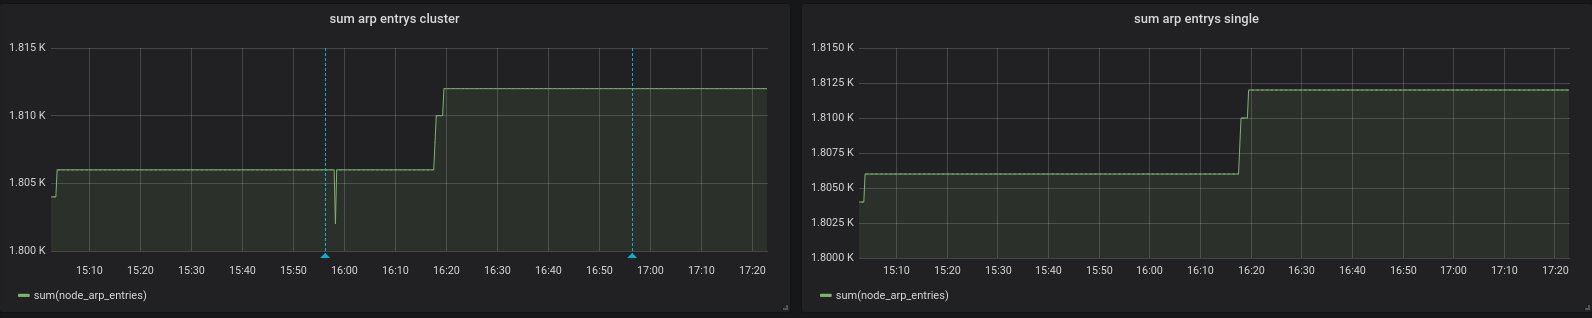
EDIT: ok now it looks strange again:
oOHenry
on 31 Jul 2019
Now it looks different again:
oOHenry
on 31 Jul 2019
@oOHenry , could you answer the following questions?
- Which protocol is used for writing data into VictoriaMetrics - Prometheus remote_write API, Influx line protocol, Graphite or OpenTSDB?
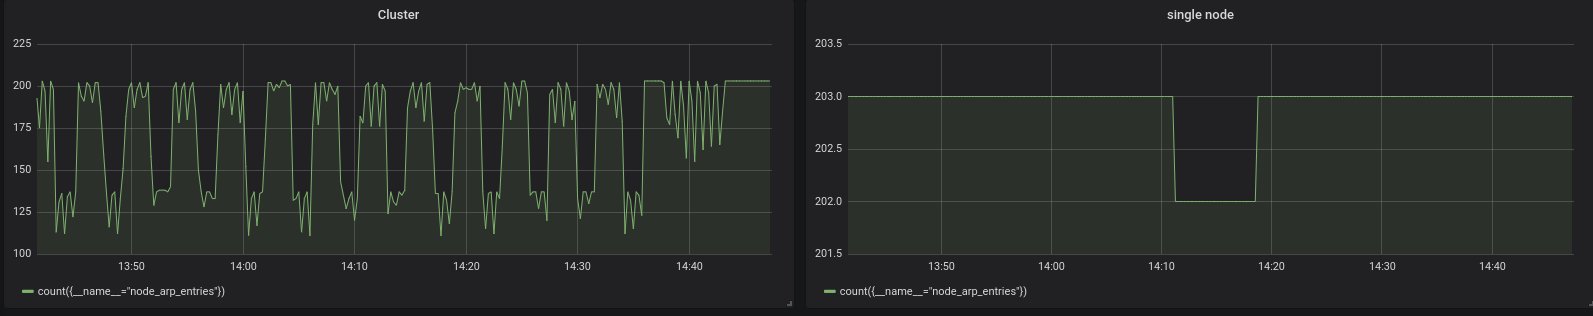
- Could you show graphs for the following queries on the same time range as above?
sum(count_over_time(node_arp_entries))
sum(count_over_time(node_arp_entries[30s]))
sum(count_over_time(node_arp_entries[1m]))
sum(count_over_time(node_arp_entries[2m]))
valyala
on 31 Jul 2019
@valyala I'm using the prometheus remote_write API.
oOHenry
on 1 Aug 2019
Just to clarify:
- Graphs on the left side are from cluster version, while graphs on the right side are from single-node version of VictoriaMetrics?
- Prometheus config contains two
urlvalues inremote_writesection - one for cluster version and another one for single-node version?
count_over_time graphs for cluster version look suspicious even outside the time range when vmstorage node was offline. Could you post graphs for the following queries on the same time range?
count(node_arp_entries)
sum(count_over_time(node_arp_entries)) / count(node_arp_entries)
Also could you build cluster components from ade7bc30dbef6b04ce54c726e3d8bd01bdbd2989 ? I tried fixing an issue, which could result in incorrect graphs when scrape interval between data points has high jitter.
valyala
on 1 Aug 2019
Hi @valyala,
I updated my whole cluster with the newest commit of cluster branch.
Graphs on the left side are from cluster version, while graphs on the right side are from single-node version of VictoriaMetrics?
Exactly
Prometheus config contains two url values in remote_write section - one for cluster version and another one for single-node version?
Yes. My prometheus scrape interval is 15 sec by the way.
All graphs were captured in the same time range as the others above:
oOHenry
on 2 Aug 2019
@oOHenry , the issue could be related to https://github.com/VictoriaMetrics/VictoriaMetrics/issues/139 , where VictoriaMetrics may return graphs with gaps in the face of high jitter for scrape interval for the collected time series data.
The issue must be fixed in v1.24.0 and the corresponding v1.24.0-cluster tag for cluster components for docker images. Could you verify this release?
valyala
on 4 Aug 2019
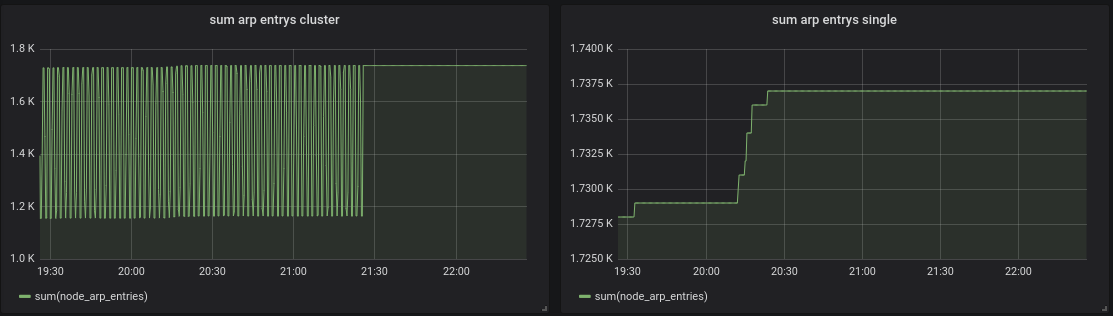
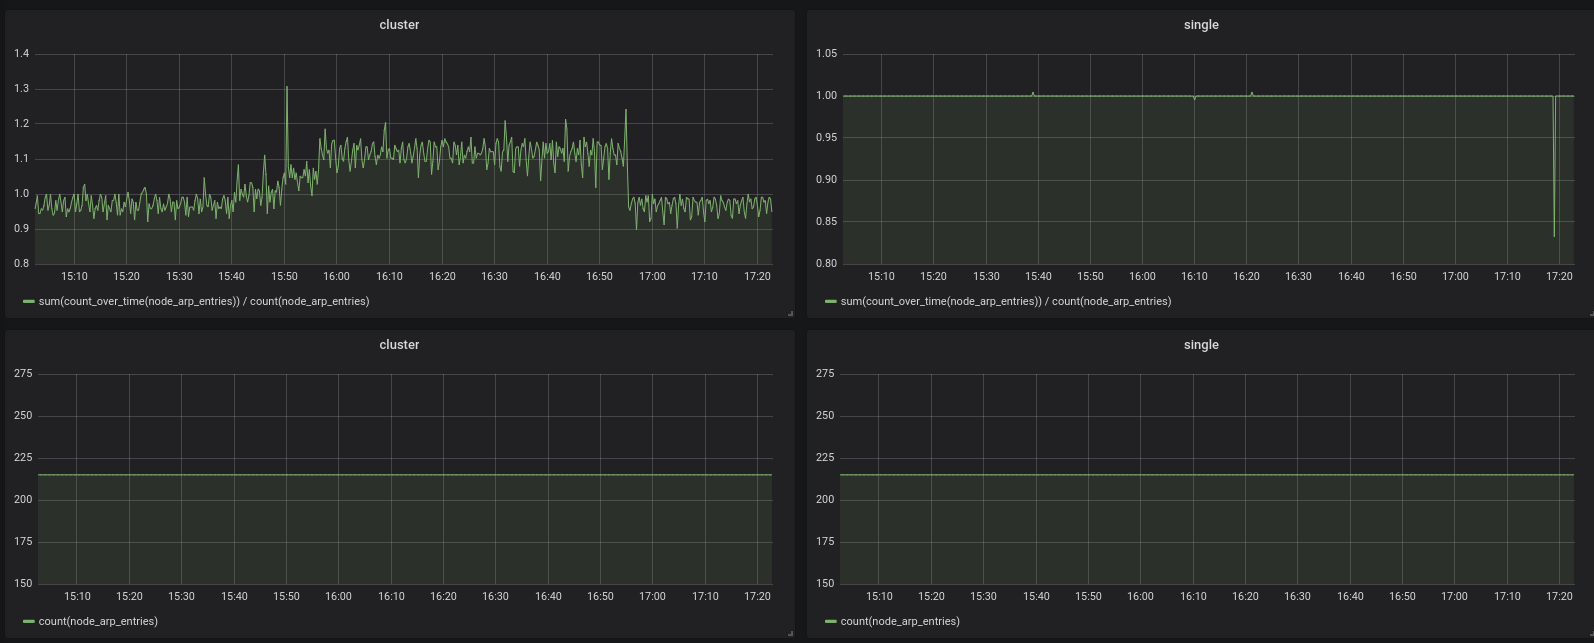
@valyala, today I updated my cluster to 1.24.0 and repeated my tests, I had no data lost while stopping a node :)
Compared to the single node the count_over_time querys still look a little bit unhealthy:

Many thanks for your effort.
oOHenry
on 5 Aug 2019
I'm investigating count_over_time issue for cluster version of VictoriaMetrics. I'll post findings here.
valyala
on 7 Aug 2019
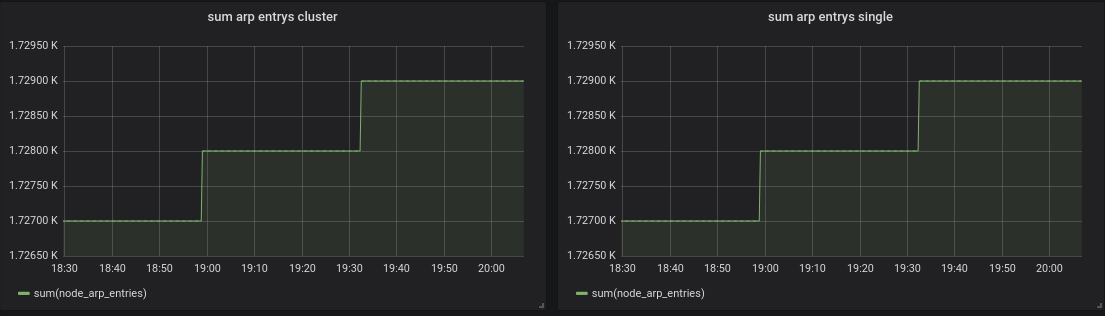
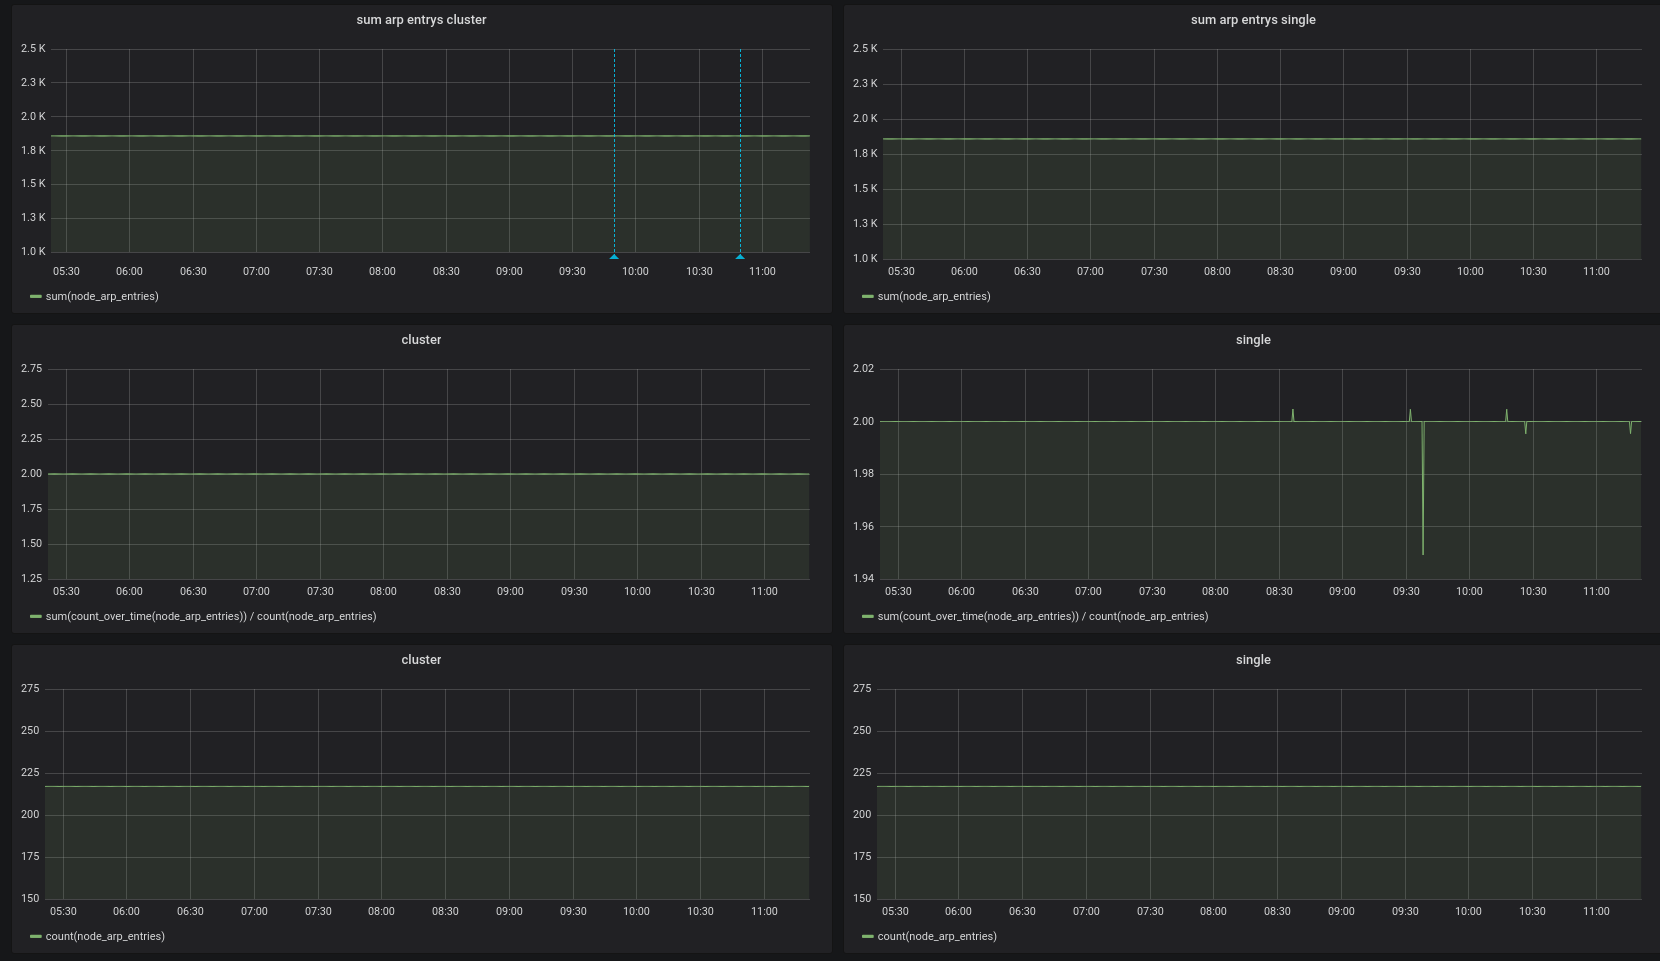
@valyala I updated my cluster to v1.24.1 and repeated my tests. I think it looks good now:
oOHenry
on 7 Aug 2019
I updated my cluster to v1.24.1 and repeated my tests. I think it looks good now
OK, then closing the issue.
valyala
on 14 Aug 2019
Related issues
 abualy
·
3Comments
abualy
·
3Comments
 prdatur
·
3Comments
oOHenry
·
4Comments
prdatur
·
3Comments
oOHenry
·
4Comments
 localpref
·
3Comments
localpref
·
3Comments
 n4mine
·
3Comments
n4mine
·
3Comments
Most helpful comment
@valyala, today I updated my cluster to 1.24.0 and repeated my tests, I had no data lost while stopping a node :)
Compared to the single node the
count_over_timequerys still look a little bit unhealthy:Many thanks for your effort.