Victoriametrics: Victoria Cluster loss some data
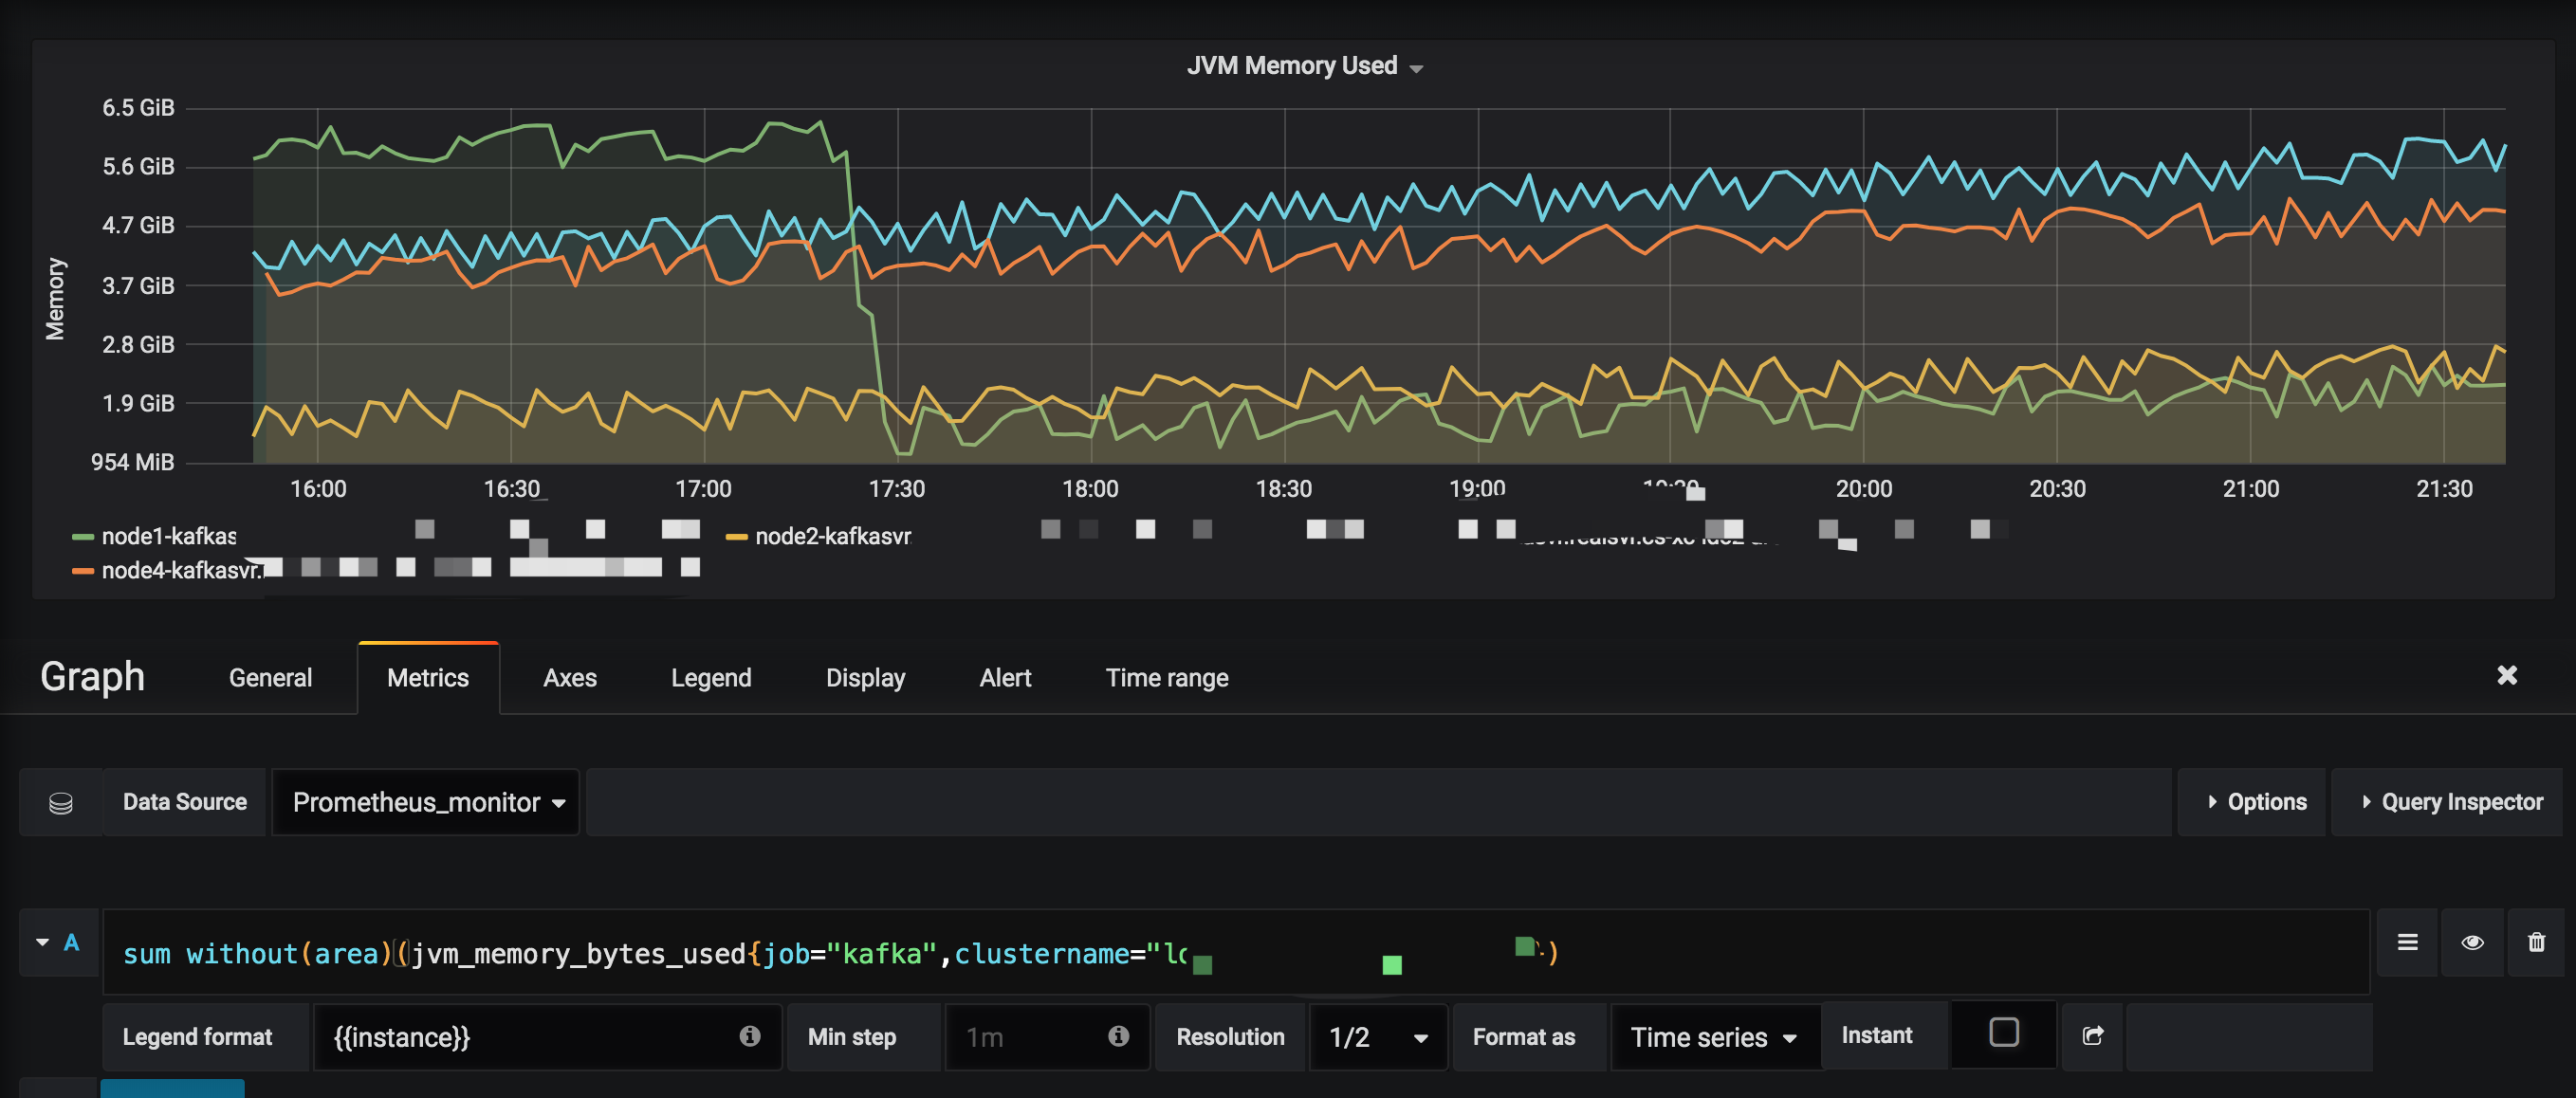
Below picture is used Prometheus Source,query result is ok;
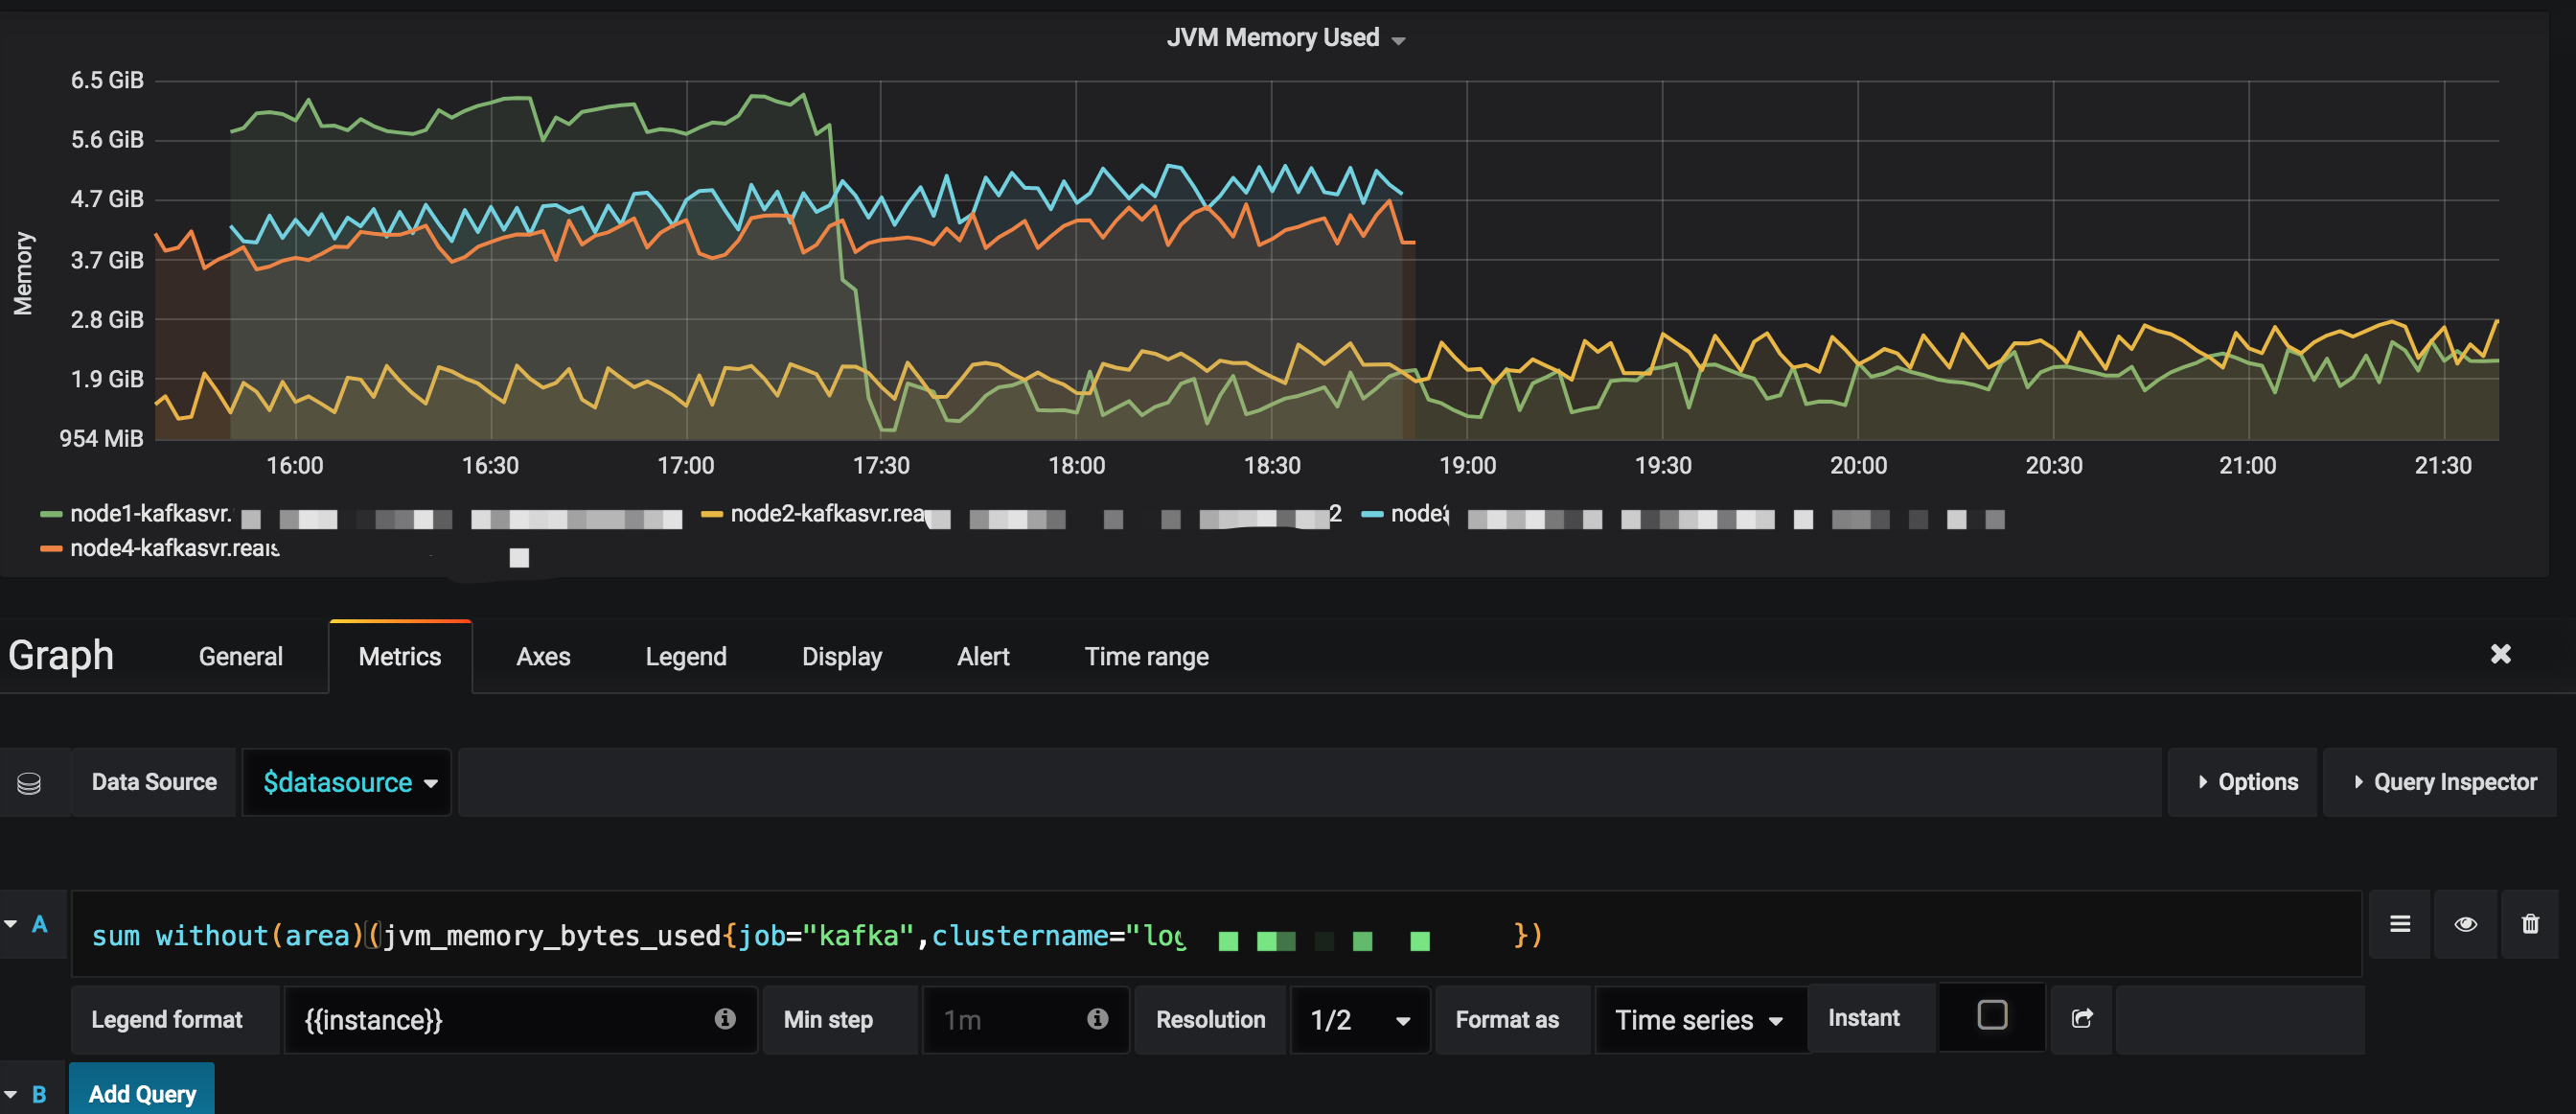
Below picture is used VictoriaMetrics Source,query result is loss data;
 vipsql
All 6 comments
This may be related to response caching, which doesn't play nicely with data back-filling, i.e. when data with old timestamps is written into the db while it is queried. Try zooming and scrolling the graph and see whether it is displayed correctly. If it is displayed correctly on different zoom levels then the issue is in the response cache. The issue may be fixed by disabling the response cache with -search.disableCache command-line flag for vmselect nodes during data back-filling. Then the cache may be enabled again.
If the issue persists after disabling response cache, then it should be nailed down further. Try the following steps:
- Check for error logs on
Prometheusinstances and onvminsertnodes. Probably certain instances stopped writing data to VictoriaMetrics cluster due to some errors. - Check for error logs in
vmselectandvmstoragenodes. These logs may contain more info about the issue. - Check for
vm_partial_search_results_totalmetric on the/metricspage for eachvmselectnode. If this metric is greater than 0, then some ofvmstoragenodes were unavailable during the query. - Try sending requests from Grafana directly to
vmselectnode without intermediate proxies such aspromxy. If graphs are correct, then the problem is in the proxy. - Make sure you didn't delete any metrics on VictoraMetrics via delete API.
 valyala
on 25 Jun 2019
valyala
on 25 Jun 2019
@valyala thanks
1.I checked my prometheus vminsert vmstoreage vmselect logs, not find error log;
2.I restart my prometheus server, the problem as before;
3.I put the a new prometheus server,and move the scape_endpoint to it; the problem solved;
by the way, my prometheus server is heavy scape, probable it prometheus remote_write modules bugs
vipsql
on 26 Jun 2019
I put the a new prometheus server,and move the scape_endpoint to it; the problem solved;
by the way, my prometheus server is heavy scape, probable it prometheus remote_write modules bugs
Which Prometheus version do you use? Prometheus versions before v2.10.0 had some issues with remote_write. Also it is recommended using the following remote_write -> queue_config settings in Prometheus, since default values are sub-optimal for high volumes of scraped data:
remote_write:
  - url: <victoriametrics_remote_write_endpoint>
    queue_config:
      max_samples_per_send: 10000
      max_shards: 100
@valyala thanks, My Prometheus Server Old Version is v2.8.0; and today,i already replace v2.8.0 to v2.10.0; the problem solved!!
the VictoriaMetrics Wiki can suggest other users to use Prometheus V2.10.0 or Over!
vipsql
on 26 Jun 2019
the VictoriaMetrics Wiki can suggest other users to use Prometheus V2.10.0 or Over!
Just added the suggestion in the commit 0c8d4633076484a0f1998a4708a5c2f658489703
valyala
on 26 Jun 2019
Then closing the issue, since it looks like Prometheus was responsible for the missing data.
@vipsql , feel free re-opening the issue if it will appear again.
valyala
on 26 Jun 2019
Related issues
 Serrvosky
·
3Comments
Serrvosky
·
3Comments
 v98765
·
3Comments
v98765
·
3Comments
 n4mine
·
3Comments
n4mine
·
3Comments
 abualy
·
3Comments
abualy
·
3Comments
 WilliamDahlen
·
3Comments
WilliamDahlen
·
3Comments