Vedo: setting title and color bar, directed graph
Hi @marcomusy
This is a follow up to my question on SO. I'd like to ask for clarification on the following,
I'd like to know how to assign symbols in
titleof a scalarbar. Latex formatting doesn't work
e.g.
nx_pts.pointColors(vals, cmap='YlGn', vmin=min(vals), vmax=max(vals)).addScalarBar(title='$\mu$')How can we set titles for plot? I tried,
show(nx_pts, nx_edg, nx_pts.labels('id'), interactive=True, bg='black', title='plot')
this doesn't display the title.Is it possible to create discontinuous color bars? For example, while trying to assign the following set of values that contains
an outlier
vals = [100, .80, .10, .79, .70, .60, .75, .78, .65, .90]
all entries, except 100, are assigned the same color.
Please find the complete code below,
import networkx as nx
from vedo import *

G = nx.gnm_random_graph(n=10, m=15, seed=1)
nxpos = nx.spring_layout(G)
nxpts = [nxpos[pt] for pt in sorted(nxpos)]

nx_lines = []
for i, j in G.edges():
    p1 = nxpos[i].tolist() + [0]  # add z-coord
    p2 = nxpos[j].tolist() + [0]
    nx_lines.append([p1, p2])

nx_pts = Points(nxpts, r=12)
nx_edg = Lines(nx_lines).lw(2)

# node values
vals = [100, .80, .10, .79, .70, .60, .75, .78, .65, .90]
nx_pts.pointColors(vals, cmap='YlGn', vmin=min(vals), vmax=max(vals)).addScalarBar(title='$\mu$')
show(nx_pts, nx_edg, nx_pts.labels('id'), interactive=True, bg='black', title='plot')
How to convert the above graph,
G, to a directed graph? From the suggestion offered on SO, I could use
g = DirectedGraph(layout='fast2d')I am not sure how to add edges
ed_ls = [(0, 6), (0, 7), (0, 5), (8, 0), (0, 4), (1, 4), (1, 7), (1, 9), (2, 9), (3, 6), (3, 4), (8, 3), (3, 5), (3, 7), (6, 9)]
for each item ined_ls, e.g. (0,6) the edge is directed from 0 to 6.
Thanks a lot
 DeepaMahm
All 38 comments
Hi, I'm actually implementing some/most of these features - and will be available over the weekend in a new release.
 marcomusy
on 24 Jul 2020
marcomusy
on 24 Jul 2020
@macromusy Thanks a lot. I look forward to use these features
DeepaMahm
on 24 Jul 2020
Hi please type:
pip install -U git+https://github.com/marcomusy/vedo.git
to upgrade vedo to the master version.
then:
import networkx as nx
from vedo import *

G = nx.gnm_random_graph(n=10, m=15, seed=1)
nxpts = nx.spring_layout(G)
nxpts = [nxpts[pt] for pt in sorted(nxpts)]

nx_lines = [ (nxpts[i], nxpts[j]) for i, j in G.edges()]

nx_pts = Points(nxpts, r=12)
nx_edg = Lines(nx_lines).lw(2).color("grey")

# node values
vals = [100, 80, 10, 79, 70, 60, 75, 78, 65, 90]

# manually build a lookup table for mapping colors
#             value,  color,  alpha
lut = makeLUT([
               ( 80, 'green', 0.8),
               (100, 'red'  , 1.0),
              ],
              vmin=min(vals), vmax=max(vals),
             )

nx_pts.cmap(lut, vals)
sb = nx_pts.addScalarBar3D(title='μ - parameter',
                           titleFont='BPmonoItalics',
                           labelFont='Quikhand',
                           c='white')
sb.addPos(0.1,0,0).scale(0.9).useBounds()

#labs = nx_pts.labels(scale=.03, font='Quikhand', c='w').addPos(0.05,0,0)
labs = nx_pts.labels('id', scale=.04, font='Quikhand', c='w').addPos(0.05,0,0)

# make a plot title
x0, x1 = nx_pts.xbounds()
y0, y1 = nx_pts.ybounds()
t = Text('My μ^3_ω  Graph', font='BPmonoItalics', justify='center', s=.07, c='lb')
t.pos((x0+x1)/2, y1*1.4)

show(nx_pts, nx_edg, labs, t, bg='black')
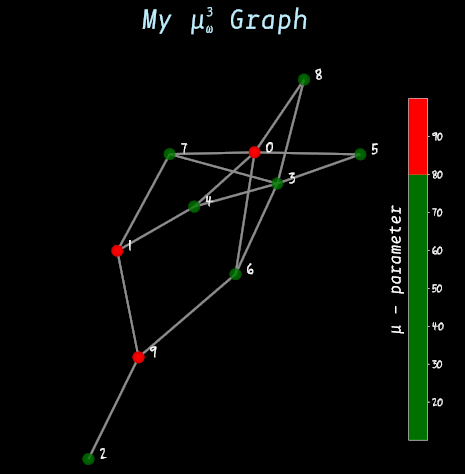
note that latex is not supported, but you can still write basic formulas and expressions using unicode characters.
Typevedo -r fontsto dump the available unicode chars that one can cut and paste directly in the python code.
Also,pointColors()is now obsolete, and can be substituted bycmap()show(.., title="") only changes the wondow bar title ( and does nothing on windows systems). See above example how to add 3d text to a scene.
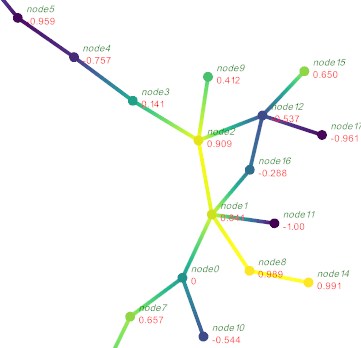
3,4. use addEdge(i,j) run the built-in example, type:
vedo -ir network
marcomusy
on 27 Jul 2020
@marcomusy Thank you very much! I will follow the example and try out directed graph
DeepaMahm
on 27 Jul 2020
Hi @marcomusy
- I tried the following to create directed graph
"""Visualize a 2D/3D network and its properties"""
# (see also example: lineage_graph.py)
from vedo import Points, show, sin
from vedo.pyplot import DirectedGraph

g = DirectedGraph(layout='fast2d')
import networkx
G = networkx.gnm_random_graph(n=5, m=10)
G = G.to_directed()

xyz = [[-8.0549889e+00, -2.0835102e+01,  1.5651123e-15],
        [-5.2478175e+00, -2.0856216e+01,  1.9114774e-15],
        [-1.0559845e+01, -1.9786411e+01,  1.1299285e-15],
        [8.1267099e+00, - 2.1688789e+01,  3.6513456e-15],
        [1.0100976e+01, - 2.1423336e+01,  3.8606148e-15]]

for i in G.nodes():
    g.addNode()
for i, j in G.edges():
    g.addEdge(j, i)
graph = g.build().unpack(0).lineWidth(4)  # get the vedo 3d graph lines
nodes = graph.points()                   # get the 3d points of the nodes
print(nodes)
# Coordinates obtained from the layout aren't used. Cooridnates in xyz is used
pts = Points(xyz, r=10).lighting('off')
v1 = ['node'+str(n) for n in range(len(xyz))]
v2 = [sin(x) for x in range(len(xyz))]
labs1 = pts.labels(v1, scale=.04, italic=True).addPos(.05, 0.04, 0).c('green')
labs2 = pts.labels(v2, scale=.04, precision=3).addPos(.05, -.04, 0).c('red')

# Interpolate the node value to color the edges:
graph.cmap('viridis', v2).addScalarBar3D(c='k').addPos(.3, 0, 0)
pts.cmap('viridis', v2)

show(pts, graph, labs1, labs2, __doc__, axes=9)
Instead of using nodes to create pts i.e pts = Points(nodes, r=10).lighting('off') , I've used pts = Points(xyz, r=10).lighting('off') in which the coordinates defined by the user is present. I don't want to use the positions obtained from layout settings. But this creates a graph with no edges. Only the nodes are plotted. I'm not sure if I have missed something.
Could you please have a look?
2 . Also, for the directed graph is it possible to plot the arrows/ directions on the edges?
- I like the update provided in the scalarbar to distinguish outliers, but the gradients aren't visible i.e (0-80 is assigned green and >80 is assigned red). Is it possible to retain the gradient like before?
Many thanks for your support!
DeepaMahm
on 29 Jul 2020
the plot is there.. it's just small in the global scale..:
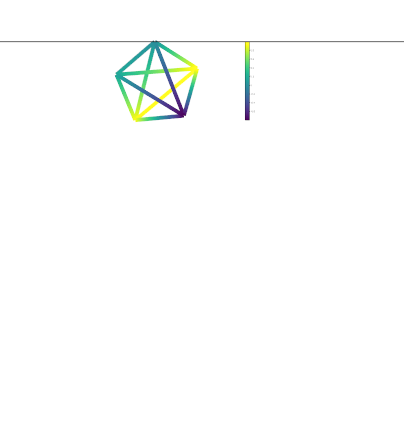
If you want fix the point positions this completely defeats the purpose of a Graph (infact its only task is to find xyz!)
In any case you can do it by forcing the positions of the line vertices in the graph with:
xyz = [ [-8.0549889e+00, -2.0835102e+01,  1.5651123e-15],
        [-5.2478175e+00, -2.0856216e+01,  1.9114774e-15],
        [-1.0559845e+01, -1.9786411e+01,  1.1299285e-15],
        [8.1267099e+00, - 2.1688789e+01,  3.6513456e-15],
        [1.0100976e+01, - 2.1423336e+01,  3.8606148e-15]]

for i, j in G.edges():
    g.addEdge(j, i)
graph = g.build().unpack(0).lineWidth(4)  # get the vedo 3d graph lines
graph.points(xyz)
nodes = graph.points()                    # get the 3d points of the nodes
similarly you can draw arrows with Arrows() class (check docs). Or
vedo -ir glyphs_arrows
marcomusy
on 30 Jul 2020
@marcomusy
Thanks a lot. I tried Arrows(), I want to position the arrows in the midpoint of each edge but for now I' testing with startpoints=graph.points()
import networkx
from vedo import Points, show, sin, Arrow, Arrows, Sphere
from vedo.pyplot import DirectedGraph


g = DirectedGraph(layout='fast2d')
G = networkx.gnm_random_graph(n=5, m=10)

xyz = [[-8.0549889e+00, -2.0835102e+01,  15.651123],
        [-5.2478175e+00, -2.0856216e+01,  1.9114774],
        [-1.0559845e+01, -1.9786411e+01,  11.299285],
        [8.1267099e+00, - 2.1688789e+01,  3.6513456],
        [1.0100976e+01, - 2.1423336e+01,  3.8606148]]


for i, j in G.edges():
    g.addEdge(j, i)
graph = g.build().unpack(0).lineWidth(4)  # get the vedo 3d graph lines
graph.points(xyz)
nodes = graph.points()                   # get the 3d points of the nodes

# Coordinates obtained from the layout aren't used. Cooridnates in xyz is used
pts = Points(xyz, r=10).lighting('off')
v1 = ['node'+str(n) for n in range(len(xyz))]
v2 = [sin(x) for x in range(len(xyz))]
labs1 = pts.labels(v1, scale=.04, italic=True).addPos(.05, 0.04, 0).c('green')
labs2 = pts.labels(v2, scale=.04, precision=3).addPos(.05, -.04, 0).c('red')

# Interpolate the node value to color the edges:
graph.cmap('viridis', v2).addScalarBar3D(c='k')
pts.cmap('viridis', v2)

# Arrows
Arrows(startPoints=nodes, endPoints=None, c=None, scale=0.5)


show(pts, graph, labs1, labs2, axes=True)
However, I get
 if startPoints.shape[1] == 2: # make it 3d
IndexError: tuple index out of range
It's already 3d, so I am not sure why this error occurs
print(nodes.shape[1])
3
Could you please help me with this?
DeepaMahm
on 31 Jul 2020
You are not passing the coords correctly, please refer to the documentation at vedo.embl.es
As you have not so many objects it's probably easier using Arrow not Arrows, e.g.
import networkx
from vedo import Points, show, sin, Arrow, Arrows, Sphere, mag
from vedo.pyplot import DirectedGraph


g = DirectedGraph(layout='fast2d')
G = networkx.gnm_random_graph(n=5, m=10)

xyz = [[-8.0549889e+00, -2.0835102e+01,  15.651123],
        [-5.2478175e+00, -2.0856216e+01,  1.9114774],
        [-1.0559845e+01, -1.9786411e+01,  11.299285],
        [8.1267099e+00, - 2.1688789e+01,  3.6513456],
        [1.0100976e+01, - 2.1423336e+01,  3.8606148]]


for i, j in G.edges():
    g.addEdge(j, i)
graph = g.build().unpack(0).lineWidth(4)  # get the vedo 3d graph lines
graph.points(xyz)
nodes = graph.points()                    # get the 3d points of the nodes

# Coordinates obtained from the layout aren't used. Cooridnates in xyz is used
pts = Points(xyz, r=10).lighting('off')
v1 = ['node'+str(n) for n in range(len(xyz))]
v2 = [sin(x) for x in range(len(xyz))]
labs1 = pts.labels(v1, scale=.04, italic=True).addPos(.05, 0.04, 0).c('green')
labs2 = pts.labels(v2, scale=.04, precision=3).addPos(.05, -.04, 0).c('red')

# Interpolate the node value to color the edges:
graph.cmap('viridis', v2).addScalarBar3D(c='k').rotateX(90).scale(6).pos(12,-22,9)
pts.cmap('viridis', v2)

arrsv=[]
for i, j in G.edges():
    dv = nodes[j]-nodes[i]
    cn = (nodes[j]+nodes[i]) /2
    v = dv/mag(dv)*1.5
    ar = Arrow(cn-v, cn+v, s=.02, c='k')
    arrsv.append(ar)

show(pts, graph, labs1, labs2, arrsv)
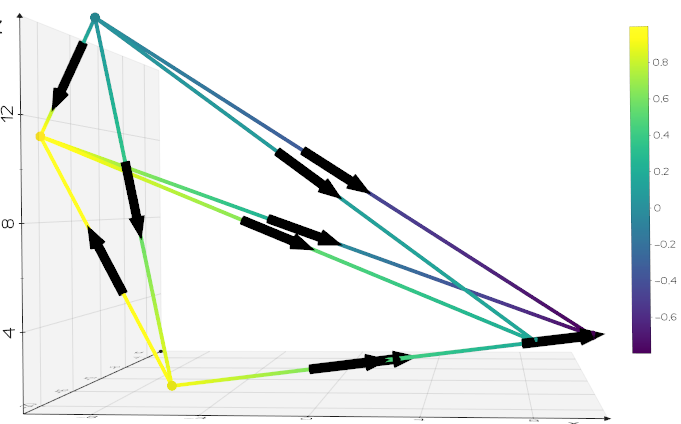
Note that the above example is completely meaningless from a conceptual point of view, as you dont need neither DirectedGraph nor networkx.
marcomusy
on 2 Aug 2020
Thank you, I was trying to use a directed graph because I was not sure how the direction of arrows has to be defined. For instance, in Netwrokx if I don't create a directed graph the edges are not saved in order i.e it treats (u,v) = (v,u).
DeepaMahm
on 2 Aug 2020
Hi @marcomusy
- I like the update provided in the scalarbar to distinguish outliers, but the gradients aren't visible i.e (0-80 is assigned green and >80 is assigned red). Is it possible to retain the gradient like before?
Could you please let me know if there is an update on this?
DeepaMahm
on 4 Aug 2020
Use:
lut = makeLUT([
               ( 80, 'green', 0.8),
               (100, 'red'  , 1.0),
              ],
              vmin=min(vals), vmax=max(vals),
              interpolate=True,
             )
Hi @marcomusy
I checked with interpolate=True. This interpolates and creates a smooth transition in the gradient from green to red. This is nice but the gradients aren't visible for 0-80. 0-80 is assigned green and using this scalarbar I am not able to distinguish the values < 80 since all the values are assigned green.
Could you please offer suggestions on how to assign a gradient for values from 0-80 too?
Thanks a lot for your time and kind attention
DeepaMahm
on 5 Sep 2020
You can play with adding an other (similar) color to make the range more visible, I don't see other options.
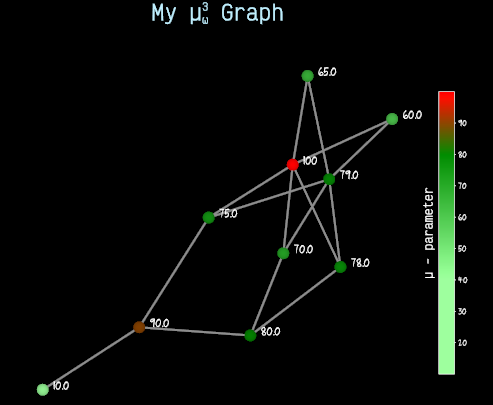
import networkx as nx
from vedo import *

G = nx.gnm_random_graph(n=10, m=15, seed=1)
nxpts = nx.spring_layout(G)
nxpts = [nxpts[pt] for pt in sorted(nxpts)]

nx_lines = [ (nxpts[i], nxpts[j]) for i, j in G.edges()]

nx_pts = Points(nxpts, r=12)
nx_edg = Lines(nx_lines).lw(2).color("grey")

# node values
vals = [100, 80, 10, 79, 70, 60, 75, 78, 65, 90]

# manually build a lookup table for mapping colors
#             value,  color,  alpha
lut = makeLUT([
               ( 40, 'lg',    0.8),
               ( 80, 'green', 0.8),
               (100, 'red'  , 1.0),
              ],
              vmin=min(vals), vmax=max(vals),
              interpolate=True,
             )

nx_pts.cmap(lut, vals)
sb = nx_pts.addScalarBar3D(title='μ - parameter',
                           titleFont='VictorMono',
                           labelFont='Quikhand',
                           c='white')
sb.addPos(0.1,0,0).scale(0.9).useBounds()

labs = nx_pts.labels(scale=.03, font='Quikhand', c='w', precision=3).addPos(0.05,0,0)
# labs = nx_pts.labels('id', scale=.04, font='Quikhand', c='w').addPos(0.05,0,0)

# make a plot title
x0, x1 = nx_pts.xbounds()
y0, y1 = nx_pts.ybounds()
t = Text('My \mu Graph', font='VictorMono', justify='center', s=.07, c='lb')
t.pos((x0+x1)/2, y1*1.4)

show(nx_pts, nx_edg, labs, t, bg='black')
marcomusy
on 5 Sep 2020
@marcomusy May I know if it will help if something similar to belowColor and aboveColor is added in def pointColors
Above color/ Below color can be assigned to the outlier.
def makeLUT(colorlist,
            interpolate=False,
            vmin=None, vmax=None,
            belowColor=None, aboveColor=None, nanColor=None
            ):
  def pointColors(self,
                    input_array=None,
                    cmap="rainbow",
                    alpha=1,
                    vmin=None, vmax=None,
                    arrayName="PointScalars",
                    ):
Hello @marcomusy
I tried the below for adding more colors in makeLUT
import matplotlib
import networkx as nx
from typing import List
from matplotlib import cm
from vedo import *


def map_values_to_color(data: List, cmap: str, integer=False):
    """
    Convert values in a list to RGB values
    :param data:
    :param cmap:
    :param integer:
    :return:
    """
    norm = matplotlib.colors.Normalize(vmin=min(data), vmax=max(data), clip=True)
    mapper = cm.ScalarMappable(norm=norm, cmap=cmap)

    if integer:
        color = [[r, g, b] for r, g, b, a in mapper.to_rgba(data, bytes=True)]
    else:
        color = [[r, g, b] for r, g, b, a in mapper.to_rgba(data)]

    colorlist = [(val, color) for val, color in zip(data, color)]

    return colorlist


if __name__ == '__main__':


    G = nx.gnm_random_graph(n=10, m=15, seed=1)
    nxpts = nx.spring_layout(G)
    nxpts = [nxpts[pt] for pt in sorted(nxpts)]

    nx_lines = [ (nxpts[i], nxpts[j]) for i, j in G.edges()]

    nx_pts = Points(nxpts, r=12)
    nx_edg = Lines(nx_lines).lw(2).color("grey")

    # node values
    vals = [100, .80, .10, .79, .70, .60, .75, .78, .65, .90]

    colorlist = map_values_to_color(data=vals, cmap='bwr_r', integer=True)
    print(colorlist)
    # manually build a lookup table for mapping colors
    #             value,  color,  alpha
    lut = makeLUT([
                   (40, 'lg',    0.8),
                   (80, 'green', 0.8),
                   (100, 'red', 1.0),
                  ],
                  vmin=min(vals), vmax=max(vals),
                  interpolate=True,
                 )

    nx_pts.cmap(lut, vals)
    sb = nx_pts.addScalarBar3D(title='μ - parameter',
                               titleFont='VictorMono',
                               labelFont='Quikhand',
                               c='white')
    sb.addPos(0.1, 0, 0).scale(0.9).useBounds()

    labs = nx_pts.labels(scale=.03, font='Quikhand', c='w', precision=3).addPos(0.05,0,0)
    # labs = nx_pts.labels('id', scale=.04, font='Quikhand', c='w').addPos(0.05,0,0)

    # make a plot title
    x0, x1 = nx_pts.xbounds()
    y0, y1 = nx_pts.ybounds()
    t = Text('My \mu Graph', font='VictorMono', justify='center', s=.07, c='lb')
    t.pos((x0+x1)/2, y1*1.4)

    show(nx_pts, nx_edg, labs, t, bg='black')
The following error is displayed and I am not sure what this means
if self.trail:
AttributeError: 'Text' object has no attribute 'trail'
Text() error: font name VictorMono not found. Skip.
Could you please look into this?
DeepaMahm
on 6 Sep 2020
your code above works fine, just upgrade vedo:
pip install -U vedo
@marcomusy May I know if it will help if something similar to belowColor and aboveColor is added in def pointColors
It's already implemented! check out example:
vedo -r mesh_lut
marcomusy
on 6 Sep 2020
Thank you. The code works fine now after the update. But I am still not able to figure out how to create this broken legend :/
DeepaMahm
on 6 Sep 2020
maybe you should show a graphical example of what you trying to achieve ;)
marcomusy
on 6 Sep 2020
Might not be a good illustration :/ but I'd like to obtain a colorbar like the below
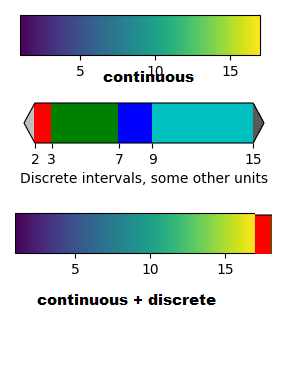
The red discrete patch in the bottom representation is for the outliers (in this example > 1)
DeepaMahm
on 6 Sep 2020
a small trick does it:
lut = makeLUT([( 40, 'lg',    0.8),
               ( 80, 'green', 0.8),
               ( 99, 'red'  , 1.0),
               (100, 'y'  , 1.0),
               (105, 'y'  , 1.0),
              ],
              vmin=min(vals), vmax=max(vals)+5,
              interpolate=True)
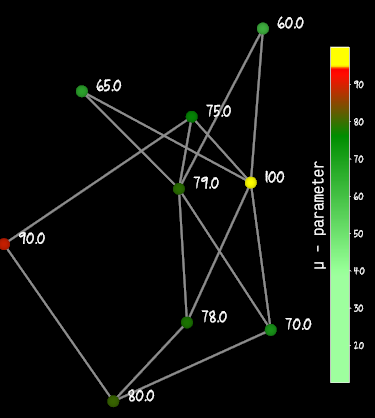
this also works:
lut = makeLUT([( 40, 'lg',),
               ( 80, 'green'),
               ( 99, 'red'),
               (100, 'yellow'),
              ],
              vmin=min(vals), vmax=max(vals)+5,
              interpolate=True,
              aboveColor='y',
             )
I like though the triangles in the middle picture.. i might implement it sometimes!
marcomusy
on 6 Sep 2020
I'm not sure if the above will work when
vals = [100, .80, .10, .79, .70, .60, .75, .78, .65, .90]
instead of
vals = [100, 80, 10, 79, 70, 60, 75, 78, 65, 90]
DeepaMahm
on 6 Sep 2020
At present it will not work i'm afraid. I can implement something like that but timescale is ~1 month.
You might wish to implement it as a 2D vtkScalarBarActor class here, this vtk class has options for range above/below some limits. Once the object is created it can be trivially added to the already existing vedo scene.
marcomusy
on 6 Sep 2020
@marcomusy
I had a look at vtkScalarBarActor class. Unfortunately, I couldn't understand how this works. I've posted this as a question here on vtk forum.
DeepaMahm
on 7 Sep 2020
Hello @marcomusy Could you please check the answer posted here?
DeepaMahm
on 9 Sep 2020
Hi @marcomusy
This is a kind reminder. I'd like to know if the answer posted in the link shared above is useful.
DeepaMahm
on 18 Sep 2020
Hi - yes, but I'm afraid I still need at least one week to implement this functionality in vedo.
marcomusy
on 18 Sep 2020
@marcomusy Thanks a lot for the wonderful support, I look forward to it
DeepaMahm
on 25 Sep 2020
@marcomusy Could you please let me know after the implementation is complete?
DeepaMahm
on 3 Oct 2020
Hi @DeepaMahm - sorry for the long wait - it has been a busy month.. Try the following
pip install -U git+https://github.com/marcomusy/vedo.git
then
import networkx as nx
from vedo import *

G = nx.gnm_random_graph(n=10, m=15, seed=1)
nxpts = nx.spring_layout(G)
nxpts = [nxpts[pt] for pt in sorted(nxpts)]
nx_lines = [(nxpts[i], nxpts[j]) for i, j in G.edges()]

nx_pts = Points(nxpts, r=12)
nx_edg = Lines(nx_lines).lw(2).color("grey")

# node values
vals = [100, .80, .10, .79, .70, .60, .75, .78, .65, .90]

# manually build a lookup table for mapping colors
lut = buildLUT([
                (0.1, 'dg',),
                (0.8, 'dg',),
                (1.0, 'red'),
               ],
               vmin=0.1, vmax=1,
               interpolate=False,
               aboveColor='yellow',
              )

nx_pts.cmap(lut, vals)

# nx_pts.addScalarBar(title='\mu - par')
nx_pts.addScalarBar3D(title='\mu - parameter',
                      titleFont='VictorMono',
                      labelFont='Quikhand',
                      #aboveText='above 1',
                      c='white')
nx_pts.scalarbar.addPos(0.1,0,0).useBounds()

labs = nx_pts.labels(scale=.03, font='Quikhand', c='w').addPos(0.05,0,0)

# make a plot title
x0, x1 = nx_pts.xbounds()
y0, y1 = nx_pts.ybounds()
t = Text('My µ Graph', font='Vega', justify='center', s=.07, c='lb')
t.pos((x0+x1)/2, y1*1.2)

show(nx_pts, nx_edg, labs, t, bg='black')
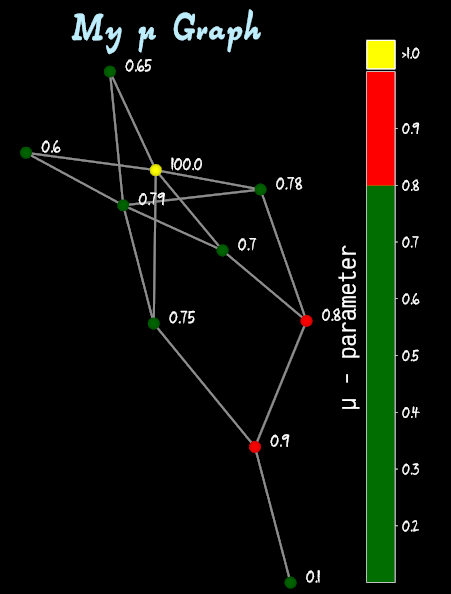
Note that makeLUT renamed to buildLUT and the scalarbar actor needs to be accessed through nx_pts.scalarbar.
Another related example can be found here

marcomusy
on 6 Oct 2020
Hi @marcomusy
Thanks a lot. The update looks nice and I would like to know if we can improve it further to have a continuous color scale for
values < 0.8 like below
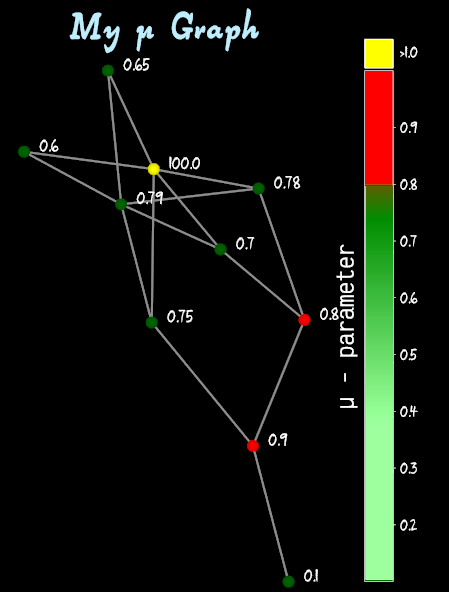
Thank you very much for your time and kind attention
DeepaMahm
on 7 Oct 2020
Easy!
lut = buildLUT([
                (0.1, 'lg',),
                (0.8, 'dg',),
                (0.8001, 'red',),
                (1.0, 'red'),
               ],
               vmin=0.1, vmax=1,
               interpolate=True,
               aboveColor='yellow',
              )

marcomusy
on 7 Oct 2020
Hi @marcomusy
Thanks a lot.
Unfortunately, I couldn't successfully run pip install -U git+https://github.com/marcomusy/vedo.git
I get the following error
collecting git+https://github.com/marcomusy/vedo.git
  Cloning https://github.com/marcomusy/vedo.git to c:\users\user\appdata\local\temp\pip-req-build-pm9lzufx
    ERROR: Command errored out with exit status 1:
     command: 'g:\folder\venv\scripts\python.exe' -c 'import sys, setuptools, tokenize; sys.argv[0] = '"'"'C:\\Users\\user\\AppData\\Local\\Temp\\pip-req-build-pm9lzufx\\setup.py'"'"'; __file__='"'"'C:\\Users\\user\\AppData\\Local\\Temp\\pip-req-build-pm9lzufx\\setup.py'"'"';f=getattr(tokenize, '"'"'open'"'"', open)(__file__);code=f.read().replace('"'"'\r\n'"'"', '"'"'\n'"'"');f.close();exec(compile(code, __file__, '"'"'exec'"'"'))' egg_info --egg-base 'C:\Users\user\AppData\Local\Temp\pip-pip-egg-info-xd0zh8hy'
         cwd: C:\Users\user\AppData\Local\Temp\pip-req-build-pm9lzufx\
    Complete output (8 lines):
    running egg_info
    creating C:\Users\user\AppData\Local\Temp\pip-pip-egg-info-xd0zh8hy\vedo.egg-info
    writing C:\Users\user\AppData\Local\Temp\pip-pip-egg-info-xd0zh8hy\vedo.egg-info\PKG-INFO
    writing dependency_links to C:\Users\user\AppData\Local\Temp\pip-pip-egg-info-xd0zh8hy\vedo.egg-info\dependency_links.txt
    writing requirements to C:\Users\user\AppData\Local\Temp\pip-pip-egg-info-xd0zh8hy\vedo.egg-info\requires.txt
    writing top-level names to C:\Users\user\AppData\Local\Temp\pip-pip-egg-info-xd0zh8hy\vedo.egg-info\top_level.txt
    writing manifest file 'C:\Users\user\AppData\Local\Temp\pip-pip-egg-info-xd0zh8hy\vedo.egg-info\SOURCES.txt'
    error: supposed package directory 'vedo\examples' exists, but is not a directory
    ----------------------------------------
ERROR: Command errored out with exit status 1: python setup.py egg_info Check the logs for full command output.
Could you please suggest how this can be resolved?
Thanks again for the wonderful support
DeepaMahm
on 12 Oct 2020
Hi can you please check if you can successfully do:
pip uninstall vedo
pip uninstall vedo # twice
pip install vedo==2020.4.0
what is your python version on windows?
marcomusy
on 12 Oct 2020
I'm using python 3.6. Sure, I will check
DeepaMahm
on 12 Oct 2020
Hi @marcomusy I could try the following,
pip uninstall vedo
Found existing installation: vedo 2020.4.0
Uninstalling vedo-2020.4.0:
  Would remove:
    ...
  Successfully uninstalled vedo-2020.4.0
```
pip uninstall vedo
WARNING: Skipping vedo as it is not installed.
pip uninstall vedo
WARNING: Skipping vedo as it is not installed.
 ```
pip install vedo==2020.4.0
Collecting vedo==2020.4.0
  Using cached vedo-2020.4.0.tar.gz (9.5 MB)
Requirement already satisfied: vtk in g:\folder\venv\lib\site-packages (from vedo==2020.4.0) (9.0.1)
Requirement already satisfied: numpy in g:\folder\venv\lib\site-packages (from vedo==2020.4.0) (1.18.2)
Using legacy 'setup.py install' for vedo, since package 'wheel' is not installed.
Installing collected packages: vedo
    Running setup.py install for vedo ... done
Successfully installed vedo-2020.4.0
Can you try now:
pip install -U git+https://github.com/marcomusy/vedo.git
do you still get the same error?
(@FedeClaudi would you try this as well as it should fix https://github.com/BrancoLab/brainrender/issues/104 )
marcomusy
on 12 Oct 2020
Works on windows!
 FedeClaudi
on 12 Oct 2020
FedeClaudi
on 12 Oct 2020
@marcomusy The update works! And the interpolation looks great!
DeepaMahm
on 13 Oct 2020
Related issues
 bhaveshshrimali
·
6Comments
bhaveshshrimali
·
6Comments
 RubendeBruin
·
3Comments
RubendeBruin
·
3Comments
 mahendra-ramajayam
·
3Comments
mahendra-ramajayam
·
3Comments
 m-albert
·
7Comments
FedeClaudi
·
6Comments
m-albert
·
7Comments
FedeClaudi
·
6Comments
Most helpful comment
Works on windows!