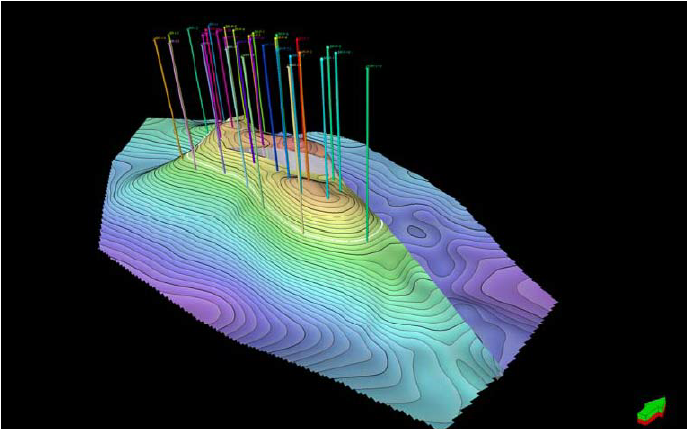
Say I have multiple wells (but only X,Y coordinates are given). How do I plot the wells on my plot as line. Something like this as per image. I want the wells as straight lines passing through the whole Z-coordinates.
Perhaps, essentially I want to know if it's possible to plot 2D line on 3D plots if only 2 coordinates are given (i.e.: a straight line through XY-plane). Also, is there a way to label each line?
 similang
All 14 comments
essentially I want to know if it's possible to plot 2D line on 3D plots if only 2 coordinates are given
well.. if you have no Z information you may assume it's constant, so you can draw a vertical line in the 3D scene simply by passing the coordinates manually, e.g:
line = Line([X,Y,100], [X,Y,200])
where 100 and 200 depend on the bounding box of the scene
is there a way to label each line?
you can use line.lw(5).flag('my line text') which pops a label flag when hovering with mouse. Otherwise you can use Text() and position it along the line.
 marcomusy
on 9 Jul 2020
marcomusy
on 9 Jul 2020
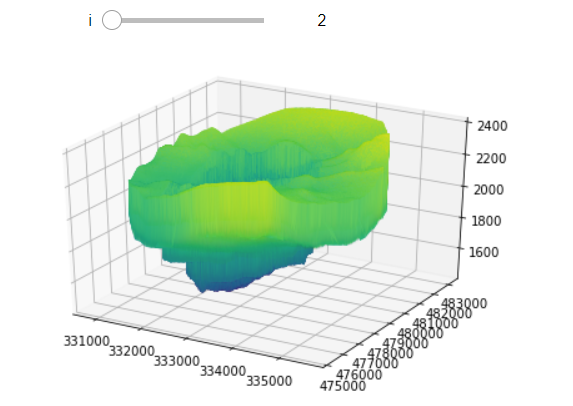
Thanks. I have one more question. This is plot I am anticipated (smoother) but with vedo I got alot of edges.
Is there anyway like to make it smoother? Thanks.
similang
on 14 Jul 2020
i cannot understand from the picture what are the edges.
i would first try it outside jupyter anyway.
marcomusy
on 14 Jul 2020
Thanks for the prompt response. It means the surface is not smooth (can see thorny shapes). Is there a way to smooth it for visualization purpose?
Also, line.lw(5).flag('my line text') does not produce any label when i mouse over...
similang
on 14 Jul 2020
Thanks for the prompt response. It means the surface is not smooth (can see thorny shapes). Is there a way to smooth it for visualization purpose?
it seems to me that the surface clearly has some problem (or is it expected to be like that??).. i would first try to fix the problem :)
Also,
line.lw(5).flag('my line text')does not produce any label when i mouse over...
the mouse-hovering only works with the native vtk rendering window with embedWindow(False)- not in jupyter.
In jupyter with k3d you can only name the displayed objects and find them back in the right black menu.
marcomusy
on 14 Jul 2020
Hi - my plot is not in jupyter dy... I saved as k3d? Also, just wanna to bring out about the surfaces, wondering if there's a way to make it more like contour-shaped as per my sample pic here.
Even in my matplotlib-3d plot the surfaces looked more flattened (Z is inverted here)
similang
on 17 Jul 2020
Hi I've seen the k3d export.. but again, is it expected to be like that? i mean, are the fluctuations reflecting some uncertainty or is it noise or what? the matplotlib picture doesnt look better to me..
marcomusy
on 19 Jul 2020
Hi @similang , I suggest that you only use your points and not the cell connectivity and re-triangulate using a delaunay triangulation. See the example in https://github.com/marcomusy/vedo/blob/2689bd8360b0617f977f21b29aa637235c8ba232/notebooks/advanced/geological_model.ipynb
 ahinoamp
on 10 Aug 2020
ahinoamp
on 10 Aug 2020
True! I didn't think of it.. You can also smooth the point cloud with smoothMLS2D().
marcomusy
on 10 Aug 2020
Hi @similang , I suggest that you only use your points and not the cell connectivity and re-triangulate using a delaunay triangulation. See the example in https://github.com/marcomusy/vedo/blob/2689bd8360b0617f977f21b29aa637235c8ba232/notebooks/advanced/geological_model.ipynb
Hi I did all the work referring to the example above. What's the cell connectivity here?
To be exact, what I did was:
- Delaunay the surfaces
- Then create the mesh object. Not sure where cell connectivity is involved here.
True! I didn't think of it.. You can also smooth the point cloud with
smoothMLS2D().
May I have some examples for this function? I could not find any documentation of this function. If following the sample notebook above, where should I insert this function for my land surfaces?
Many thanks for the assistance so far.
similang
on 11 Aug 2020
You can find the function documentation here (use the search on the top left).
You can plug in the smoothMLS2D operation before delaunay (which creates the cell connectivity). If points are too many you can reduce them by using e.g. Points(point_array).clean(0.05), which imposes a minimum distance of point-point of 5% of the bounding box.
marcomusy
on 11 Aug 2020
Interesting - let me give it a try.
Another question, is it possible to scale the axes? I.e: providing more depths to the surface?
similang
on 12 Aug 2020
Scaling (from the geology example):
for a in plt.actors:
    # change scale to kilometers in x and y, but expand z scale by 1.5!
    a.scale([0.001, 0.001, 0.001*1.5])
Meshing:
as Marco already says, it seems that your point set is not smooth, in which case the Delaunay triangulation might not work, so you need to remove or smooth the points first. You no longer need to worry about the cell connectivity because it seems Marco has made a new function that you just need to give an xyz data point array to:
def delaunay2D(plist, mode='scipy', tol=None):
    """
    Create a mesh from points in the XY plane.
    If `mode='fit'` then the filter computes a best fitting
    plane and projects the points onto it.
Many thanks with all the supports.
similang
on 21 Aug 2020
Related issues
 bhaveshshrimali
·
6Comments
bhaveshshrimali
·
6Comments
 CMengich
·
5Comments
CMengich
·
5Comments
 kemo993
·
6Comments
kemo993
·
6Comments
 m-albert
·
7Comments
m-albert
·
7Comments
 drew-parsons
·
7Comments
drew-parsons
·
7Comments
Most helpful comment
Scaling (from the geology example):
Meshing:
as Marco already says, it seems that your point set is not smooth, in which case the Delaunay triangulation might not work, so you need to remove or smooth the points first. You no longer need to worry about the cell connectivity because it seems Marco has made a new function that you just need to give an xyz data point array to: