Vedo: Visualization in jupyter Lab slicer.py file
Hello, thank you for your excellent work. I have a question to ask you:
Now I want to implement advance in jupyter lab/ slicer.py When embedwindow (false), a python visualizer will pop up, but when I want to get a visualization result on jupyter lab, nothing will appear when I set embedwindow ('K3D').
The code is as follows:
~~~
from vedo import datadir, load, addons, show, Text2D
from vedo.applications import Slicer
from vedo import embedWindow
embedWindow('k3d')
filename = datadir+'embryo.slc'
vol = load(filename).alpha([0,0,1]).c('gray') #.printInfo()
plt = Slicer(vol,
bg='white', bg2='lightblue',
# cmaps=("gist_ncar_r","jet","Spectral_r","hot_r","bone_r"),
cmaps=("gray","jet","Spectral_r","hot_r","bone_r"),
useSlider3D=True,
)
show(plt,vol)
~
The output of jupyter lab is as follows
~
Slicer tool
Use showInset() after first rendering the scene.
~~~
How can I get the visualization results in jupyter lab?
 wangyibin0011
All 9 comments
Jupyter lab and jupyter notebook get the same result
wangyibin0011
on 7 Jul 2020
thanks @wangyibin0011
because vedo delegates in notebooks the rendering to k3d i'm afraid that Slicer can only work when a pop up window is allowed.. :(
 marcomusy
on 7 Jul 2020
marcomusy
on 7 Jul 2020
All right, so that's that.
I have an idea. I want to generate multiple subgraphs in one window, and generate sliders for Vols in each subgraph to show slices. Do you have any good ideas? Any suggestion can be very useful. thank you!
wangyibin0011
on 8 Jul 2020
That should be doable.. check out this example, type:
vedo -r sliders2
marcomusy
on 8 Jul 2020
That's all I need. Thank you very much!
wangyibin0011
on 9 Jul 2020
Now I seem to have a problem: the code is as follows:
~~~
from vedo import *
import math
import numpy as np
def sliderfunc_z(widget, event):
"""
map2cells
dims
"""
i = int(widget.GetRepresentation().GetValue())
rmin, rmax = vol.imagedata().GetScalarRange()
msh = vol.zSlice(i).lighting('', la, ld, 0)
msh.pointColors(cmap='gist_ncar_r', vmin=rmin, vmax=rmax)
vp.renderer.RemoveActor(visibles[2])
if i and i
im_data = np.load('/Users/biomind/Biomind-Server-Tutorials/pipelines/im_data.npy',allow_pickle=True)
columns = 4
numplots = len(im_data)
rows = math.ceil(numplots / columns)
vp = Plotter(axes=False,sharecam=False,title='PreviewPridection',shape=(rows,columns))
la, ld = 0.7, 0.3
for i in range(len(im_data)):
vol = Volume(im_data[i]).c('gray')
dims = vol.dimensions()
visibles = [None,None,None]
vp.show(vol, at=i)
vp.addSlider2D(sliderfunc_z,
0, len(im_data[i]),
value=0,
pos=([0.03,0.03], # first point of slider in the renderer
[0.03,0.3]))
vp.show(interactive=1)
~~~
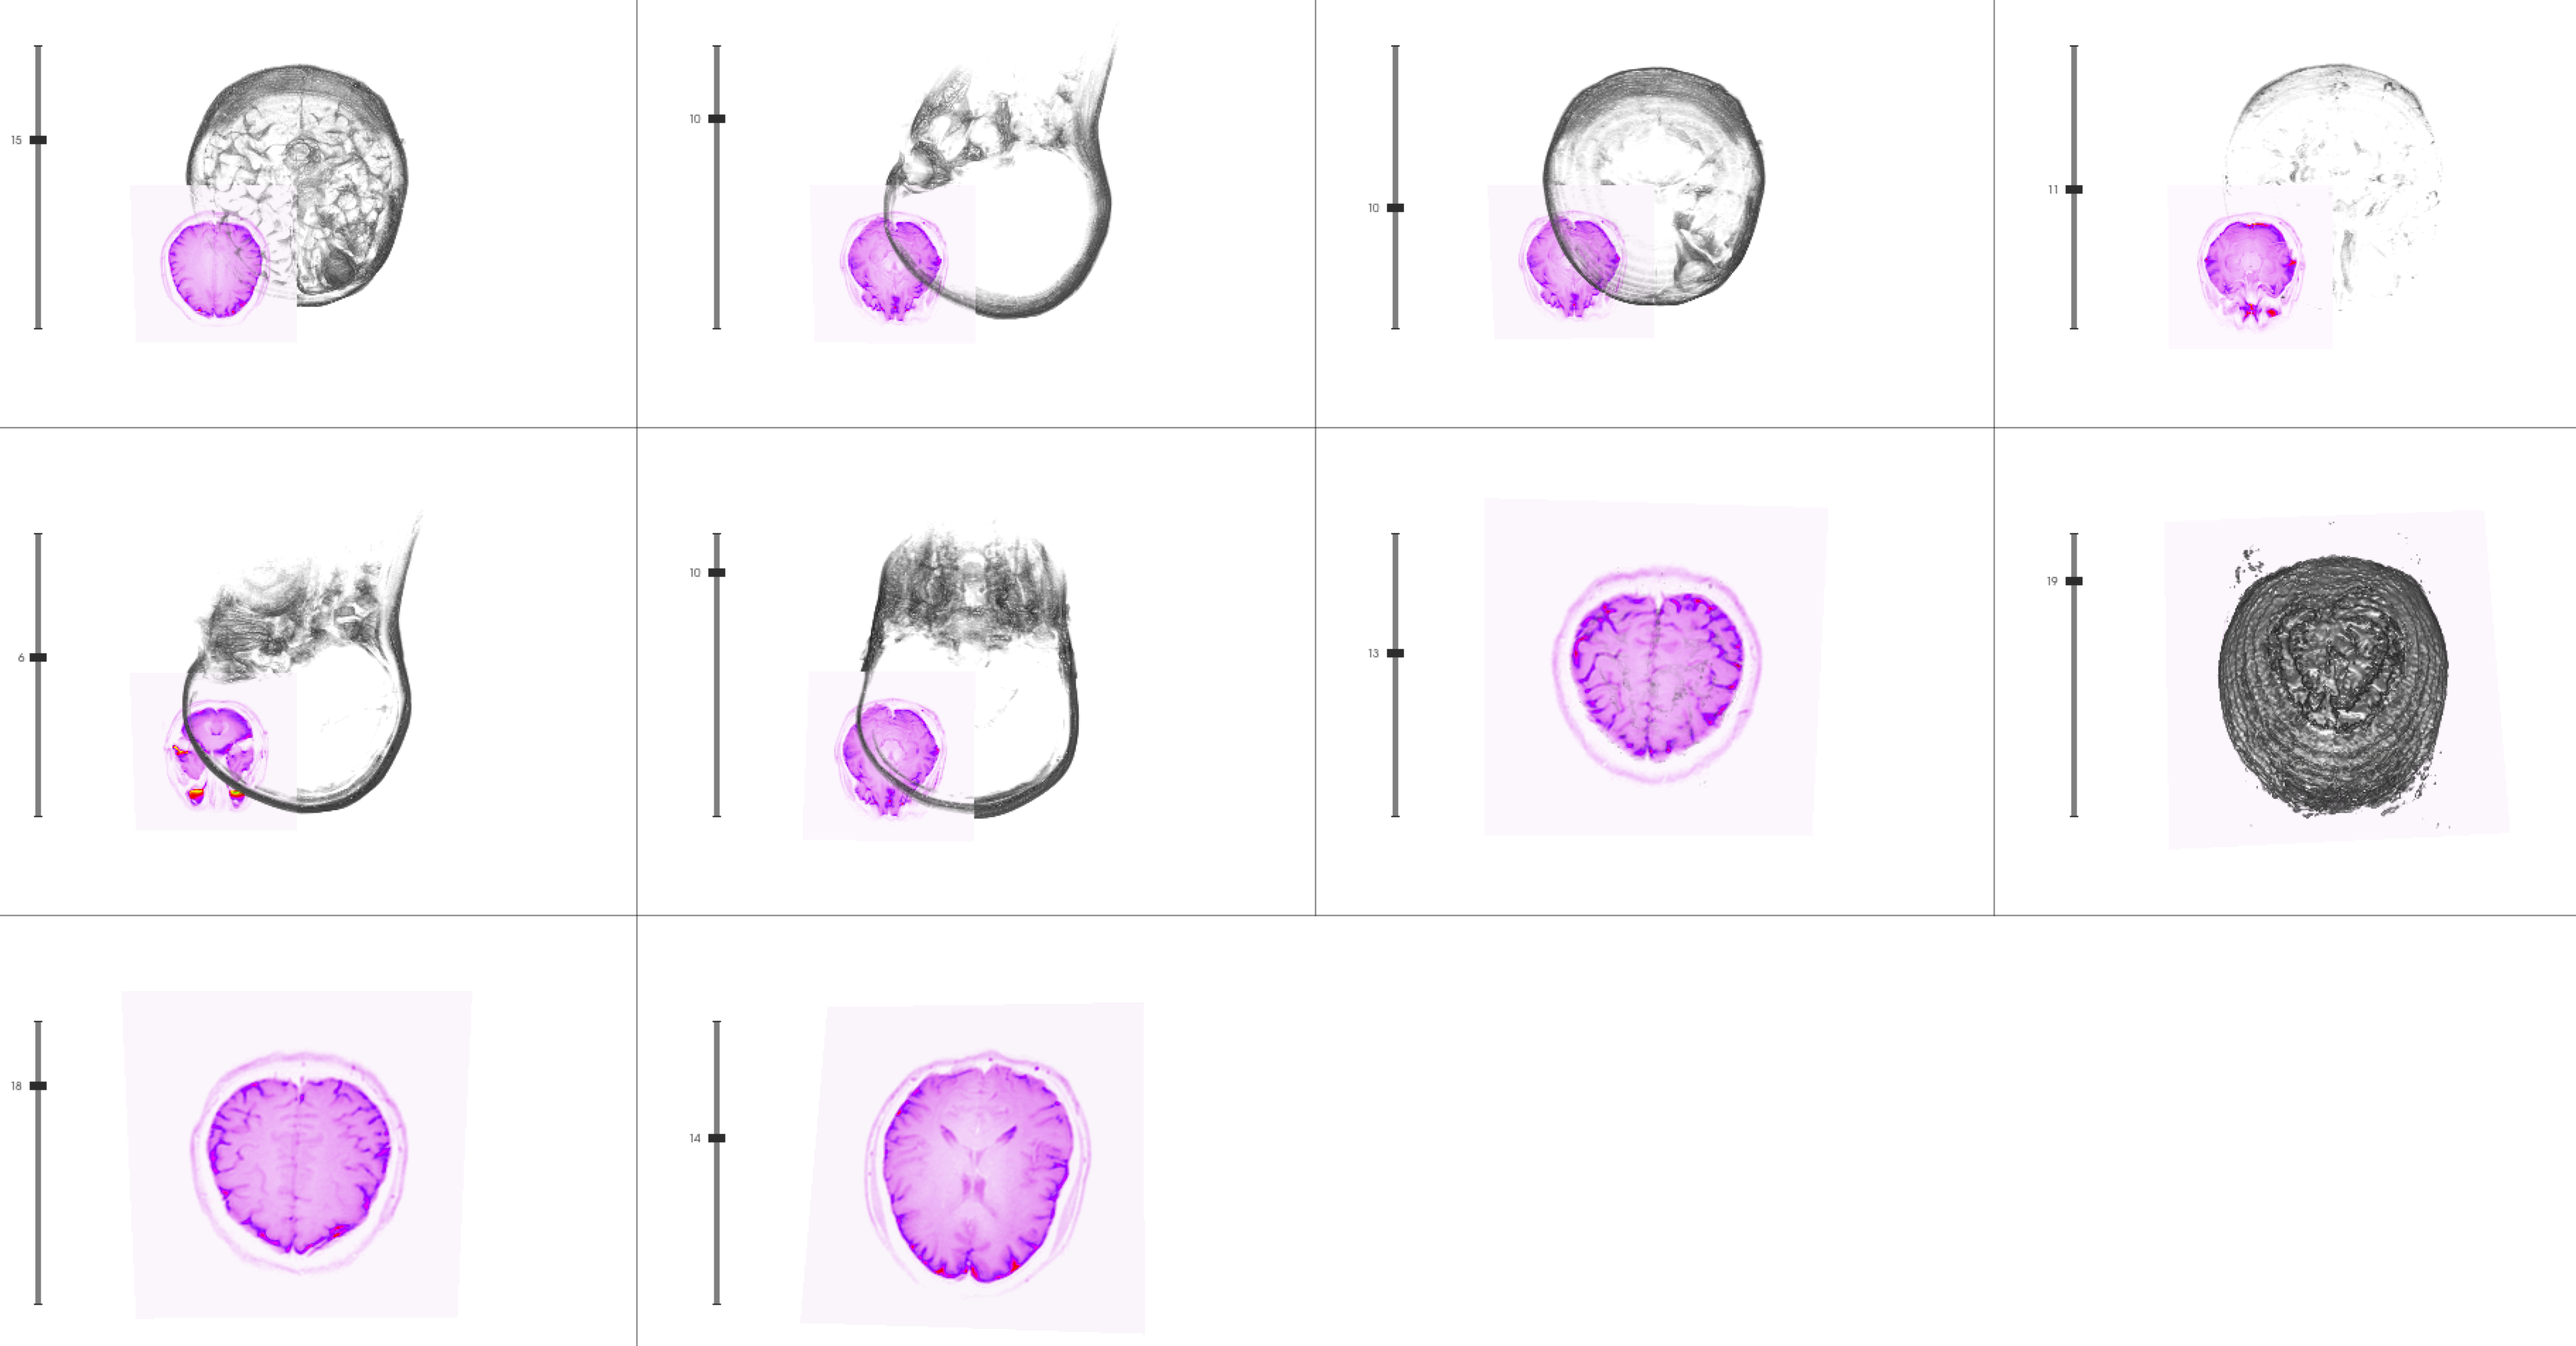
If you run this code, you will find that no matter which slider is operated, the last Vol will be sliced. In fact, I wrote the same thing. Obviously, I want to slice the corresponding Vol when sliding each slider. I noticed our sliderfuncs_ Z is passed to addslider2d as a parameter. Is there any way to pass Vol to sliderfunc_ Z? Otherwise, what are the feasible ways to realize my plan? Looking forward to your reply, NPY file has been uploaded.Of course, there are some problems with the data, but I can solve this
wangyibin0011
on 10 Jul 2020
I solved the problem:
~~~
from vedo import *
import math
import numpy as np
im_data = np.load('/Users/biomind/Biomind-Server-Tutorials/pipelines/im_data.npy',allow_pickle=True)
columns = 4
numplots = len(im_data)
rows = math.ceil(numplots / columns)
vp = Plotter(axes=False,sharecam=False,title='PreviewPridection',shape=(rows,columns))
la, ld = 0.7, 0.3
def slice_factor(index, data):
vol = Volume(data).c('gray')
dims = vol.dimensions()
vp.show(vol, at=index)
visibles = [None,None,None]
def f(widget, event):
vol = Volume(data).c('gray')
i = int(widget.GetRepresentation().GetValue())
rmin, rmax = vol.imagedata().GetScalarRange()
msh = vol.zSlice(i).lighting('', la, ld, 0)
msh.pointColors(cmap='gist_ncar_r', vmin=rmin, vmax=rmax)
vp.renderer.RemoveActor(visibles[2])
if i and i
return f
def add_slice(index, data):
vp.addSlider2D(slice_factor(index, data), 0, len(data),value=0, pos=([0.03,0.03],[0.03,0.3]))
for index, data in enumerate(im_data):
add_slice(index, data)
vp.show(interactive=1)
~~~
wangyibin0011
on 10 Jul 2020
It's a very cool example, i've played a bit with it, consider this variation:
from vedo import Plotter, Volume, Text2D
import numpy as np

im_data = np.load('/home/musy/downloads/im_data.npy', allow_pickle=True)

cmap = 'gist_ncar_r'
alphas = [0,0,0.1,0,0]
zscale = 10
columns = 4
numplots = len(im_data)
rows = int(numplots/columns+0.5)

vp = Plotter(title='PreviewPrediction',
             sharecam=False,
             shape=(rows,columns),
             size='fullscreen')

def slice_factor(index, data):
    vol = Volume(data).mode(1).spacing([1,1,zscale]).c('k').alpha(alphas)
    dims = vol.dimensions()
    box = vol.box().alpha(0.5)
    comment = Text2D('dataset'+str(index), font='MonospaceTypewriter', s=0.8)
    vp.show(vol, box, comment, at=index, interactorStyle=6)
    visibles = [None,None,None]
    rmin, rmax = vol.scalarRange()
    sb = vol.zSlice(0).pointColors(cmap=cmap, vmin=rmin, vmax=rmax).addScalarBar3D()
    sb.UseBoundsOff() # avoid resetting the cam
    zb = vol.zbounds()
    def f(widget, event):
        i = int(widget.GetRepresentation().GetValue())
        vp.renderer = widget.GetCurrentRenderer()
        msh = vol.zSlice(i).lighting('', 0.7, 0.3, 0)
        msh.pointColors(cmap=cmap, vmin=rmin, vmax=rmax)
        vp.remove(visibles[2], render=False)
        if 0 < i < dims[2]:
            zlev = zb[1]/(zb[1]-zb[0])*i*zscale + zb[0]
            vp.add([msh, sb.z(zlev)])
        visibles[2] = msh
    return f

def add_slice(index, data):
    vp.addSlider2D(slice_factor(index, data),
                   0, len(data), value=0,
                   pos=([0.03,0.03],[0.03,0.3]))

for index, data in enumerate(im_data):
    add_slice(index, data)

vp.show(interactive=True)
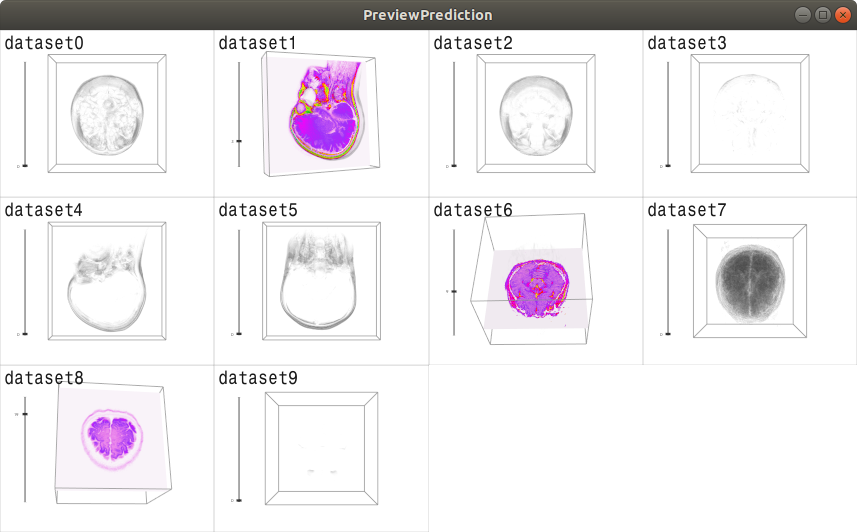
- you dont need to recreate the volume in f
- use right click to rotate scene to avoid accdentally dragging the slider
interactorStyle=6 - use
vp.renderer = widget.GetCurrentRenderer()to grab the current window automatically - expand the z axis with
spacing()and adjust transparency withalpha() - add a comment for each dataset if needed
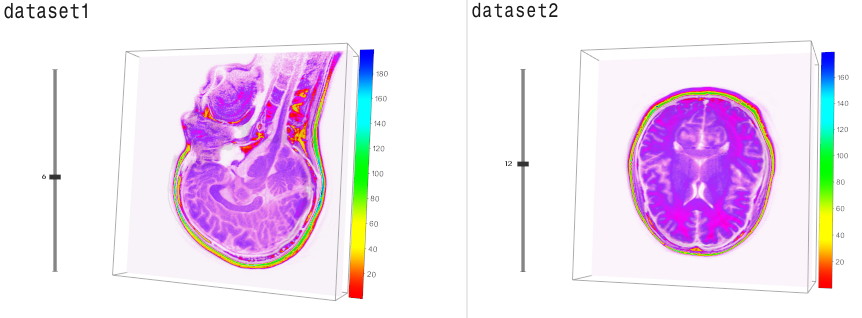
PS: @wangyibin0011 As I see you have a different scaling in each dataset you can add a 3d scalarbar too (i updated the code above):
marcomusy
on 10 Jul 2020
Thank you very much for your suggestions
wangyibin0011
on 10 Jul 2020
Related issues
 vianamp
·
3Comments
vianamp
·
3Comments
 drew-parsons
·
7Comments
drew-parsons
·
7Comments
 m-albert
·
7Comments
m-albert
·
7Comments
 jrdkr
·
7Comments
jrdkr
·
7Comments
 DeepaMahm
·
5Comments
DeepaMahm
·
5Comments