Vedo: Questions regarding plotting window and drawing custom surface with colour
Dear Marco,
I just came upon the vtkplotter lib and it seems quite interesting thus I started playing a bit with it. I have two questions though which I couldn't clearly answer by going through the examples and the issues section.
- Is it possible to have interactive action menu on the plotting window so that you can activate/deactivate/adjust axes, grid, take a screenshot, save plot, etc. From what I've seen in the examples https://github.com/marcomusy/vtkplotter/blob/master/vtkplotter/examples/pyplot/customAxes.py for the axes you can do that only by code. Is that the only way?
- I was testing on an example of mine where I have 4 numpy arrays for the corresponding coordinates of faces/polygons and their corresponding color, something like that:
x = np.array([[-0.93333333, -0.93333333, -0.93333333, -0.93333333],
 [-0.93333333, -0.93333333, -0.93333333, -0.93333333],
 [-1.,         -1.,         -1.,         -1.        ],
 [-1.,         -1.,         -1.,         -1.        ]])

y = np.array([[1., 1., 1., 1.],
 [1., 1., 1., 1.],
 [1., 1., 1., 1.],
 [1., 1., 1., 1.]])

z = np.array([[-1.,         -0.93333333, -0.86666667, -0.8       ],
 [-0.93333333, -0.86666667, -0.8,        -0.73333333],
 [-0.93333333, -0.86666667, -0.8,        -0.73333333],
 [-1.,         -0.93333333, -0.86666667, -0.8       ]])

colormat = np.array([[0.11484721, 0.11484721, 0.11484721],
 [0.11648363, 0.11648363, 0.11648363],
 [0.12010454, 0.12010454, 0.12010454],
 [0.12384401, 0.12384401, 0.12384401]])
Now each column in the x, y, z matrices corresponds to the four 3d coordinates of the quadrangle in an clockwise/anti-clockwise order and each row in the colormat matrix to the face color (it is grayscale as you can see). For example for the first quadrangle you have, something like:

My question now is how to draw these quadrangles all together with the corresponding color using vtkplotter. To be honest looking on the examples I couldn't find something relevant but I might have overlooked.
Also you might get the points in an [x, y, z] form array with numpy as follows in case that this helps somehow:
>>> verts = np.hstack([x.reshape(-1,1,order='F'), y.reshape(-1,1,order='F'), z.reshape(-1,1,order='F')])
>>> verts
array([[-0.93333333,  1.        , -1.        ],
       [-0.93333333,  1.        , -0.93333333],
       [-1.        ,  1.        , -0.93333333],
       [-1.        ,  1.        , -1.        ],
       [-0.93333333,  1.        , -0.93333333],
       [-0.93333333,  1.        , -0.86666667],
       [-1.        ,  1.        , -0.86666667],
       [-1.        ,  1.        , -0.93333333],
       [-0.93333333,  1.        , -0.86666667],
       [-0.93333333,  1.        , -0.8       ],
       [-1.        ,  1.        , -0.8       ],
       [-1.        ,  1.        , -0.86666667],
       [-0.93333333,  1.        , -0.8       ],
       [-0.93333333,  1.        , -0.73333333],
       [-1.        ,  1.        , -0.73333333],
       [-1.        ,  1.        , -0.8       ]])
Thanks.
 ttsesm
All 20 comments
Hi @TheodoreT
thanks for your interest and for the clear explanation of the issue.
is it possible to have interactive action menu on the plotting window so that you can activate/deactivate/adjust axes, grid, take a screenshot, save plot, etc. From what I've seen in the examples https://github.com/marcomusy/vtkplotter/blob/master/vtkplotter/examples/pyplot/customAxes.py for the axes you can do that only by code. Is that the only way?
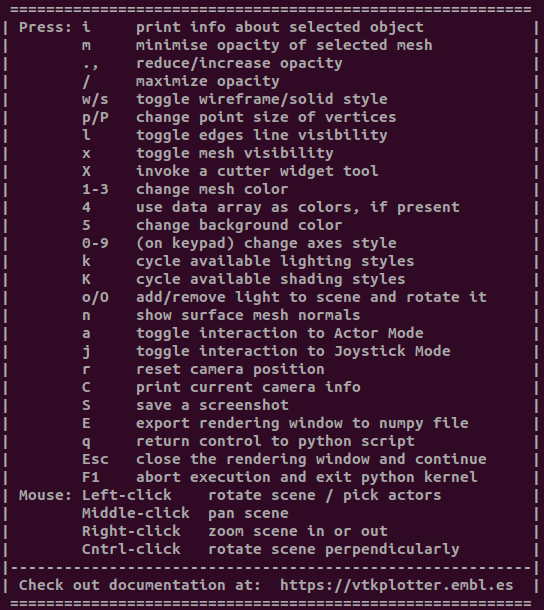
Yes! Press h in the rendering window to get a set of key shortcuts:
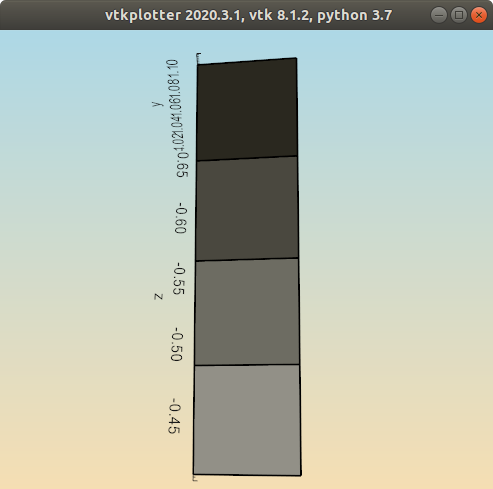
from vtkplotter import Mesh
import numpy as np
x = np.array([
[-0.93333333, -0.93333333, -0.93333333, -0.93333333],
[-0.93333333, -0.93333333, -0.93333333, -0.93333333],
[-1., -1., -1., -1. ],
[-1., -1., -1., -1. ]])
y = np.array([
[1., 1., 1., 1.],
[1., 1., 1., 1.],
[1., 1., 1., 1.],
[1., 1., 1., 1.]])
z = np.array([
[-1., -0.93333333, -0.86666667, -0.8 ],
[-0.93333333, -0.86666667, -0.8, -0.73333333],
[-0.93333333, -0.86666667, -0.8, -0.73333333],
[-1., -0.93333333, -0.86666667, -0.8 ]])
colormat = np.array([
[0.11484721, 0.11484721, 0.11484721],
[0.11648363, 0.11648363, 0.11648363],
[0.12010454, 0.12010454, 0.12010454],
[0.12384401, 0.12384401, 0.12384401]])
colormat *= np.array([1,2,3,4]).reshape(-1, 1) # just to make greys more visible
verts = np.hstack([x.reshape(-1,1,order='F'),
y.reshape(-1,1,order='F'),
z.reshape(-1,1,order='F')])
faces = np.arange(0,len(verts), 1)
faces = np.split(faces, 4) # this describes the faces (by vertex index)
# the optional reverse() flips the orientation of cells
m = Mesh([verts,faces]).reverse().cellIndividualColors(colormat).lw(2)
m.rotateZ(10).rotateX(20) # just to make the axes visible
m.show(axes=8, elevation=60, bg='wheat', bg2='lightblue')
 marcomusy
on 17 May 2020
marcomusy
on 17 May 2020
@marcomusy many thanks for the code snippet it worked nicely. Is there a way though the window not to lock the python script?
Regarding the menu interface using the 'h' command seems nice, it seems kind of limited though (e.g. you cannot show/hide/modify the axes). I had in mind a more intuitive solution like the menu that you get in matlab or mayavi where you can apply different adjustments from the window interface:

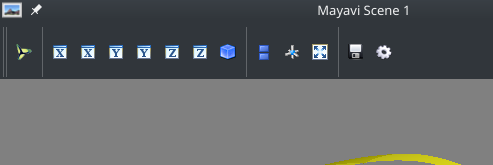
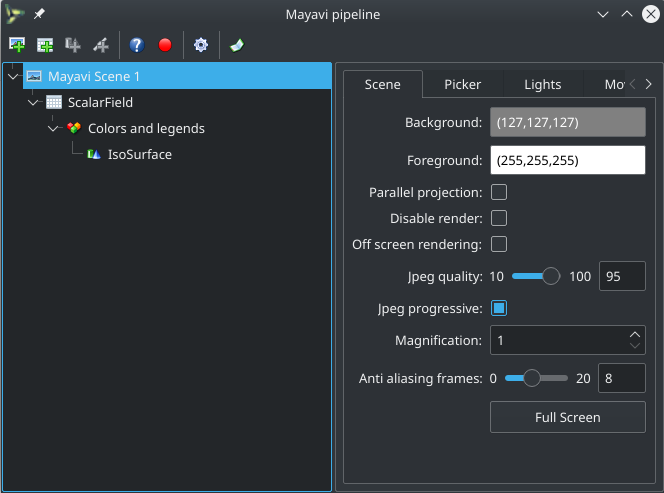
I think that would be a nice feature to be added if possible in the next versions.
ttsesm
on 18 May 2020
@marcomusy many thanks for the code snippet it worked nicely. Is there a way though the window not to lock the python script?
You can do this with keyword show(meshes, interactive=False) or when creating the Plotter object.
You can then go back to interaction with
show(other_meshes, interactive=True)
or with a call to
interactive()
(while interaction is inactive the rendering will not be responsive to mouse.. I'm trying to see if its possible to put it on a thread to make it reactive)
Regarding the menu interface using the 'h' command seems nice, it seems kind of limited though (e.g. you cannot show/hide/modify the axes). I had in mind a more intuitive solution like the menu that you get in matlab or mayavi where you can apply different adjustments from the window interface
You can show/hide and change axes style but not customize them unless you do it in the code.
You are right that a GUI would be more "user friendly" but it probably goes a bit beyond the scope of the package.. The idea behind vtkplotter is to offer a simplified high-level API to the native VTK classes, we are not trying to compete with paraview :)
That said it's true the keyboard interface is a bit primitive (and also a bit buggy) at the minute.. it's on my todo list to improve it!
Cheers
marcomusy
on 18 May 2020
thanks @marcomusy, appreciated for the feedback
ttsesm
on 18 May 2020
@marcomusy me again. I was playing a bit with the plotting and I've managed to get it on a different thread while interactive=True, thus for example my script can continue or even terminate while I am playing with the plot.
import time
import multiprocessing
import os
import vtkplotter as vp
def plot_mesh():
sphere = vp.Sphere().smoothWSinc().x(0.2).alpha(0.1).lw(0.1)
cube = vp.Cube()
p1.show(sphere, cube)
if __name__ == "__main__":
print("starting __main__")
proc = multiprocessing.Process(target=plot_mesh, args=())
proc.daemon = False
proc.start()
time.sleep(1)
print("exiting main")
os._exit(0) # this exits immediately with no cleanup or buffer flushing
Now the question is, whether I can somehow plot again to this plotter (for example sometimes you might need to add some extra data on the plot on top of what is showing at that moment). For example take a Matlab development session with figure windows that come up with a responsive command prompt and you can put a figure on hold and plot again in the same fig object. I do not know if somehow retrieving the ID of the renderer or the window would help. What do you think?
ttsesm
on 6 Jun 2020
Hi this is a very interesting example.
The show() command returns a Plotter object
In this case:
import time
import multiprocessing
import os
import vtkplotter as vp
def plot_mesh():
sphere = vp.Sphere().smoothWSinc().x(0.2).alpha(0.1).lw(0.1)
cube = vp.Cube()
plt = vp.show(sphere, cube, axes=1)
# return plt # cannot return an object?
if __name__ == "__main__":
print("starting __main__")
proc = multiprocessing.Process(target=plot_mesh, args=())
proc.daemon = False
proc.start()
time.sleep(1)
print(vp.settings.plotter_instance) # this prints None
#print("exiting main")
#os._exit(0) # this exits immediately with no cleanup or buffer flushing
it works but I don't know how to access the spawn process and the Plotter instance within to change/add stuff
marcomusy
on 6 Jun 2020
It prints None because the child thread is detached from the parent so there is no communication anymore between the two. Thus, the question is whether there is a way to establish a communication to the child thread from the parent again or even from a new process.
I also tried to run twice the script and leave the first plotter window open and see if the vp.settings.plotter_instance will return anything. It didn't, that means that it looks for a plotter instance only within the process that it was started and not over all the current active system processes.
If you do not know as well how we could address such a case (I am not expert as well with threads and so on) then I might try to open a thread in stackoverflow, since I think it would quite nice to find a way to have such functionality.
ttsesm
on 6 Jun 2020
i guess using Pipe can send/receive info from/to the child process, still one cannot send arbitrary classes because of pickle.
this is maybe one in the right direction (?)
from multiprocessing import Pipe, Process
from vtkplotter import Plotter, Text, ParametricShape
import time
def worker(procnum, send_end):
'''worker function'''
result = ' worker'+ str(procnum)
print(result, 'called')
plt = Plotter(interactive=True)
plt+= Text(result).c(procnum)
plt+= ParametricShape(procnum).c(procnum+1).alpha(0.2)
plt.show(axes=1)
send_end.send(result)
print('worker',procnum,'is returning')
#send_end.send(plt) # TypeError: can't pickle Text objects
jobs = []
pipe_list = []
for i in range(3):
recv_end, send_end = Pipe(False)
p = Process(target=worker, args=(i, send_end))
jobs.append(p)
pipe_list.append(recv_end)
p.start()
print('before sleep')
time.sleep(2)
print('after sleep')
# not really needed (?)
#for proc in jobs: proc.join()
result_list = [x.recv() for x in pipe_list]
print(result_list)
If you do not know as well how we could address such a case (I am not expert as well with threads and so on) then I might try to open a thread in stackoverflow, since I think it would quite nice to find a way to have such functionality.
could be an option - even though should be asked as completely unrelated to vtkplotter.
the thing is that is not very clear to me what the question should be in the first place.. infact one would access the Plotter object only when it is in non-interactive mode... so it is not obvious to me what we really need.
marcomusy
on 6 Jun 2020
The above did not work on me (I am on Window at the moment, I do not know if it has to do with that). I am getting something like:
File "C:\Users\TTsesm\AppData\Local\Programs\Python\Python38\lib\multiprocessing\spawn.py", line 134, in _check_not_importing_main
raise RuntimeError('''
RuntimeError:
An attempt has been made to start a new process before the
current process has finished its bootstrapping phase.
This probably means that you are not using fork to start your
child processes and you have forgotten to use the proper idiom
in the main module:
if __name__ == '__main__':
freeze_support()
...
The "freeze_support()" line can be omitted if the program
is not going to be frozen to produce an executable.
The point is that from what I understand by using Pipe you do not detach the children from the prarent (are you?). Thus, the parent cannot continue working/terminate while the children are on their own.
infact one would access the Plotter object only when it is in non-interactive mode
That's the whole point, is it possible to access with the Plotter somehow in interactive mode. If you say that you cannot do anything with it while it is in interactive mode, then there is no point trying to communicate with it again at all.
Is it possible to change mode on the fly? So if it is on interactive mode then you first set it in non-interactive mode, add/remove a mesh or whatever and then set it back to interactive mode.
p.s. I also found psutils where you might be able to loop through the active processes and retrieve any by name or id, just in case it might get in hand. Here is an example https://thispointer.com/python-check-if-a-process-is-running-by-name-and-find-its-process-id-pid/
ttsesm
on 7 Jun 2020
Is it possible to change mode on the fly? So if it is on interactive mode then you first set it in non-interactive mode, add/remove a mesh or whatever and then set it back to interactive mode.
Yes, this is possible.
What I think is not possible, is to get hold of the Plotter object _as a class_, you can only send messages that pickle is able to understand, not complex classes.
So adding and removing objects becomes a complex operation.
p.s. I also found
psutilswhere you might be able to loop through the active processes and retrieve any by name or id, just in case it might get in hand. Here is an example https://thispointer.com/python-check-if-a-process-is-running-by-name-and-find-its-process-id-pid/
this can be useful at some point, although i think multiprocessing has its own way to retrieve the process id
That said, your example - even though one looses access to the Plotter class - is quite interesting per se!
marcomusy
on 7 Jun 2020
If it is possible to change the mode on the fly, if a process manages to get communication with a existing child which keeps a Plotter then it should be able to apply the changes. So this is what we need to figure out and whether it is possible.
Regarding not being able to pickle different objects I do not know whether we could use pathos lib. According to this https://stackoverflow.com/a/21345423 it can pickle different objects in comparison to normal multiprocessing.
ttsesm
on 7 Jun 2020
If it is possible to change the mode on the fly, if a process manages to get communication with a existing child which keeps a
Plotterthen it should be able to apply the changes. So this is what we need to figure out and whether it is possible.
it is possible, but probably impractical. E.g. you still would not be able create a Sphere in the main process and the add is or send it to the child process, but you may need to create a message "add a sphere please" to the child and inside the child deal with that message..
this is what i got from investigating it...
Regarding not being able to
pickledifferent objects I do not know whether we could usepathoslib. According to this https://stackoverflow.com/a/21345423 it can pickle different objects in comparison to normalmultiprocessing.
I also found that lib and installed it but got the same error message..
marcomusy
on 7 Jun 2020
I see, well it should be able to add/send a mesh to the child process because you might need to send a custom mesh rather an existing mesh from within the vtkplotter api.
Regarding pathos, you might try to open a new issue in their github account and ask if you cannot figure it out. I am looking at it as well, it seems to be a bit different from the vanilla multiprocessing.
ttsesm
on 7 Jun 2020
btw @marcomusy some stylish questions, is it possible remove the shadow (e.i. this dark redish color) from the objects while plotting.
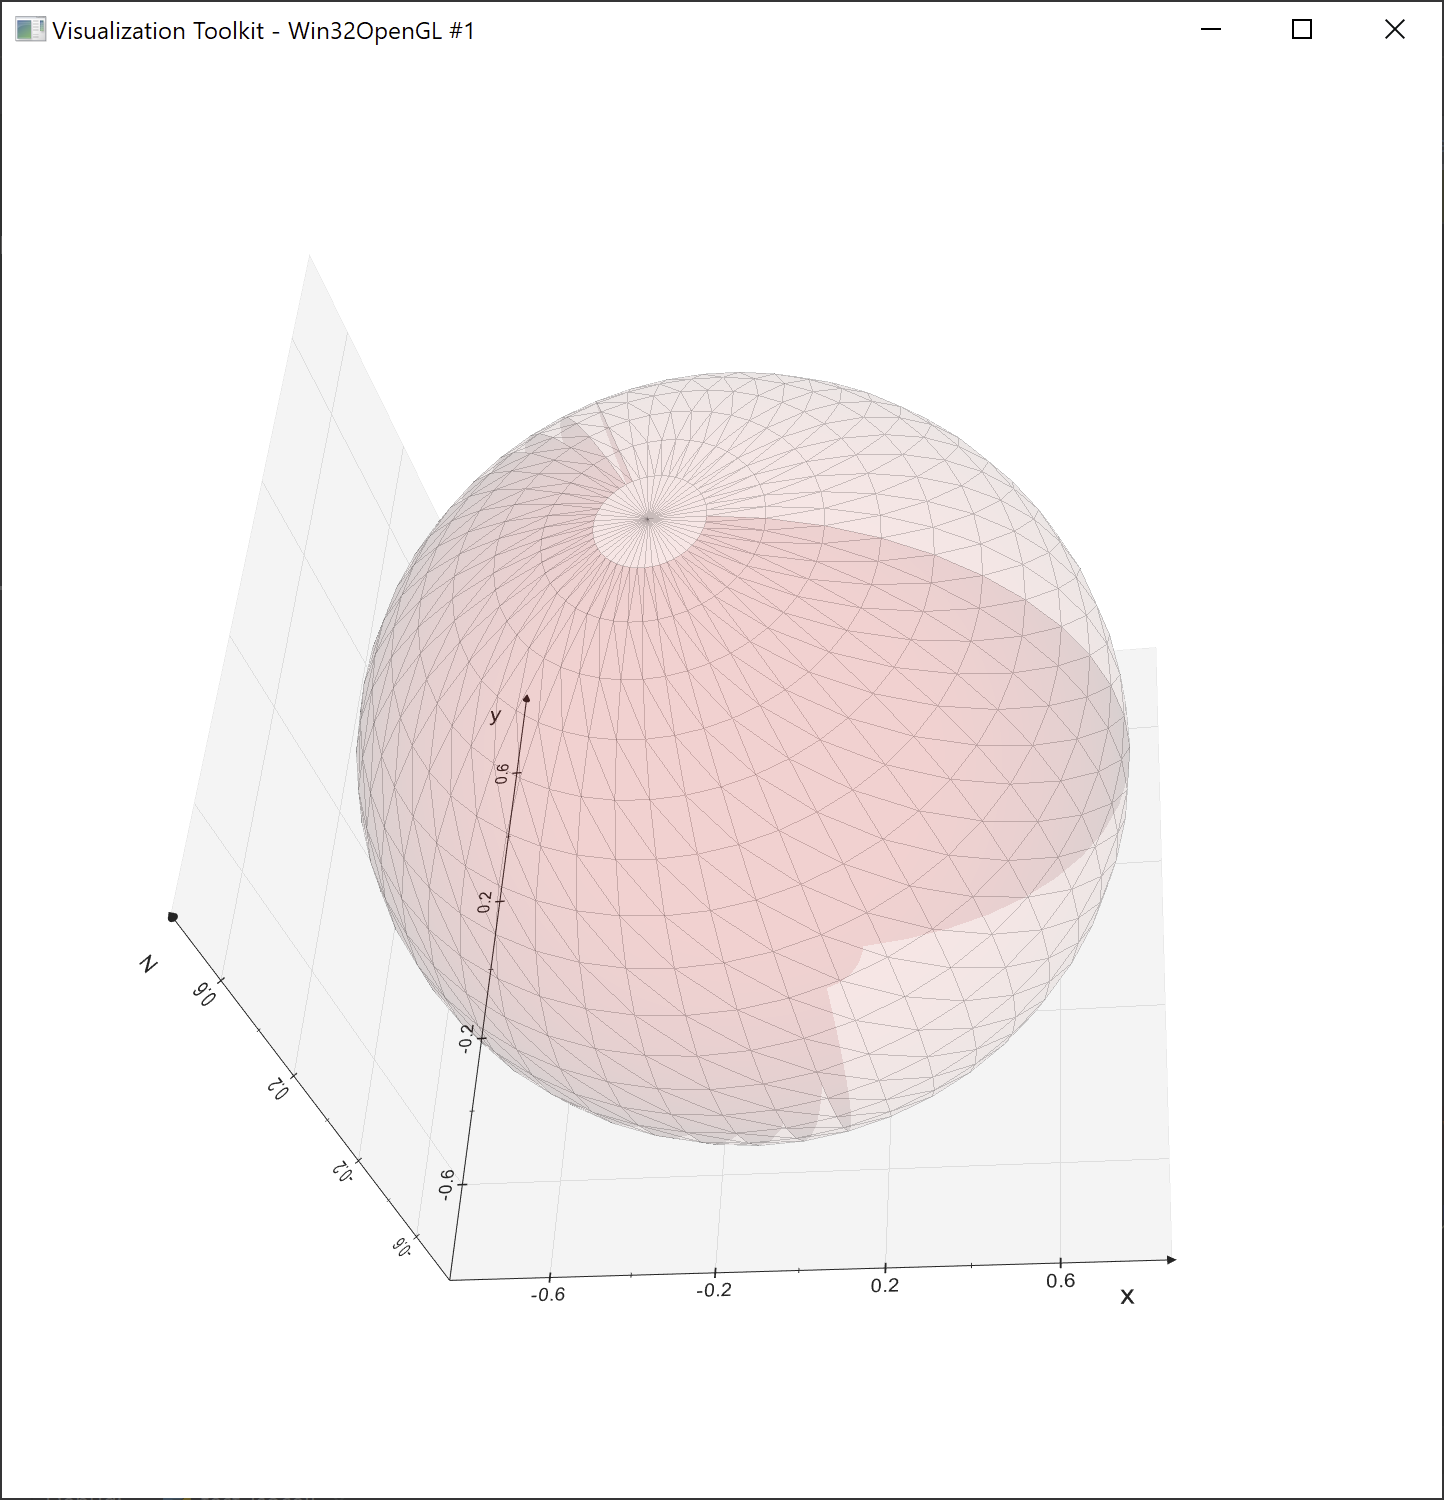
I guess it has to do with lighting or something but I couldn't figure out how to disable it. Also how to have both a triad and the axes grids showing at the same time. On dictionary options I did not see any option for the triad.
ttsesm
on 7 Jun 2020
try:
from vtkplotter import *
# settings.useDepthPeeling=True
# settings.useFXAA=True
sphere1 = Sphere().alpha(0.1).lw(0.1)
sphere2 = Sphere(r=0.3).x(1.5).c('g').alpha(0.1)
sphere_axes1 = addons.buildAxes(sphere1, c='k')
sphere_axes2 = addons.buildAxes(sphere2, c='dg')
show(sphere1, sphere2, sphere_axes1, sphere_axes2, axes=4)
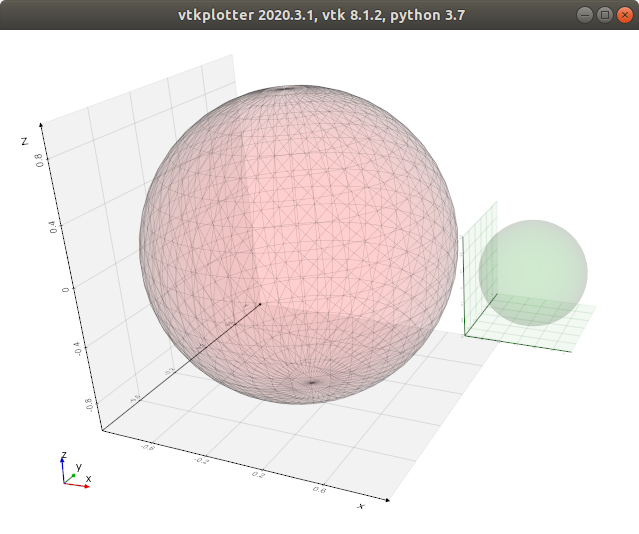
This is how my system (ubuntu + nvidia card) renders it.
The reddish shade you see instead can be due to the rendering low transparency objects, it can be cured by useDepthPeeling... but because of a general bug in VTK this problably will make the grey walls disappear.
marcomusy
on 7 Jun 2020
I see, indeed useDepthPeeling solves the shade but removes the walsl as you correctly guessed. Is it possible to check/select somehow which gpu to use for rendering. I have the feeling that it uses the intel one instead the nvidia (I am on a windows machine).
ttsesm
on 7 Jun 2020
I think it's done at system level, but i have no familiarity with windows OS i'm afraid.
marcomusy
on 7 Jun 2020
No worries.
Actually I have this feeling because if I plot the same mesh (I am rendering a sphere with the intersected rays from the other issue we were discussing) with pyvista, interacting with the rendered mesh is smoother while in the vtkplotter window is a bit laggy for some reason.
ttsesm
on 7 Jun 2020
maybe if you are rendering the Line(s) as independent objects?
in this case if you use merge(list_of_line) into a single Mesh obj will make it a lot faster.
marcomusy
on 7 Jun 2020
yes that was the problem, I was rendering the lines as:
# stack rays into line segments for visualization as Path3D
ray_visualize = trimesh.load_path(np.hstack((origins, origins + drays * 1.2)).reshape(-1, 2, 3))
taken from the corresponding example. Rendering them instead as:
lines = vp.Lines(origins,drays, c='b')
gives me the same smooth result ;-)
ttsesm
on 7 Jun 2020
Related issues
 FedeClaudi
·
7Comments
FedeClaudi
·
7Comments
 Jesse0818
·
4Comments
Jesse0818
·
4Comments
 vigji
·
3Comments
vigji
·
3Comments
 Yoorthiziri
·
5Comments
Yoorthiziri
·
5Comments
 vianamp
·
3Comments
vianamp
·
3Comments
Most helpful comment
yes that was the problem, I was rendering the lines as:
taken from the corresponding example. Rendering them instead as:
lines = vp.Lines(origins,drays, c='b')gives me the same smooth result ;-)