Hi,
I was wondering whether vtkplotter supports indicating the color for each pixel separately in a Volume.
This for example doesn't work as it renders a red structure (should be blue):
from vtkplotter import show, Volume
import numpy as np

import matplotlib as mpl
from matplotlib import cm

norm = mpl.colors.Normalize(vmin=0, vmax=255)
scalarMap = cm.ScalarMappable(norm=norm, cmap='Blues')

im = np.random.randint(0,255,(10,11,12)).astype(np.uint8)
im_rgb = scalarMap.to_rgba(im.flatten()).reshape(im.shape+(4,))

vol = Volume(im_rgb,shape=im_rgb.shape[:3],mode=1)

show(vol)
Thanks a lot!
Best,
Marvin
 m-albert
All 9 comments
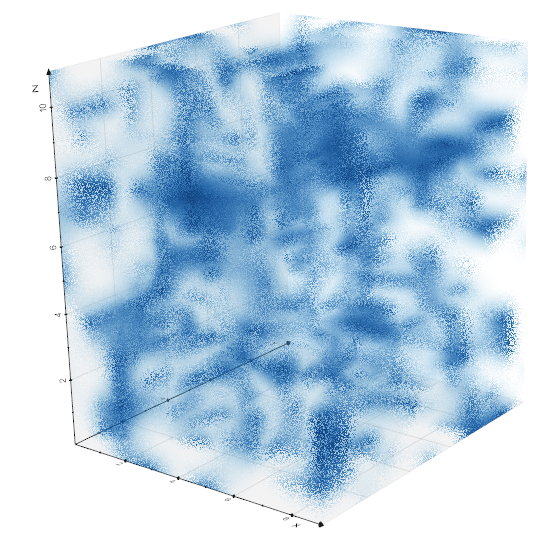
Yes, you can specify a color list which spans from vmin to vmax:
from vtkplotter import show, Volume
import numpy as np
import matplotlib as mpl
from matplotlib import cm

norm = mpl.colors.Normalize(vmin=0, vmax=255)
scalarMap = cm.ScalarMappable(norm=norm, cmap="Blues")
x = np.linspace(0,255, num=50)
cols = scalarMap.to_rgba(x)[:,(0,1,2)]

im = np.random.randint(0, 255, (10, 11, 12)).astype(np.uint8)

im_rgb = scalarMap.to_rgba(im.flatten()).reshape(im.shape + (4,))

vol = Volume(im_rgb, shape=im_rgb.shape[:3], mode=1, c=cols)

show(vol, axes=1)
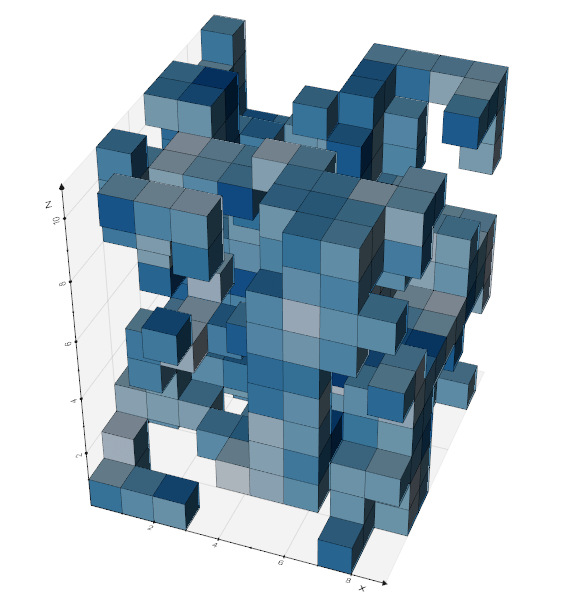
To visualize voxels above some threshold:
show(vol.legosurface(cmap="Blues"), axes=1)
 marcomusy
on 20 Feb 2020
marcomusy
on 20 Feb 2020
Thanks! However I meant to set RGB(A) values for each pixel manually.
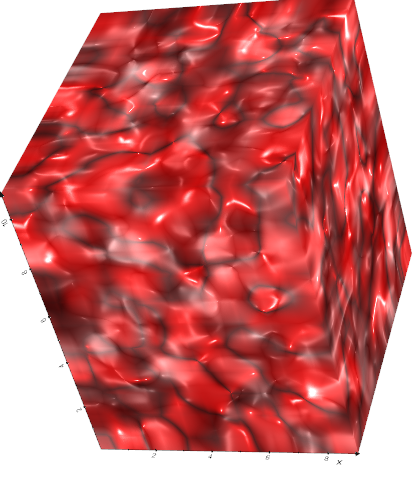
I see that vtkplotter.volume.Volume doesn't allow for more than one channel. I just tried to construct a Volume that would render in RGBA, however this code is as far as I got, which renders a red to grey volume somehow:
import vtk
import vtkplotter

import numpy as np
im_rgb = np.random.randint(0,255,(10,11,12,4)).astype(np.uint8)

vol = vtkplotter.Volume(None)

img = vtk.vtkImageData()
img.SetDimensions(im_rgb.shape[:3])


img.AllocateScalars(vtk.VTK_DOUBLE,4)
for x in range(im_rgb.shape[0]):
    for y in range(im_rgb.shape[1]):
        for z in range(im_rgb.shape[2]):
            for c in range(0,4):
                img.SetScalarComponentFromDouble(x,y,z,c,im_rgb[x,y,z,c])

vol._mapper = vtk.vtkGPUVolumeRayCastMapper()
# vol._mapper = vtk.vtkFixedPointVolumeRayCastMapper()

vol._imagedata = img
vol._mapper.SetInputData(img)
vol.SetMapper(vol._mapper)

vtkplotter.show(vol)
the above can be simplified a bit as:
import vtk
from vtkplotter import Volume
import numpy as np

im_rgb = np.random.randint(0,255, (10,11,12,4)).astype(np.uint8)

vol = Volume(None, shape=im_rgb.shape[:3], mapperType='gpu').jittering(False)

img = vol.imagedata()

img.AllocateScalars(vtk.VTK_DOUBLE,4)
for x in range(im_rgb.shape[0]):
    for y in range(im_rgb.shape[1]):
        for z in range(im_rgb.shape[2]):
            for c in range(0,4):
                img.SetScalarComponentFromDouble(x,y,z,c,im_rgb[x,y,z,c])

vol._update(img)

vol.show()
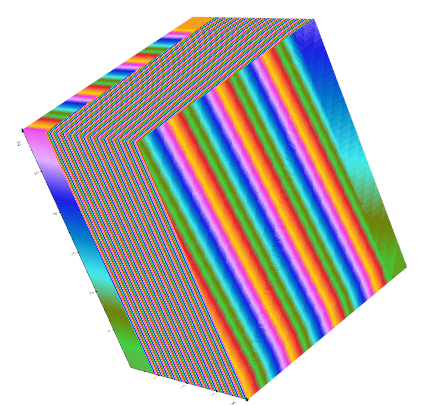
About setting a (rgba) to each voxel you can try the following:
from vtkplotter import Volume
import numpy as np

nx, ny, nz = 5,6,7
cols = list(range(nx*ny*nz)) # any list as int, (r,g,b), or color/nick name
alphas = np.ones(nx*ny*nz)

im_rgb = np.array(cols).reshape((nx,ny,nz))

vol = Volume(im_rgb, shape=im_rgb.shape[:3], mode=1,  c=cols, alpha=alphas)
vol.jittering(False)

vol.show(axes=1)
In maximum projection mode it shows something like this... but i'm not completely sure if this is what you really are after..
marcomusy
on 20 Feb 2020
the above can be simplified a bit as:
Oh interesting.
In maximum projection mode it shows something like this... but i'm not completely sure if this is what you really are after..
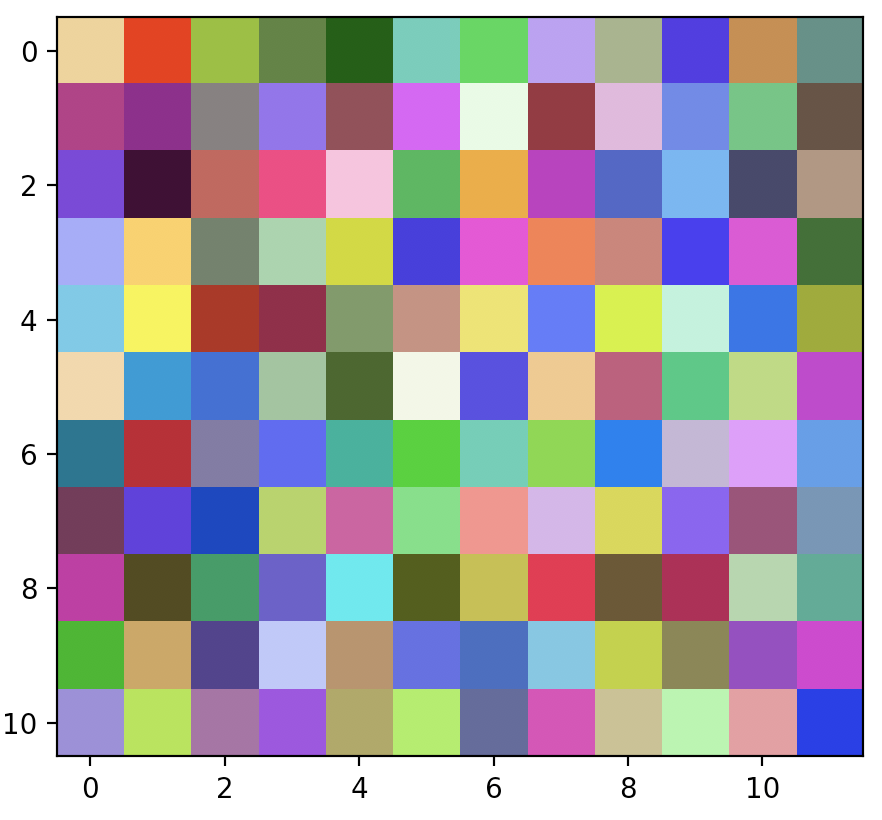
If I understand properly, setting ..., c=cols) here sets the lookup table. What I would like to do is something like matplotlib does in 2d:
import numpy as np
from matplotlib import pyplot as plt

# example dummy image
im_rgb = np.random.randint(0,255,(10,11,12,3)).astype(np.uint8)

plt.figure()
plt.imshow(im_rgb[0])
plt.show()
which lets me indicate the RGB for each pixel resulting in something like this:
m-albert
on 20 Feb 2020
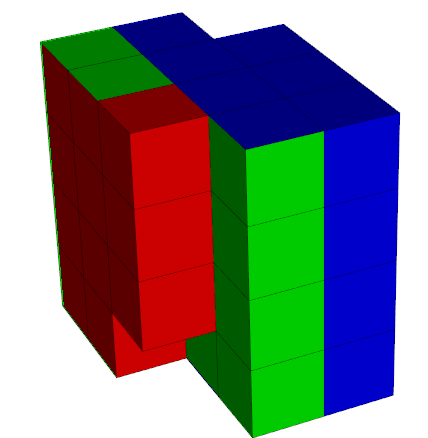
uhmm... probably not perfect but you can try this:
from vtkplotter import Volume, show, makeLUT
import numpy as np

nx, ny, nz = 5,5,5
arr = np.arange(0, nx*ny*nz).reshape((nx,ny,nz))

vol = Volume(arr)

# Build a custom lookup table (LUT)
# up to 50 show red, btw 50 and 70 green etc
lutc = [(50,(1,0,0)), (70,(0,1,0)), (125,(0,0,1))]
lut = makeLUT(lutc, vmin=0, vmax=nx*ny*nz)

# exclude voxels below 30
s = vol.legosurface(vmin=30, cmap=lut)

show(s)
marcomusy
on 20 Feb 2020
True, rendering as a mesh would be an option.
I think I found a good solution for volumes now, namely in vtk there's the option of taking the RGB values from pixels for rendering (see here). For this the vtkImageData object should contain 2 or 4 scalar components and then vtkVolumeProperty.IndependentComponentsOff() should be set.
Modifying your code above like this seems to work:
import vtk
from vtkplotter import Volume
import numpy as np

im_rgb = np.random.randint(0,255, (10,11,12,4)).astype(np.uint8)

vol = Volume(None, shape=im_rgb.shape[:3], mapperType='gpu').jittering(False)

img = vol.imagedata()

img.AllocateScalars(vtk.VTK_DOUBLE,4)
for x in range(im_rgb.shape[0]):
    for y in range(im_rgb.shape[1]):
        for z in range(im_rgb.shape[2]):
            for c in range(0,4):
                img.SetScalarComponentFromDouble(x,y,z,c,im_rgb[x,y,z,c])

vol._update(img)

volumeProperty = vtk.vtkVolumeProperty()
volumeProperty.IndependentComponentsOff()
vol.SetProperty(volumeProperty)

vol.alpha(0.4)

vol.show()
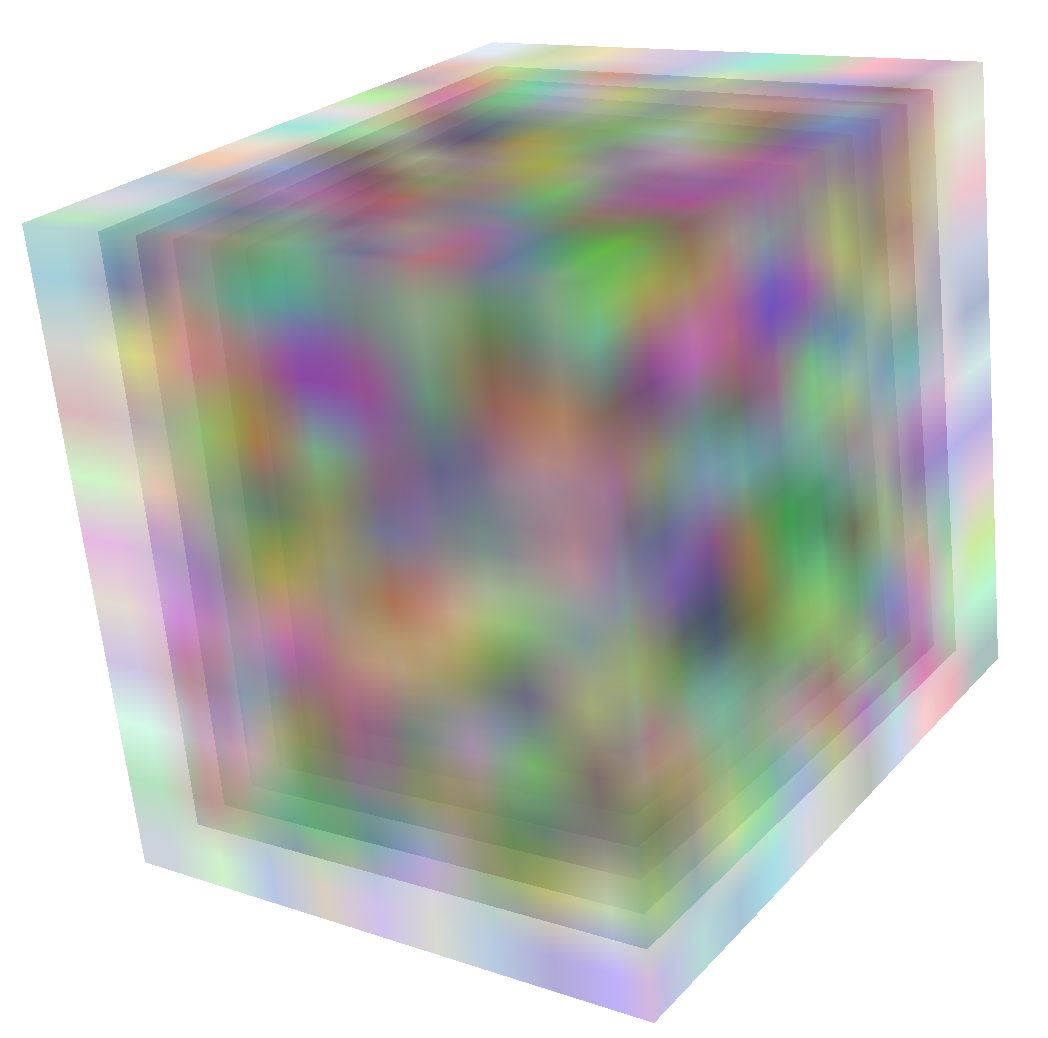
The main reason why I was looking for this is to be able to blend the colors of overlapping volumes, as I'm trying to visualize the results of registering two volumes onto each other.
Maybe it'd be useful also to other people if rendering volumes with explicit RGB values was part of vtkplotter?
Cheers
m-albert
on 21 Feb 2020
Hi Marvin
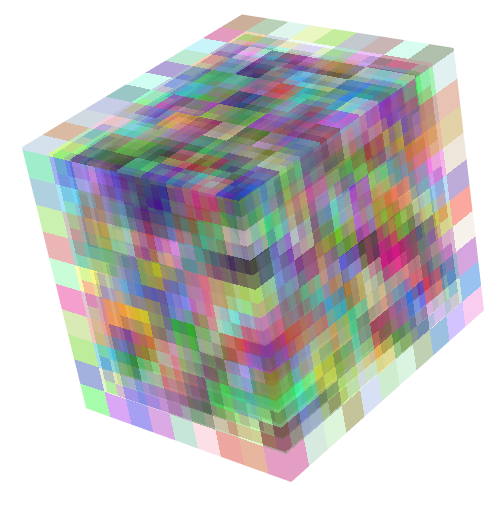
thanks for sharing this.. indeed it looks a useful feature. In case you find it relevant you can also play with interpolation mode:
import vtk
from vtkplotter import Volume
import numpy as np

im_rgb = np.random.randint(0,255, (10,11,12,4)).astype(np.uint8)

vol = Volume(None, shape=im_rgb.shape[:3], mode=0)
vol.alpha(0.4).jittering(False)
vol.GetProperty().IndependentComponentsOff()
vol.GetProperty().SetInterpolationTypeToNearest()

img = vol.imagedata()
img.AllocateScalars(vtk.VTK_DOUBLE,4)
for x in range(im_rgb.shape[0]):
    for y in range(im_rgb.shape[1]):
        for z in range(im_rgb.shape[2]):
            for c in range(0,4):
                img.SetScalarComponentFromDouble(x,y,z,c,im_rgb[x,y,z,c])

vol._update(img)
vol.show()
(also you don't need to recreate the vtkVolumeProperty object)
marcomusy
on 21 Feb 2020
PS: Consider also removing the nested loops with:
import vtk
from vtkplotter import Volume
import numpy as np

vol = Volume(None, shape=(10,11,12), mode=0)
vol.alpha(0.4).jittering(False)
vol.GetProperty().IndependentComponentsOff()
vol.GetProperty().SetInterpolationTypeToNearest()

vol.imagedata().AllocateScalars(vtk.VTK_UNSIGNED_CHAR, 4)
arr = vol.getPointArray()
arr[:] = np.random.randint(0,255, (10*11*12,4)).astype(np.uint8)

vol.show()
and also save memory with vtk.VTK_UNSIGNED_CHAR
marcomusy
on 21 Feb 2020
Those are great suggestions! (Sorry that I forgot to answer earlier)
It's great to see how vedo is becoming even more powerful and mature :). Thanks so much!
m-albert
on 1 Jul 2020
Related issues
 DeepaMahm
·
5Comments
DeepaMahm
·
5Comments
 Yoorthiziri
·
5Comments
Yoorthiziri
·
5Comments
 kemo993
·
6Comments
m-albert
·
7Comments
kemo993
·
6Comments
m-albert
·
7Comments
 MarkusRosen
·
5Comments
MarkusRosen
·
5Comments
Most helpful comment
Those are great suggestions! (Sorry that I forgot to answer earlier)
It's great to see how vedo is becoming even more powerful and mature :). Thanks so much!