Universalmediaserver: Java 100% CPU use
Hi, new to UMS, installed Java just for UMS, so nothing else should be using it.
After some (I believe random) time java takes over 100% CPU usage.
Tried looking in the git forums but found no solution for it.
I attach the TRACE logs hoping someone can give a clue.
Lenovo Y520 Laptop I7 7700HQ/16GB RAM
Windows 10 Pro 1803 (17134.345)
UMS 7.5.0 (2018-10-13)
Java 8 build update 191 (1.8.0_191-b12)
Thanks in advance.
 javieryi
All 78 comments
Do the use of UMS 6.7.0 or 7.4.0 help?
https://sourceforge.net/projects/unimediaserver/files/Official%20Releases/Windows/UMS-6.7.4.exe/download
 Sami32
on 2 Nov 2018
Sami32
on 2 Nov 2018
@javieryi sorry to hear you are experiencing this bug
Are you able to notice anything like the memory use creeping up?
And were you able to make the ums_dbg.zip package while it was at 100% CPU?
 SubJunk
on 3 Nov 2018
SubJunk
on 3 Nov 2018
Hi, yes at that particular moment CPU was 100% and waited for the report to zip before killing it.
I'm trying with 6.7.4 as suggested by @Sami32 and so far is OK, but with 7.5.0 it also took quite some time to get to the bug, I'll report with results in a couple days once I know for sure what's happening with 6.7.4.
After that I will also try 7.4.0 (or any other you might suggest), if that helps to narrow down when/if the bug was introduced.
Thanks a lot for your help to both of you.
javieryi
on 3 Nov 2018
@javieryi thanks for helping us to narrow it down to a version, it will help us fix it :)
SubJunk
on 4 Nov 2018
Hi, it took some time but I'm sorry to report that 100% java CPU use bug reproduced with UMS 6.7.4
I attached the TRACE reports and wait for further instructions.
javieryi
on 5 Nov 2018
Thanks a lot for trying this @javieryi
If you have more time we could keep going backwards in major versions since I don't see anything in the debug logs, here is the last version 5: https://sourceforge.net/projects/unimediaserver/files/Official%20Releases/Windows/UMS-5.5.0-Java7.exe/download
Another thing to try might be to install Java Runtime v7 to see if it is a new Java bug.
SubJunk
on 5 Nov 2018
Just letting you know what's going on.
Since getting Java 7 seems to be a bit not so easy because of some Oracle policies, I realized that there is a newer Java version that for some reason is still not the default stable one, so I downloaded Java 8 build update 192 x64 (as opposed to 191 which I had installed before) and kept UMS 6.7.4.
It's been running without problems so far, but to make sure I'll leave it for a bit longer, if that is successful I'll try again with latest UMS.
Thanks again for your help.
javieryi
on 7 Nov 2018
@javieryi that's very interesting and strange! Looking forward to seeing the results of more testing :)
SubJunk
on 7 Nov 2018
Sorry to report that even though it took some time the bug appeared again with Java 8 192 x64 + UMS 6.7.4.
I'll try now with Java 7 if I can find a source for it. On top of that, I had to restart the computer and I forgot to enable TRACE again, so no logs this time :(
I'll report with results from Java 7 once I get them.
javieryi
on 9 Nov 2018
@javieryi the changes between UMS v6 and v7 were pretty minor so I would have been surprised if that was the problem. A lot of things changed from v4 to v5, and v5 to v6, so it might be a good idea to try those too.
I think it is more likely to be a UMS problem than a Java problem so I would suggest prioritizing testing older versions :)
Let me know if you want links to them
SubJunk
on 10 Nov 2018
I had to register with Oracle in order to get Java 7 u80-b15 but now I have it :) and I believe it's a requirement for UMS 5 for whom you already provided a link, thanks a lot for that.
I'll try 5.5.0 as you suggest then, I'll report back once I have some results.
Thanks again for your time and help.
javieryi
on 10 Nov 2018
Again no success, UMS 5.5.0 and Java 7 u80-b15, bug still present, moving into 5.4.0 this one was quick xD
I'm starting to think if it's something else related to something in my own system setup.
javieryi
on 11 Nov 2018
Hmm you could go in the other direction and try v1.0 ;)
SubJunk
on 11 Nov 2018
Here are links to the latest versions within major versions, because I feel bad about not being able to help more on this!
https://sourceforge.net/projects/unimediaserver/files/Official%20Releases/Windows/UMS-1.6.0.exe/download
https://sourceforge.net/projects/unimediaserver/files/Official%20Releases/Windows/UMS-2.6.5.exe/download
https://sourceforge.net/projects/unimediaserver/files/Official%20Releases/Windows/UMS-3.6.4.exe/download
https://sourceforge.net/projects/unimediaserver/files/Official%20Releases/Windows/UMS-4.4.0-Java7.exe/download
SubJunk
on 11 Nov 2018
Also here is a possible fix I have been working on, it would be good to see if it works :) https://www.spirton.com/uploads/UMS/UMS-GlobalIdRepoMemoryAware-f04036c.exe
SubJunk
on 14 Nov 2018
I've just installed this testing version and so far is running along Java 8 "jre-8u191-windows-x64", but for some reason I can't find the server on my network, still don't know why, will have some more time during the weekend to check if I miss configured something or firewall and whatnot.
Can confirm UMS 4.4.0-Java7 along with Java 7 u80-b15, bug present. Sadly no logs (checking clean install deleted the UMS config folder with the zip in it, I'm getting sloppy, sorry).
javieryi
on 16 Nov 2018
@javieryi I didn't expect the problem to be there in v4, wow it is very old! Thanks for your continued testing. I think the build I posted last isn't ready yet, so it might not be worth testing
SubJunk
on 16 Nov 2018
I just checked the config and of course it was the firewall blocking it, it's working fine, so I might as well leave it running in TRACE log mode (which by the way seems to be a selectable in this build instead of usual restarting in TRACE log mode) and report the results.
If you have any other clues on how to narrow the possible issues, like which codecs are installed in my system, which renderers are enable in UMS or anything you might suspect, just let me know and I'll give it a try.
Again, thanks a lot for your help.
javieryi
on 16 Nov 2018
I'll let you know if I think of anything but I have nothing right now. My idea was it was probably created in v5. If you can find the version it started in, then we can find the bug for sure by process of elimination
SubJunk
on 17 Nov 2018
@javieryi As @Nadahar explained us 2 years ago, it is flawed by design, so only more or less lucky hacks and tricks can be done by now, or a general refactoring IMO.
I don't think you will get any versions later than 3.6.x working without getting excessive CPU and memory use after some constinual use time. More the version get old less should get the problem i guess ;)
So i'm afraid that if your target is to use UMS as a server you will have to do a regular automatic reboot as most users do by now.
Edit: probably between 3.3.0 and 3.6.4?
Sami32
on 17 Nov 2018
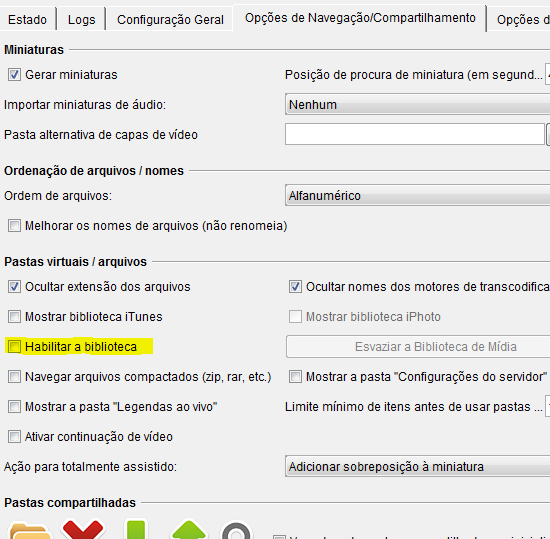
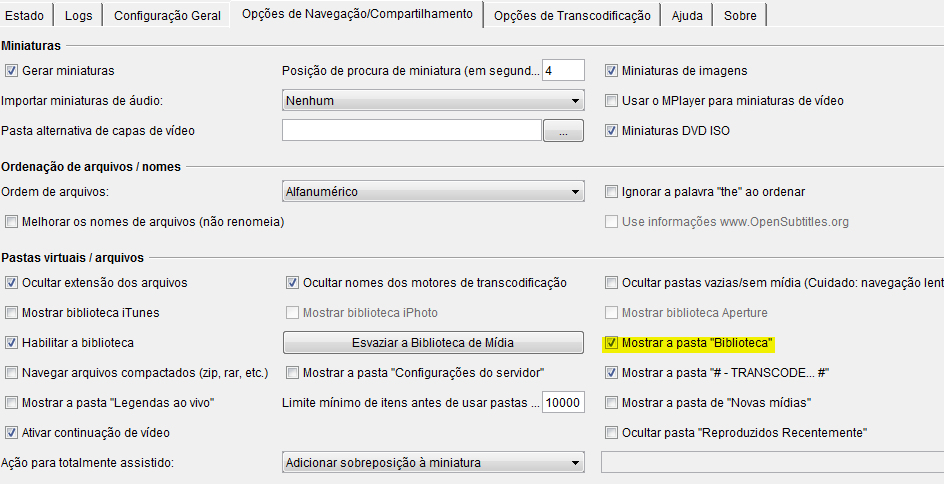
I was also getting this problem (Was giving java.lang.OutOfMemoryError: GC overhead limit exceeded), I decided to disable the "Enable Library" option in "Browsing / Sharing Options".
This behavior does not occur in UMS 6.8.0.
My version now is 7.6.0
 theafien
on 17 Nov 2018
theafien
on 17 Nov 2018
I was also getting this problem (Was giving java.lang.OutOfMemoryError: GC overhead limit exceeded), I decided to disable the "Enable Library" option in "Browsing / Sharing Options".
This behavior does not occur in UMS 6.8.0.
My version now is 7.6.0
The creation of the library is likely to be causing excessive memory usage, triggering various anomalies because of the lack of memory.
theafien
on 17 Nov 2018
I can't be 100% sure, but I believe I disabled that option in every version, but that's easily checked in the logs.
Since I'm not a programmer and it doesn't take a lot of effort to test, I'm willing to test every other version to find where the bug (or whatever it is) was introduced if that helps the developers, then it should be at least easier to track the new code that causes it.
Thanks a lot, your help is truly appreciated.
javieryi
on 17 Nov 2018
@theafien I think that is a different bug, and have you checked that it still happens in 7.6.0? Because we did big improvements and fixes to memory use after the v7 release. Please try enabling it if you haven't :)
@javieryi thanks for all of the time you are putting into this. Very interested to know if it is in those earlier versions :)
SubJunk
on 17 Nov 2018
That testing version "UMS-GlobalIdRepoMemoryAware-f04036c" + Java 8 "jre-8u191-windows-x64", bug still present. I attach the logs.
Going now for UMS 3.6.4 + Java 7 "jre-7u80-windows-x64", I'll report back.
javieryi
on 17 Nov 2018
@javieryi try disabling "Show folder 'Library'"
@SubJunk i'm testing in 7.6.0, in 6.8.0 its normal. I do another tests and see of if checked "Show folder 'Library'" the memory usage is strong without play any video and CPU peak usage
Memory usage with option active

With option disabled

_Note: I appreciate the work you do to keep the project active and functional._
theafien
on 18 Nov 2018
@theafien the "cache/biblioteca" does use more memory by design, it is a memory cache. If the program is crashing for you in 7.6.0 then that is a bug, but high memory usage is not a bug. Does it crash?
SubJunk
on 18 Nov 2018
@SubJunk no, just stop responding to the application and stream frozen, so I close. I'll look better.
Is normal 240k instance of GlobalIdRepo?
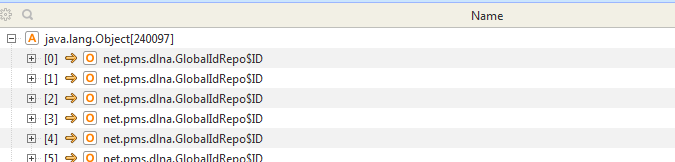
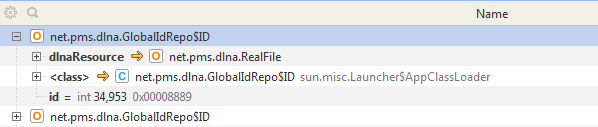
I See too very MessageEvent waiting garbage collection and looking my log have this
Note: My video library have 600 videos +/-
theafien
on 18 Nov 2018
@theafien I want to keep this issue focused so I have created the new one https://github.com/UniversalMediaServer/UniversalMediaServer/issues/1680 for us to discuss this :)
SubJunk
on 18 Nov 2018
UMS 3.6.4 + Java 7 "jre-7u80-windows-x64", still get the bug. Logs attached.
Moving to UMS 2.6.5.
javieryi
on 22 Nov 2018
@javieryi hi :) any problems with v2 so far?
SubJunk
on 2 Dec 2018
Sorry for the radio silence, had personal stuff going on this last week, sadly UMS 2.6.5 + Java 7 "jre-7u80-windows-x64", I still got the 100% bug, although it took several days to happen.
Also note that since 3.6.4 the lock on the computer is so heavy that I needed to have a hard reset on computer, so needed to test again lowering the java process cpu priority in order to be able to get the logs.
Logs attached.
Moving to 1.6.0
javieryi
on 2 Dec 2018
I tracked down the issue to a particular media file. Removing it from the library fixes 100% CPU usage. I thought that disabling thumbnails could help but it didn't.
 SergiusTheBest
on 2 Dec 2018
SergiusTheBest
on 2 Dec 2018
@javieryi yikes, it may have just always been there! I wonder if what @SergiusTheBest said might relate to you too - if 1.6.0 still has the bug, you could try sharing fewer folders to try to narrow down which media file it was. Is that how you narrowed it down, Sergius?
@SergiusTheBest can you let us know which file it was? Feel free to let me know on the forum for privacy. If I have the file I might be able to fix the bug.
SubJunk
on 2 Dec 2018
Sure I can do that, that's kind of what I meant when I pointed that the issue might come from some other place that we weren't looking into.
I wonder if it would be helpful to scan the files with some sort of software to get the media information like MediaInfo so maybe some specific one is giving trouble somewhere.
This is an example result of this MediaInfo tool, let me know if such thing is helpful in any way or any other that could provide more helpful information:
Complete name               : E:\video\somethingorother.mp4
Format                      : MPEG-4
Format profile              : Base Media
Codec ID                    : isom (isom/iso2/avc1/mp41)
File size                   : 1.55 GiB
Duration                    : 1 h 36 min
Overall bit rate            : 2 304 kb/s
Writing application         : Lavf58.19.100

Video
ID                          : 1
Format                      : AVC
Format/Info                 : Advanced Video Codec
Format profile              : [email protected]
Format settings             : CABAC / 4 Ref Frames
Format settings, CABAC      : Yes
Format settings, ReFrames   : 4 frames
Codec ID                    : avc1
Codec ID/Info               : Advanced Video Coding
Duration                    : 1 h 36 min
Bit rate                    : 2 150 kb/s
Width                       : 1 920 pixels
Height                      : 800 pixels
Display aspect ratio        : 2.40:1
Frame rate mode             : Constant
Frame rate                  : 23.976 (24000/1001) FPS
Color space                 : YUV
Chroma subsampling          : 4:2:0
Bit depth                   : 8 bits
Scan type                   : Progressive
Bits/(Pixel*Frame)          : 0.058
Stream size                 : 1.45 GiB (93%)
Writing library             : x264 core 157
Encoding settings           : cabac=1 / ref=4 / deblock=1:-1:-1 / analyse=0x3:0x133 / me=umh / subme=9 / psy=1 / psy_rd=1.00:0.15 / mixed_ref=1 / me_range=24 / chroma_me=1 / trellis=2 / 8x8dct=1 / cqm=0 / deadzone=21,11 / fast_pskip=0 / chroma_qp_offset=-3 / threads=18 / lookahead_threads=1 / sliced_threads=0 / nr=0 / decimate=1 / interlaced=0 / bluray_compat=0 / constrained_intra=0 / bframes=3 / b_pyramid=2 / b_adapt=2 / b_bias=0 / direct=3 / weightb=1 / open_gop=0 / weightp=2 / keyint=250 / keyint_min=23 / scenecut=40 / intra_refresh=0 / rc_lookahead=60 / rc=2pass / mbtree=1 / bitrate=2150 / ratetol=1.0 / qcomp=0.60 / qpmin=0 / qpmax=69 / qpstep=4 / cplxblur=20.0 / qblur=0.5 / vbv_maxrate=31250 / vbv_bufsize=31250 / nal_hrd=none / filler=0 / ip_ratio=1.40 / aq=1:1.00
Codec configuration box     : avcC

Audio
ID                          : 2
Format                      : AAC LC
Format/Info                 : Advanced Audio Codec Low Complexity
Codec ID                    : mp4a-40-2
Duration                    : 1 h 36 min
Bit rate mode               : Constant
Bit rate                    : 150 kb/s
Channel(s)                  : 2 channels
Channel layout              : L R
Sampling rate               : 48.0 kHz
Frame rate                  : 46.875 FPS (1024 SPF)
Compression mode            : Lossy
Stream size                 : 104 MiB (7%)
Default                     : Yes
Alternate group             : 1
@javieryi UMS uses MediaInfo internally, it is how we analyse files :) So yes if there is a file that is causing this, we can try to see if there is a reason we can see. The problem with this issue is there are are many things that could hypothetically cause Java to hang like this, and the reason will be different for each user. We just have to keep looking until we find your one :)
SubJunk
on 3 Dec 2018
Is that how you narrowed it down, Sergius?
@SubJunk It's just stuck updating status, so it's easy to find a problem folder:
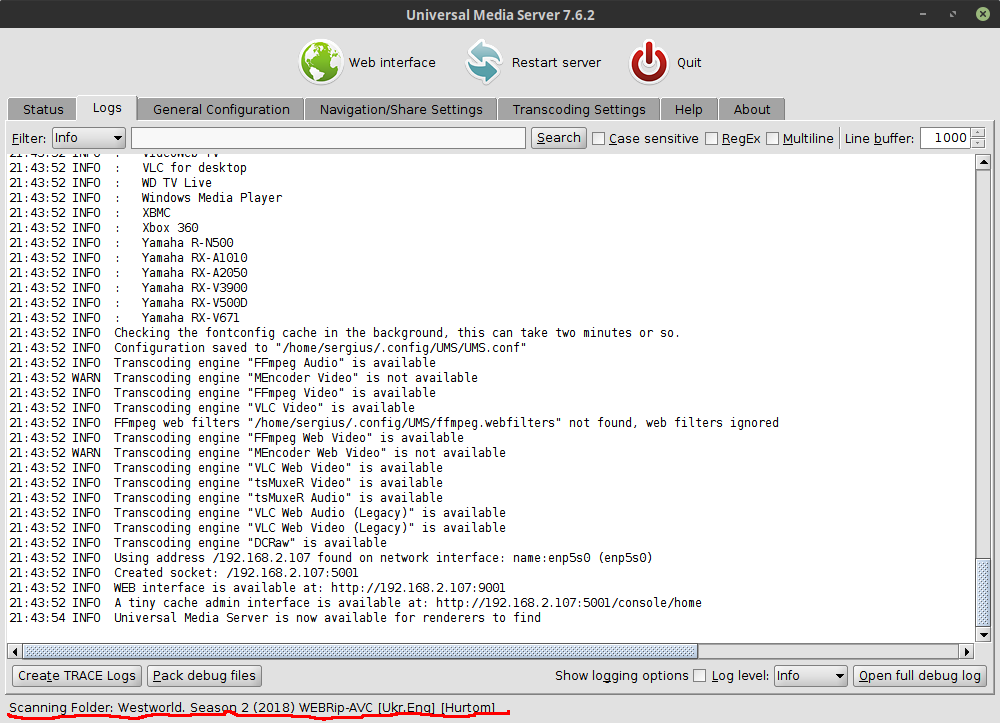
SergiusTheBest
on 3 Dec 2018
@SergiusTheBest can you let us know which file it was? Feel free to let me know on the forum for privacy. If I have the file I might be able to fix the bug.
@SubJunk I uploaded the file here.
SergiusTheBest
on 3 Dec 2018
Thanks @SergiusTheBest that file doesn't cause any problems for me even if I rename it to Westworld.S02E01 (2018) WEBRip-AVC [Ukr.Eng] [Hurtom].mkv. If you want help with that maybe you can make a new issue for it since it is almost certainly a different bug to the one this issue is about :)
SubJunk
on 6 Dec 2018
@SubJunk Ok, then I'll try to debug it and create a more detailed issue (or maybe PR).
SergiusTheBest
on 6 Dec 2018
PR would be awesome! If you have any questions or want help with anything let us know
SubJunk
on 6 Dec 2018
@SergiusTheBest I could be wrong but you seem to use Linux.
MediaInfo have such issue in oldest versions so i'm wondering if you are not using an old MI version.
Even if it is not the case i would suggest you to test with an other MI version, just to be sure that doesn't come from MediaInfo.
Sami32
on 7 Dec 2018
Good idea @Sami32
SubJunk
on 7 Dec 2018
@SubJunk
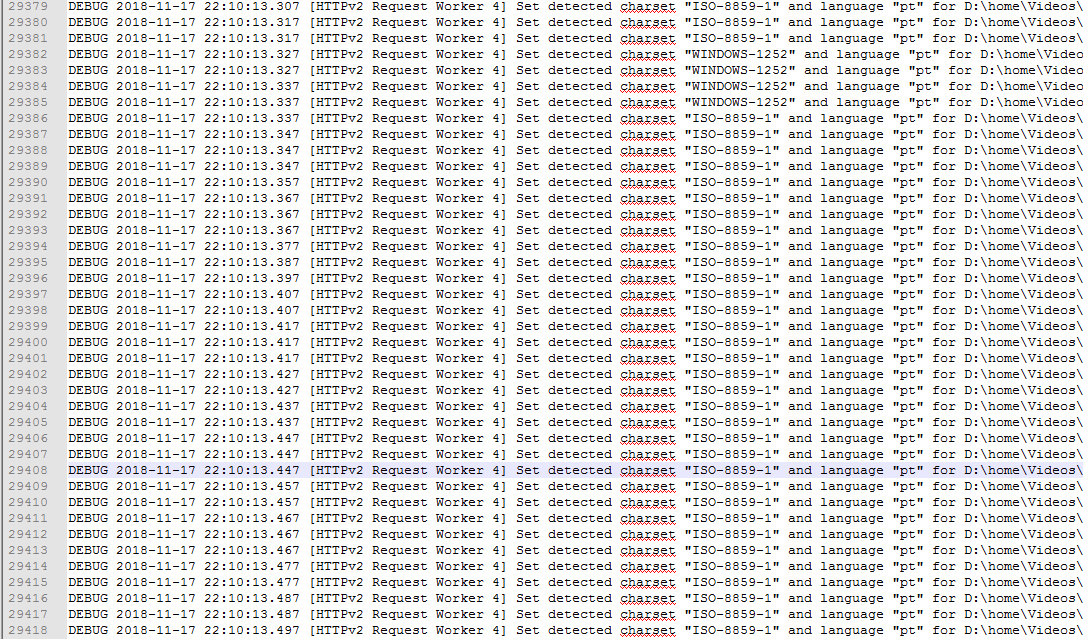
I traced down my issue to adobe xmp parser. It turned out that the embedded thumbnail had a very large metadata (xmp with over 100000 nodes) and the parser is not very efficient. There is a post on adobe forum about that. I made a fix for com.drewnoakes:metadata-extractor and sent them a PR.
Here is the stack trace if you're interested:
"Library Scanner"
    at com.adobe.xmp.impl.ParseRDF.rdf_LiteralPropertyElement
    at com.adobe.xmp.impl.ParseRDF.rdf_PropertyElement
    at com.adobe.xmp.impl.ParseRDF.rdf_PropertyElementList
    at com.adobe.xmp.impl.ParseRDF.rdf_NodeElement
    at com.adobe.xmp.impl.ParseRDF.rdf_ResourcePropertyElement
    at com.adobe.xmp.impl.ParseRDF.rdf_PropertyElement
    at com.adobe.xmp.impl.ParseRDF.rdf_PropertyElementList
    at com.adobe.xmp.impl.ParseRDF.rdf_NodeElement
    at com.adobe.xmp.impl.ParseRDF.rdf_NodeElementList
    at com.adobe.xmp.impl.ParseRDF.rdf_RDF
    at com.adobe.xmp.impl.ParseRDF.parse
    at com.adobe.xmp.impl.XMPMetaParser.parse
    at com.adobe.xmp.XMPMetaFactory.parseFromBuffer
    at com.adobe.xmp.XMPMetaFactory.parseFromBuffer
    at com.drew.metadata.xmp.XmpReader.extract(XmpReader.java:165)
    at com.drew.metadata.xmp.XmpReader.extract(XmpReader.java:145)
    at com.drew.metadata.xmp.XmpReader.extract(XmpReader.java:135)
    at com.drew.metadata.xmp.XmpReader.readJpegSegments(XmpReader.java:124)
    at com.drew.imaging.jpeg.JpegMetadataReader.processJpegSegmentData(JpegMetadataReader.java:134)
    at com.drew.imaging.jpeg.JpegMetadataReader.process(JpegMetadataReader.java:126)
    at com.drew.imaging.jpeg.JpegMetadataReader.readMetadata(JpegMetadataReader.java:77)
    at com.drew.imaging.jpeg.JpegMetadataReader.readMetadata(JpegMetadataReader.java:84)
    at net.pms.image.ImagesUtil.getMetadata(ImagesUtil.java:1717)
    at net.pms.image.ImagesUtil.getMetadata(ImagesUtil.java:1607)
    at net.pms.image.ImagesUtil.getMetadata(ImagesUtil.java:1574)
    at net.pms.image.ImagesUtil.transcodeImage(ImagesUtil.java:1257)
    at net.pms.image.ImagesUtil.transcodeImage(ImagesUtil.java:934)
    at net.pms.dlna.DLNAThumbnail.toThumbnail(DLNAThumbnail.java:425)
    at net.pms.dlna.LibMediaInfoParser.parse(LibMediaInfoParser.java:97)
    at net.pms.configuration.FormatConfiguration.parse(FormatConfiguration.java:512)
    at net.pms.formats.Format.parse(Format.java:315)
    at net.pms.dlna.RealFile.resolve(RealFile.java:210)
    at net.pms.dlna.DLNAResource.syncResolve(DLNAResource.java:1571)
    at net.pms.dlna.DLNAResource.run(DLNAResource.java:1368)
    at net.pms.dlna.RealFile.isValid(RealFile.java:73)
    at net.pms.dlna.DLNAResource.addChild(DLNAResource.java:625)
    at net.pms.dlna.MapFile.manageFile(MapFile.java:273)
    at net.pms.dlna.MapFile.analyzeChildren(MapFile.java:329)
    at net.pms.dlna.RootFolder.scan(RootFolder.java:292)
    at net.pms.dlna.RootFolder.scan(RootFolder.java:250)
    at net.pms.dlna.DLNAMediaDatabase.run(DLNAMediaDatabase.java:1455)
    at java.lang.Thread.run(Thread.java:748)
If wait long enough CPU usage will drop to normal. Just need to give time for parsing enormous xmp metadata.
SergiusTheBest
on 8 Dec 2018
@SergiusTheBest That is really brilliant work! Thanks for figuring this one out :+1:
 Nadahar
on 8 Dec 2018
Nadahar
on 8 Dec 2018
@SergiusTheBest very nice investigation and thanks for submitting the fix to them! I'll watch for it and bump the version when they merge :)
SubJunk
on 9 Dec 2018
Sorry about being a bit AWOL, but I've been busy with RL, so far UMS 1.6.0 seems to be holding, no issues, will keep it going just in case it takes even longer to show up.
Do I understand that according to the last few messages that the issue has been found and addressed?
I Hope I understood it right and thanks to @SergiusTheBest for finding the issue and providing a fix. Thanks also to @SubJunk and other developers for being on top of the issue and providing help.
Another proof of why open source software rocks!
javieryi
on 12 Dec 2018
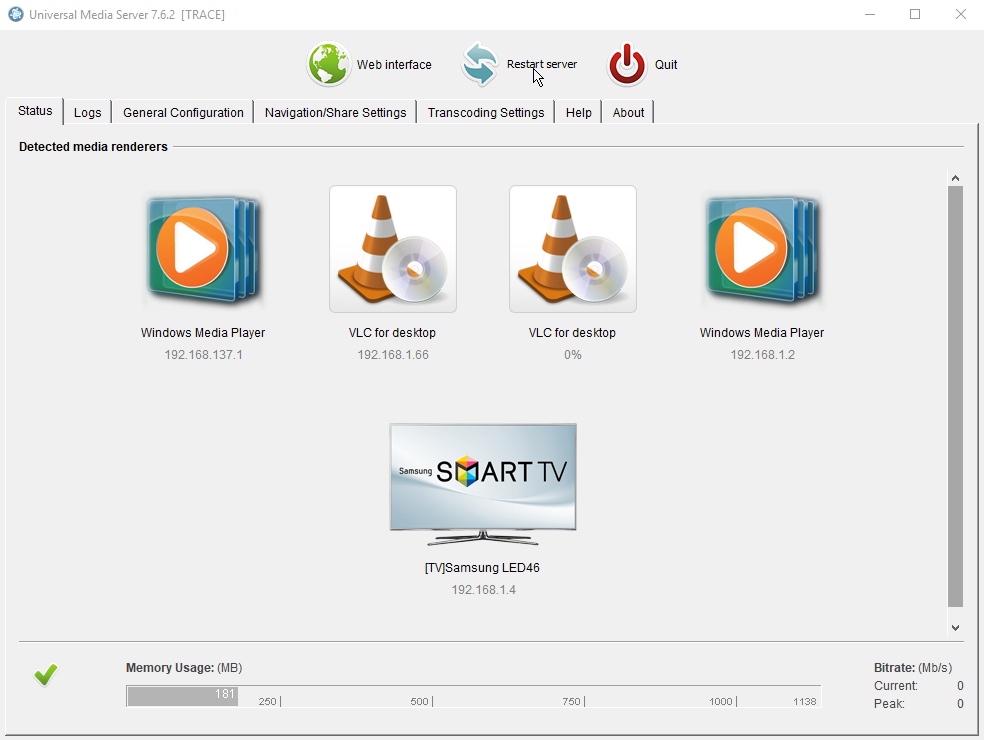
@javieryi I'm not sure that my issue has the same cause as your one (despite they both lead to 100% CPU usage). Could you send a screenshot like in my https://github.com/UniversalMediaServer/UniversalMediaServer/issues/1652#issuecomment-443849510?
SergiusTheBest
on 12 Dec 2018
Here you are @SergiusTheBest , mind I'm using now an old version, but it doesn't show the "scanning..." bit at the bottom.
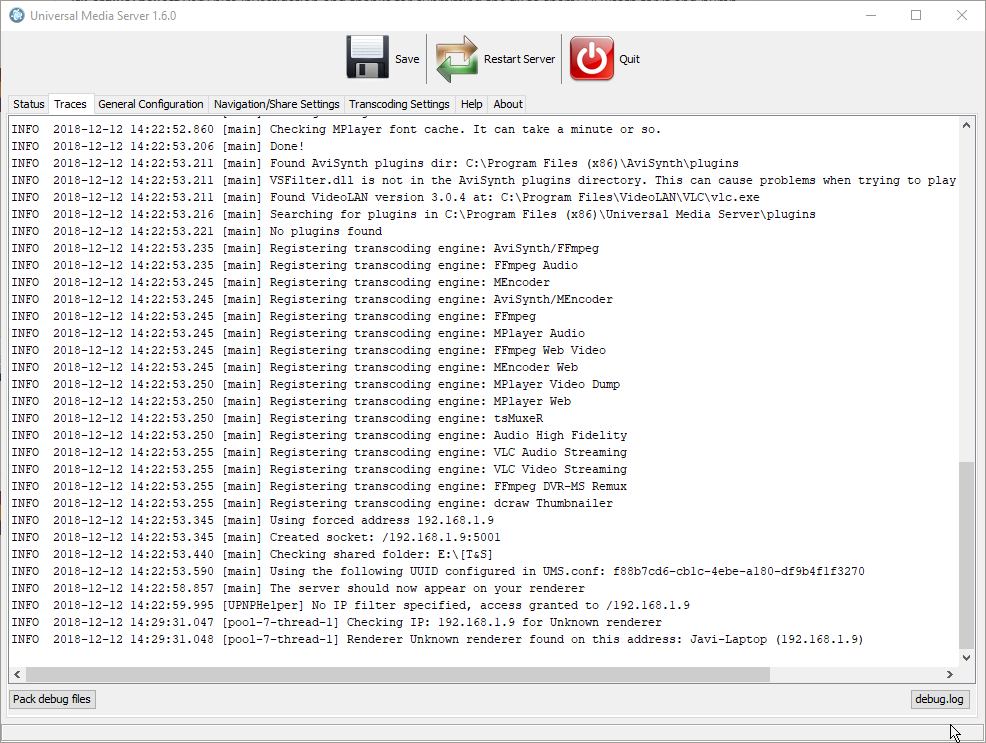
All of that and then some should show in the logs that I've been attaching to every version I've tried as instructed, if you want to take a deeper look into it.
UMS 7.5.0 post
UMS 6.7.4 post
UMS 5.5.0 post
UMS-GlobalIdRepoMemoryAware-f04036c (Testing version) post
UMS 4.4.0 (Sadly I was unable to retrieve this logs)
UMS 3.6.4 post
UMS 2.6.5 post
javieryi
on 12 Dec 2018
@javieryi To troubleshoot this issue you need to capture java thread dumps. This can be done with a tool jstack from JDK (you need to install JDK, not JRE):
- Start UMS
- Find its process id (PID). Can be done via task manager (search for
javaprocess). - Find
jstackin JDK folder (in Program Files) - Run it in console:
jstack <pid> > C:\logs\dump.txt, for examplejstack 29544 > C:\logs\dump.txt
SergiusTheBest
on 12 Dec 2018
@javieryi that's really good if v1 does not have this problem, it gives us a starting point. Will be interested to see what shows up following @SergiusTheBest 's steps (remember to do that on the latest version)
SubJunk
on 13 Dec 2018
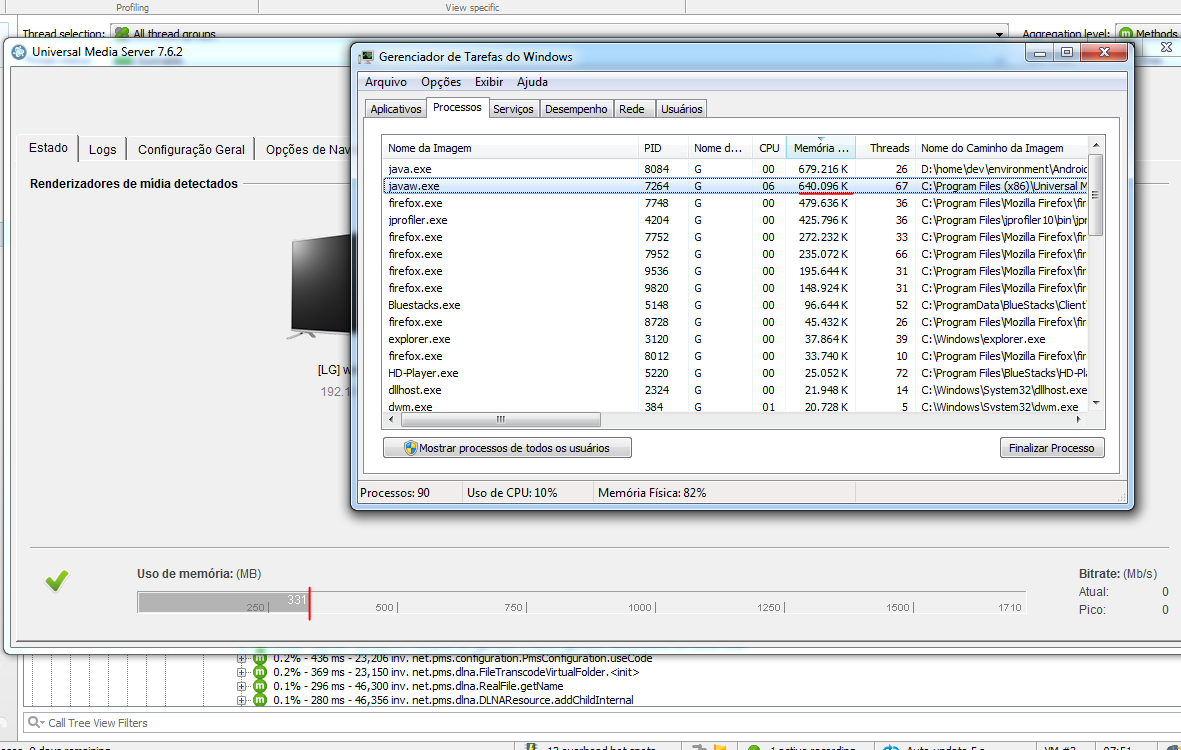
I'm back to UMS 7.6.2 standalone x64, JDK ready, all tested and working, as instructed by @SergiusTheBest
, now waiting for an accident to happen xDD
javieryi
on 13 Dec 2018
Didn't take too long, logs attached.
ums_7.6.2_standalone_x64_dbg.zip
ums_7.6.2_standalone_x64_java_dump.zip
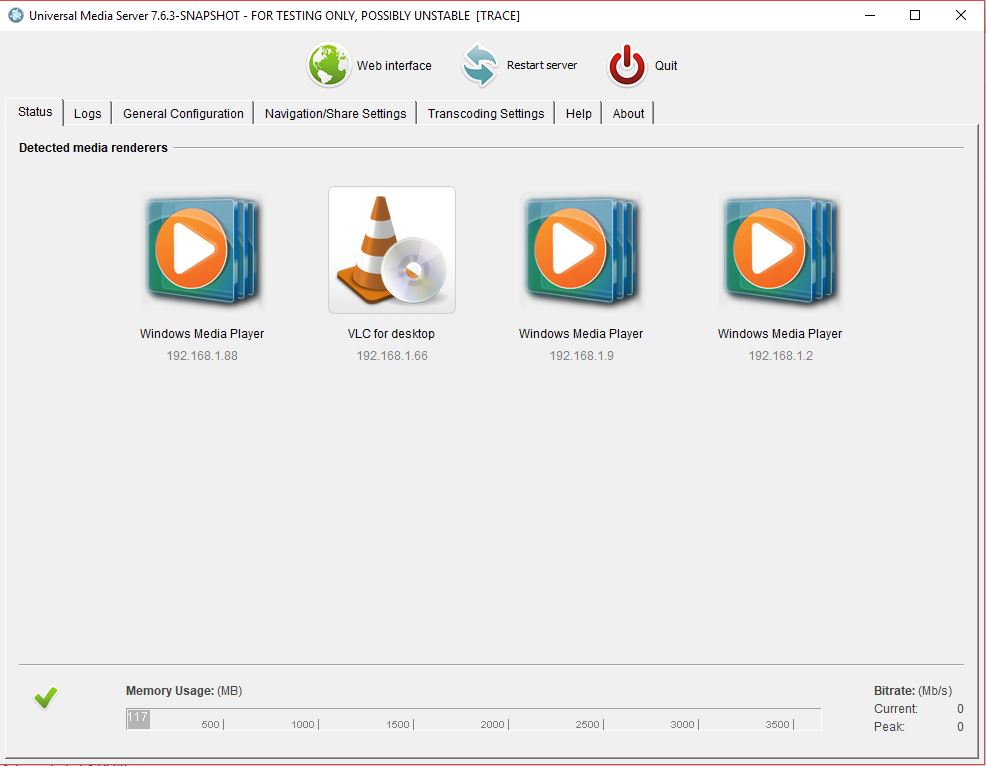
As a side note, on the status screen the memory usage was bouncing up and down continuously.

Hope this helps, please let me know how else can I be useful.
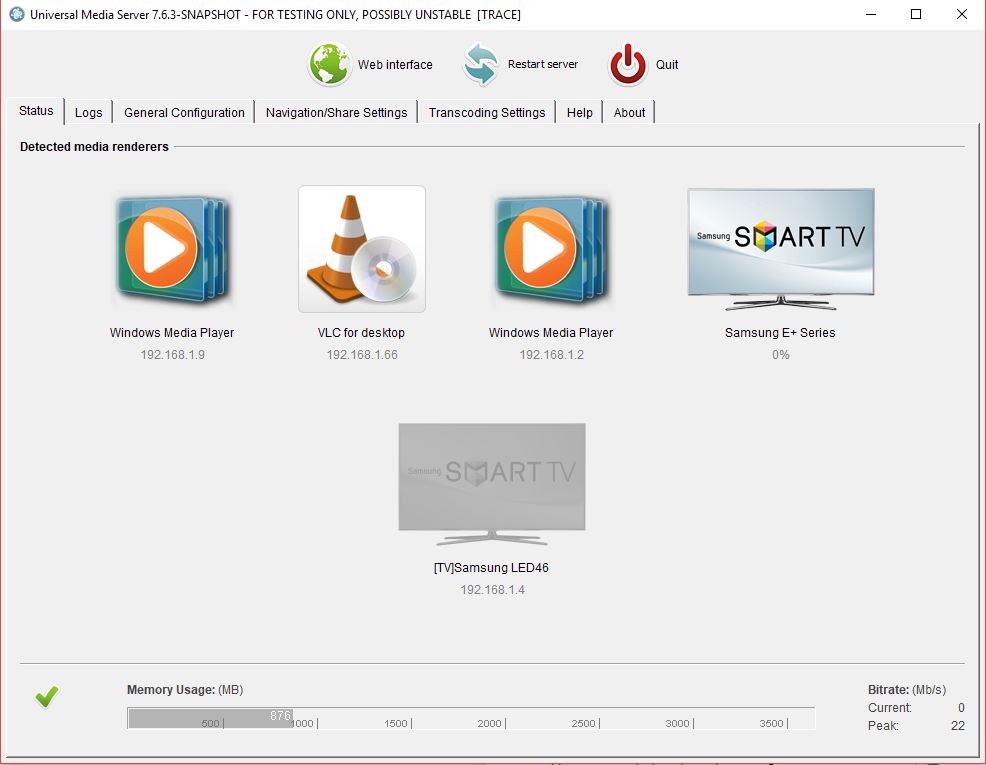
PS: for reference, after relaunching a fresh UMS this is what java memory usage looks like:

javieryi
on 13 Dec 2018
If it is related to high memory use you might want to try a build we have been testing lately https://www.spirton.com/uploads/UMS/UMS-weak-4079698.exe
SubJunk
on 13 Dec 2018
@javieryi I can see nothing wrong in thread dumps :(
@SubJunk Once I faced the similar behavior in another Java app: when it reached memory limit garbage collector went crazy and consumed a lot of CPU. Increasing memory limit helped in that case. I'm not sure how to do that in windows UMS build.
SergiusTheBest
on 14 Dec 2018
@SergiusTheBest yes it seems to often be related to memory use for us too. We are working hard to reduce our memory use and make our classes more recyclable lately. We default to 1280mb on 64-bit Windows which seems to be near the limit of what we can safely set - we have tried higher in the past but users reported problems
SubJunk
on 15 Dec 2018
Generally I used on parents PC value 4000 on 8GB and later 16GB Win computer without problems :)
 ExSport
on 15 Dec 2018
ExSport
on 15 Dec 2018
I think it's wrong to assume that one reason is causing this. High CPU use can probably be caused by a whole number of reasons. I haven't studied this closely, but for me it seems like there's many more (Cling) threads running that I would expect. Not that this itself would cause high CPU use, but it could very well be a symptom of the real problem.
Maybe something is making them very slow to respond, so the renderer(s) keep making new requests which spawns new threads that don't finish either...
Nadahar
on 15 Dec 2018
Just in case it's of any use, logs and java dump on the testing version:
javieryi
on 17 Dec 2018
@javieryi is the log file and java dump from after the bug had started happening on that version?
SubJunk
on 17 Dec 2018
Yes, forgot to say, bug happened and took the logs in case they are useful somehow.
javieryi
on 17 Dec 2018
Just as a test, I've setup a virtual machine in which I'm fresh installing the same software I usually run on my computer and also UMS on it and keep it running to see if the bug appears there too, maybe something isolated related to my own machine setup, because of M$ and stuff... xDD
javieryi
on 17 Dec 2018
@javieryi I can't see any clues in the logs, it's a head-scratcher this one!
SubJunk
on 18 Dec 2018
@SubJunk I see in logs Maximum JVM Memory: 683 MiB. Can we increase that for a test?
SergiusTheBest
on 18 Dec 2018
@SergiusTheBest good spotting, but the memory use has been set to 1280 in other tests that @javieryi has done so it doesn't seem to affect this problem, unless you mean set it much higher like 4000 like @ExSport said? Even then I would expect that the problem just takes longer to happen instead of going away
SubJunk
on 18 Dec 2018
@SubJunk Yes, I think 4000 will be good for a test.
SergiusTheBest
on 18 Dec 2018
@javieryi are you able to do that please?
SubJunk
on 18 Dec 2018
Sure I can,I had to do a reinstall, because coouldn't find the option in the conf files.
I'll report back with results.
PS: for reference again: this is java.exe memory usage fresh launched with UMS set to use 4096Mb.

javieryi
on 18 Dec 2018
It is in UMS registry.
ExSport
on 18 Dec 2018
Sh*t hit the fan again, UMS-weak-4079698 + Java 8 1.8.0_192-b12 Memory 4096Mb, logs attached.
UMS-weak-4079698_jstack_dump.zip
UMS-weak-4079698_dbg.zip

On status screen memory usage was bouncing between about 80Mb-140Mb
Any other advice or debugging I can do to spread some light on this issue?
javieryi
on 19 Dec 2018
I assume it is the mediainfo that is causing excessive CPU usage -- so the cause is random (because it depends on some video/subtitle file) --. @javieryi download JProfiler free and run CPU profiler.
JProfiler link download: https://www.ej-technologies.com/download/jprofiler/files
JProfiler Config

CPU Recording
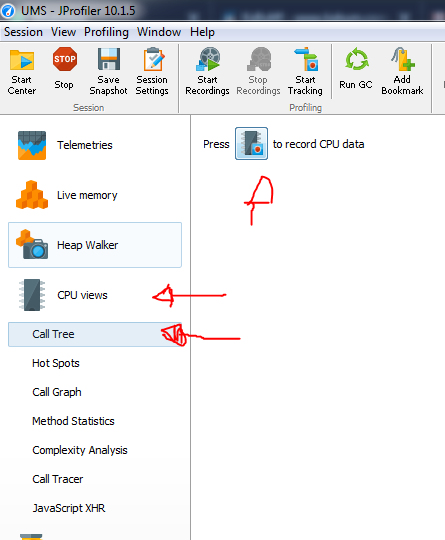
After save the snapshot
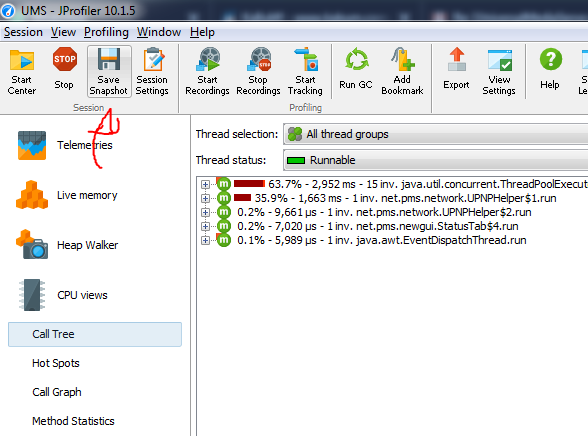
post your jps file.
theafien
on 19 Dec 2018
You could also try using the latest version of MediaInfo because according to their changelog they have fixed memory leaks and crashes. I can put together a build for you to test that has that version
SubJunk
on 19 Dec 2018
I've setup at the moment jprofiler and I am again waiting for the bug to happen, but please throw at me whatever you think can help getting useful feedback.
I'm not a java programmer, but programming is not completely unknown to me, and I can follow instructions as long as they are given xDD
javieryi
on 19 Dec 2018
Please replace the files in this zip file with the ones in the UMS installation directory C:\Program Files (x86)\Universal Media Server
It might break some other things like the detection of some files (just maybe, I haven't checked) but it would be good to see if it affects this bug.
I should say though I don't think it is likely a problem with MediaInfo because the bug isn't happening at a predictable time like during a scan or when you browse a certain folder, so let's not get our hopes up about this one :)
SubJunk
on 19 Dec 2018
@SubJunk with the new MediaInfo have the expressive memory reduce
Both runned by 7+- minutes in profiler without play video
With new DLL
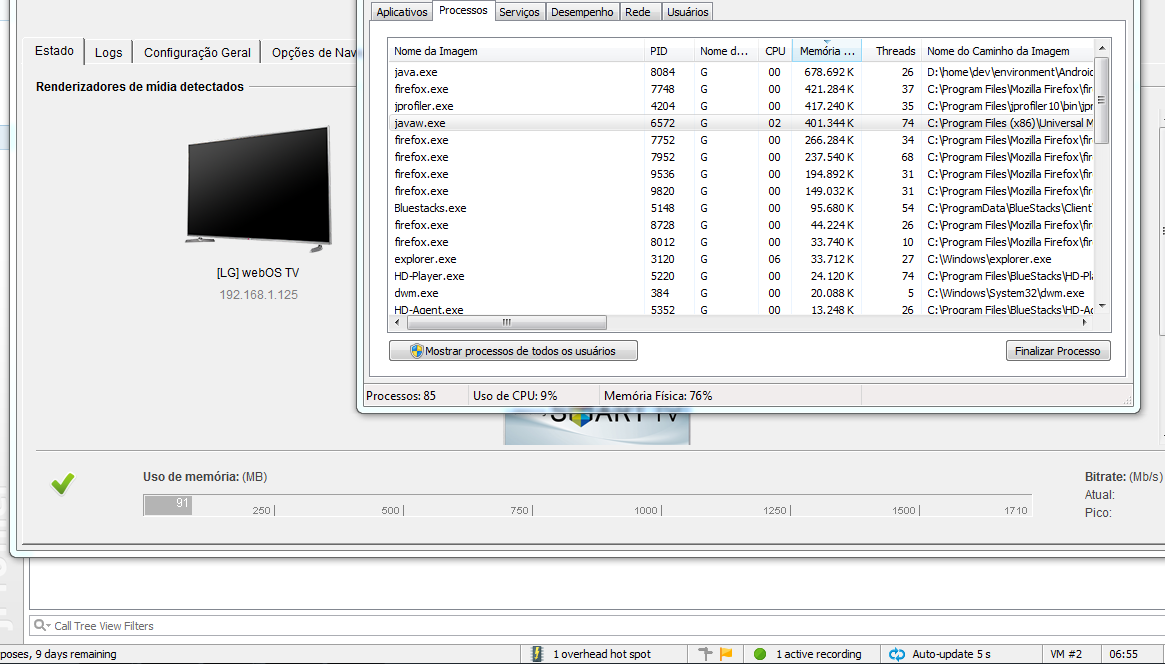
With Older DLL
theafien
on 20 Dec 2018
Bug appeared again, logs attached:
Memory bouncing from 140Mb to 1.7Gb or so in UMS status screen.

UMS_7.6.3_snapshot+Mediainfo_jps.zip
UMS-weak-4079698+Mediainfo_dbg.zip
javieryi
on 21 Dec 2018
@javieryi try disable http v2 engine..
theafien
on 7 Feb 2019
I think this was likely fixed in v8 but please reopen if it's still not fixed in latest versions
SubJunk
on 17 Feb 2020
Related issues
 Residentcl
·
136Comments
Residentcl
·
136Comments
 Lincoln-G
·
71Comments
SubJunk
·
41Comments
Lincoln-G
·
71Comments
SubJunk
·
41Comments
 MediaMania1
·
40Comments
MediaMania1
·
40Comments
 rd1
·
57Comments
rd1
·
57Comments
Most helpful comment
@javieryi To troubleshoot this issue you need to capture java thread dumps. This can be done with a tool
jstackfrom JDK (you need to install JDK, not JRE):javaprocess).jstackin JDK folder (in Program Files)jstack <pid> > C:\logs\dump.txt, for examplejstack 29544 > C:\logs\dump.txt