Tpot: TPOT is not performing well for Timeseries Data
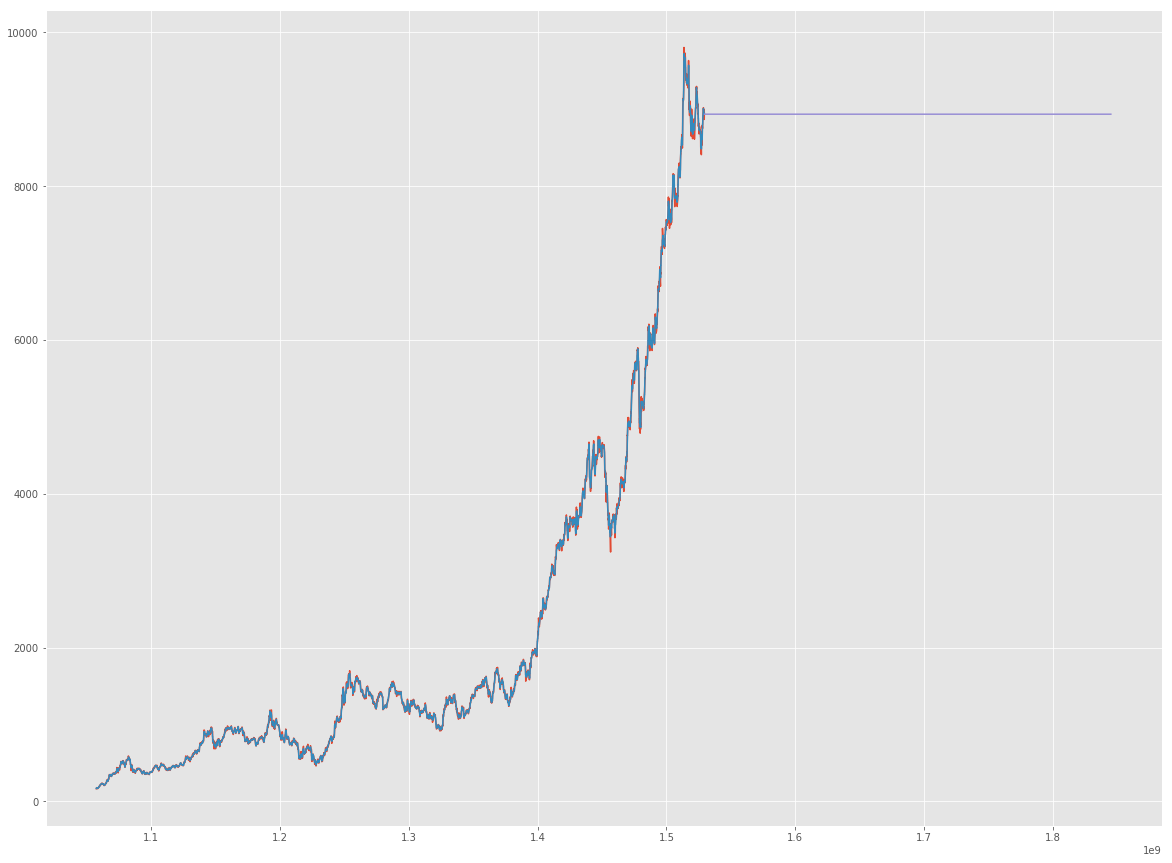
I am pulling out data from the Quandl API, and using the stock data to predict future stock prices, the model is a linear model and fits well with training data, but provides a straight line for future data. I have converted the dates to a standard int format before processing so I don't know what I am doing wrong :( , any help is appreciated: like code examples and stuff.....
Process to reproduce the issue
[ordered list the process to finding and recreating the issue, example below]
- Pull Quandl Data
- Convert Dates to numeric format
- Use the TPOT regressor to fit
- Try predicting future data points and plotting but recieve a linear output :(
 ritabratamaiti
All 17 comments
@rhiever
ritabratamaiti
on 20 Jun 2018
Are you performing cross-validation correctly? e.g. using TimeSeriesSplit?
 rhiever
on 20 Jun 2018
rhiever
on 20 Jun 2018
tpot = TPOTRegressor(generations=5, population_size=50,verbosity=2, cv=TimeSeriesSplit(n_splits=15))
This is the way I am calling the regressor, and then I am using tpot.fitted_pipeline_ for making predictions...
ritabratamaiti
on 20 Jun 2018
How many samples do you have in the time series? How many features?
My next suggestion is to give TPOT more time to explore more pipelines. That entails increasing the generations and population_size parameters. I recommend 100 and 100 for both parameters to start with, and give TPOT plenty of time (and patience :-) ) to work.
rhiever
on 20 Jun 2018
[3721 rows x 2 columns]; 1 column for dates the other one is target......
ritabratamaiti
on 20 Jun 2018
Gotcha. Is there a pattern based on the date in the time series? Otherwise you'll likely need more features to build an effective predictive model.
rhiever
on 20 Jun 2018
ritabratamaiti
on 20 Jun 2018
The model fits the training data, but on unseen data it is linear
ritabratamaiti
on 20 Jun 2018
Are there other features except of date in your input features (X)?
 weixuanfu
on 20 Jun 2018
weixuanfu
on 20 Jun 2018
I am afraid not, how do I incorporate more features in stock data?
ritabratamaiti
on 20 Jun 2018
Stock price can’t be predicted by date only. I think you need merge more features (if there are any from that API) with date.
weixuanfu
on 20 Jun 2018
FYI that looks like a massively overfit model. It probably outputs a flat line on new data because that is the last value is learned to predict at the final time point. You definitely need more features to predict stock price here, but that is outside the purview of TPOT support.
I suggest Googling "python stock price prediction" and there will be dozens of articles covering the topic, including how to integrate additional features into the predictive model.
rhiever
on 20 Jun 2018
Thanks! @rhiever @weixuanfu
ritabratamaiti
on 26 Jun 2018
FYI that looks like a massively overfit model. It probably outputs a flat line on new data because that is the last value is learned to predict at the final time point. You definitely need more features to predict stock price here, but that is outside the purview of TPOT support.
I suggest Googling "python stock price prediction" and there will be dozens of articles covering the topic, including how to integrate additional features into the predictive model.
- can we use time series with TPOT and what transformations could we do for this dateTime column
- for catégorical data should we transform the to numerical or TPOT do that for us
- for missing values in numerical cases, we don't need to handle them, is TPOT do these transformations for us.
Thank u for anyone who will help me with one or all question, I'm working on my graduation project and I need these answers
 ikramelmbarki
on 7 May 2020
ikramelmbarki
on 7 May 2020
I am pulling out data from the Quandl API, and using the stock data to predict future stock prices, the model is a linear model and fits well with training data, but provides a straight line for future data. I have converted the dates to a standard int format before processing so I don't know what I am doing wrong :( , any help is appreciated: like code examples and stuff.....
Process to reproduce the issue
[ordered list the process to finding and recreating the issue, example below]
- Pull Quandl Data
- Convert Dates to numeric format
- Use the TPOT regressor to fit
- Try predicting future data points and plotting but recieve a linear output :(
how did you transform your column to numerical and what type has before this transformation please
ikramelmbarki
on 7 May 2020
1. can we use time series with TPOT and what transformations could we do for this dateTime column
The input dataset should sort based on date time column.
2. for catégorical data should we transform the to numerical or TPOT do that for us
Yes, the categorical should be transform to numerical. You may try OrdinalEncoder or OneHotEncoder in scikit-learn
3. for missing values in numerical cases, we don't need to handle them, is TPOT do these transformations for us.
TPOT should use SimpleImputer from scikit-learn to impute the missing values.
weixuanfu
on 7 May 2020
1. can we use time series with TPOT and what transformations could we do for this dateTime columnThe input dataset should sort based on date time column.
2. for catégorical data should we transform the to numerical or TPOT do that for usYes, the categorical should be transform to numerical. You may try
OrdinalEncoderorOneHotEncoderin scikit-learn3. for missing values in numerical cases, we don't need to handle them, is TPOT do these transformations for us.TPOT should use
SimpleImputerfrom scikit-learn to impute the missing values.
thank u so much for your reply
but for Time series, I would make this column as an index sort it and transform to int so I can use it as an input for TPOT
ikramelmbarki
on 8 May 2020
Related issues
 heaven00
·
4Comments
heaven00
·
4Comments
 KhaledSharif
·
5Comments
rhiever
·
4Comments
KhaledSharif
·
5Comments
rhiever
·
4Comments
 crawles
·
5Comments
crawles
·
5Comments
 TaherHabib
·
4Comments
TaherHabib
·
4Comments
Most helpful comment
FYI that looks like a massively overfit model. It probably outputs a flat line on new data because that is the last value is learned to predict at the final time point. You definitely need more features to predict stock price here, but that is outside the purview of TPOT support.
I suggest Googling "python stock price prediction" and there will be dozens of articles covering the topic, including how to integrate additional features into the predictive model.