Tmap: `panel.label.bg.color` has no effect when used with tmap_animation()
While the argument panel.label.bg.color works great while creating facets, it doesn't work when creating animations. The background label of the animation is always white.
Since tmap_animation() is based on facets, I was quite surprised by the behaviour.
Could you have a look at this?
Thanks!
Edit: Actually, I just realized that, by default, the background label for facets is gray, not white. So this is probably not a bug in fact, but something coded differently for tmap_animation().
It seems that implementing this option for animation might be possible, no? The animated gifs are really cool in a website. But that white background ruins the effect a fair bit depending on the background of the site...
 prosoitos
All 14 comments
data(NLD_muni)
data(NLD_prov)

tm = tm_shape(NLD_muni) +
    tm_borders() +
    tm_facets(by="province") +
    tm_fill("population", style="kmeans", convert2density = TRUE) +
tm_shape(NLD_prov) +
    tm_borders(lwd=4) +
    tm_facets(by="name")+tm_layout(panel.label.bg.color = "red")
tmap_animation(tm+tm_facets(nrow=1,ncol=1), "ani.gif", width = 300, height = 300)
gives me:

Is that what you are looking for? If not, please post a reproducible example.
 mtennekes
on 15 Dec 2020
mtennekes
on 15 Dec 2020
Oh! Your code works just fine...
Here is my code. Why isn't it working? What am I doing wrong?
data(NLD_prov)

anim_map <- tm_shape(NLD_prov) +
  tm_polygons(col = "#86baff") +
  tm_layout(
    title = "Agassiz Glacier",
    title.position = c("center", "top"),
    legend.position = c("left", "bottom"),
    legend.title.color = "#fcfcfc",
    legend.text.size = 1,
    bg.color = "#fcfcfc",
    inner.margins = c(0.08, 0, 0.08, 0),
    outer.margins = 0,
    panel.label.bg.color = "red"
  ) +
  tm_compass(
    type = "arrow",
    position = c("right", "top"),
    text.size = 0.7
  ) +
  tm_scale_bar(
    breaks = c(0, 0.5, 1),
    position = c("right", "BOTTOM"),
    text.size = 1
  ) +
  tm_facets(
    along = "name",
    free.coords = F
  )

tmap_animation(
  anim_map,
  filename = "ag.gif",
  inner.margins = c(0.08, 0, 0.08, 0),
  width = 300,
  height = 300,
  delay = 100
)

prosoitos
on 15 Dec 2020
Your original code output without the animation looks like this, ie for this part:
tm_shape(NLD_prov) +
  tm_borders() +
  tm_fill(col = "#86baff") +
  tm_layout(
    title = "Agassiz Glacier",
    title.position = c("center", "top"),
    legend.position = c("left", "bottom"),
    legend.title.color = "#fcfcfc",
    legend.text.size = 1,
    bg.color = "#fcfcfc",
    inner.margins = c(0.08, 0, 0.08, 0),
    outer.margins = 0,
    panel.label.bg.color = "red"
  ) +

  tm_compass(
    type = "arrow",
    position = c("right", "top"),
    text.size = 0.7
  ) +

  tm_scale_bar(
    breaks = c(0, 0.5, 1),
    position = c("right", "BOTTOM"),
    text.size = 1
  ) +

  tm_facets(
    along = "name",
    free.coords = F
  )
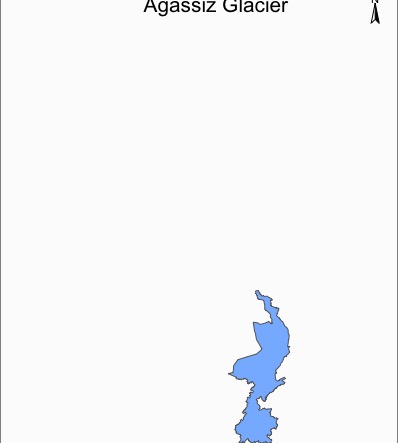
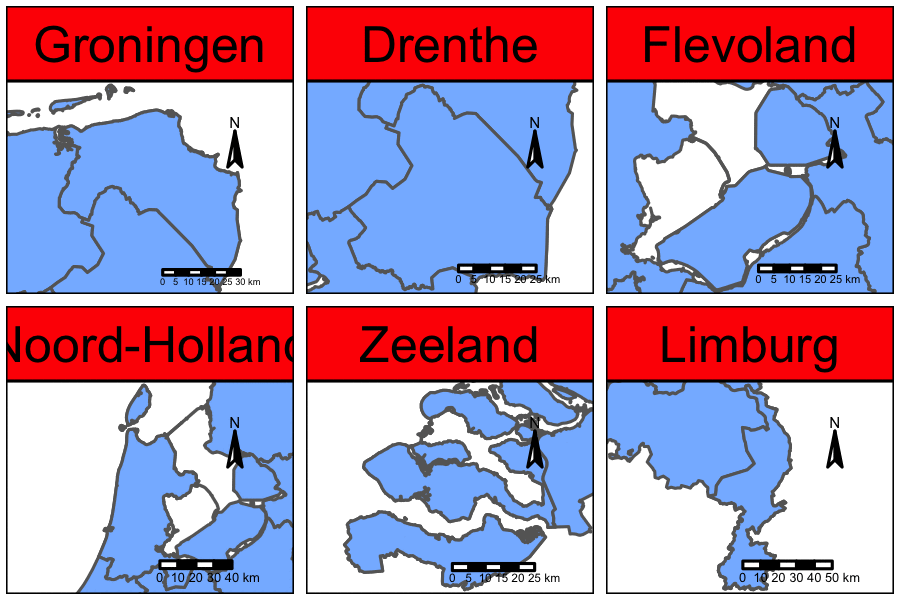
However this displays the panel.label.bg.color (see code below). For some reason tmap_animation need facets to be run twice, trying to get to the bottom of this. But for now, this works(you can add the other layout details which i removed):
data(NLD_prov)

anim_map <-
  tm_shape(NLD_muni) +
  tm_borders() +
  tm_facets(by="province") +
  #tm_fill("population", style="kmeans", convert2density = TRUE) +
  tm_shape(NLD_prov) +
  tm_borders() +
  tm_fill(col = "#86baff") +
  tm_facets(
    by = "name",
    free.coords = F
  )+tm_layout(
  panel.label.bg.color = "red"
)+tm_compass(
    north=0,
    type = "arrow",
    position = c("right", "top"),
    text.size = 0.3
  ) +
  tm_scale_bar(
    #breaks = c(0, 0.5, 1),
    width = 0.25,
    position = c("right", "BOTTOM"),
    text.size = 1
  )

tmap_animation(anim_map+tm_facets(nrow=1,ncol=1), "anim_map_4.gif", width = 300, height = 300)
with animation:
without animation:
Rplot02.pdf
 KiranmayiV
on 16 Dec 2020
KiranmayiV
on 16 Dec 2020
Ah. Interesting... I was actually intrigued by the presence of 2 tm_facets() layers in @mtennekes's code. But I thought it was probably because he had 2 tm_shape() layers. Since I have only one tm_shape(), it didn't occur to me to try to add a second tm_facets().
I'd like to understand this better as well.
prosoitos
on 16 Dec 2020
Except that I don't even know how to try it with my own data because I don't understand what "province" is in tm_facets(by = "province")... There is no variable called province in NLD_prov. I am really confused.
prosoitos
on 16 Dec 2020
Oh, I see. You re-added the NLD_muni dataset (so recreating the example that @mtennekes gave). But that's not what my example was: my example uses only one shape (because that is how my data is).
Can you make my example (using a single shape work)? I can't.
prosoitos
on 16 Dec 2020
OK. I got it. It has nothing to do with the number of shapes or the number of their corresponding facet layers.
It works with tm_facets(by=...) and it does NOT work with tm_facets(along=...).
And in my code, I am using along, which is why it is not working. And in my example above, I was staying as close to my code as possible, so I was using along and that's why that wasn't working either.
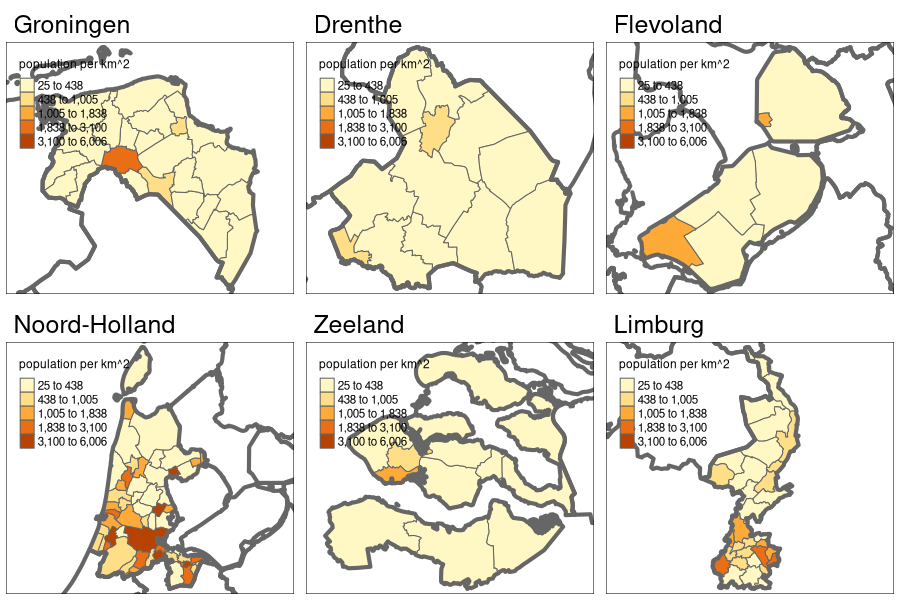
Posting exactly @mtennekes's code, simply replacing in it by with along:
data(NLD_muni)
data(NLD_prov)

tm = tm_shape(NLD_muni) +
  tm_borders() +
  tm_facets(along="province") +
  tm_fill("population", style="kmeans", convert2density = TRUE) +
  tm_shape(NLD_prov) +
  tm_borders(lwd=4) +
  tm_facets(along="name")+tm_layout(panel.label.bg.color = "red")
tmap_animation(tm+tm_facets(nrow=1,ncol=1), "ani.gif", width = 300, height = 300)
prosoitos
on 16 Dec 2020
Ah, I think I understand whats happening. Let me illustrate here:
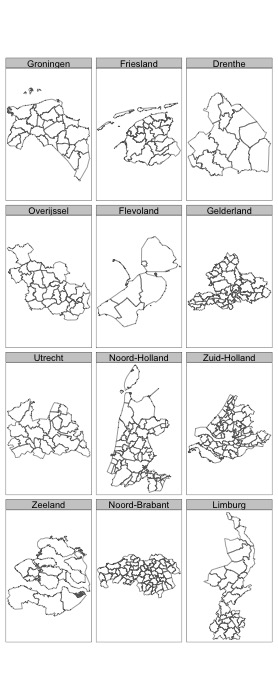
When you use facets first time with NLD_muni:
anim_map <-
  tm_shape(NLD_muni) +
  tm_borders() +
  tm_facets(by="province")
Your facets displayed will look like this:
When your create an animation of this, using facets again:
anim_map <-
  tm_shape(NLD_muni) +
  tm_borders() +
  tm_facets(by="province")
anim_map+tm_facets(nrow=1,ncol=1)

#tmap_animation(**anim_map+tm_facets(nrow=1,ncol=1)**, "anim_map_5.gif", width = 300, height = 300)
Your in essence saving this:
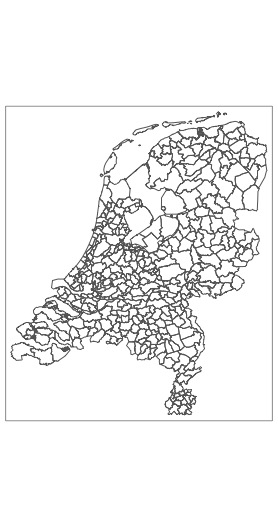
The same happens when you try with a single NLD_prov data:
anim_map<-
  tm_shape(NLD_prov) +
  tm_borders() +
  tm_facets(
    by = "name",
    free.coords = F
  )
anim_map+tm_facets(nrow=1,ncol=1)

#tmap_animation(**anim_map+tm_facets(nrow=1,ncol=1)**, "anim_map_5.gif", width = 300, height = 300)
Your facets looks like this:

and what you save looks like this:
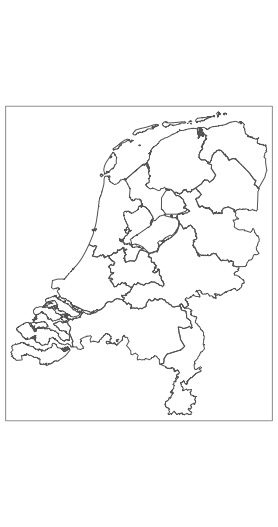
So I think you know where I am getting at, when you have a code like this with 2 shape files faceted:
anim_map <-
  tm_shape(NLD_muni) +
  tm_borders() +
  tm_facets(by="province") +
  #tm_fill("population", style="kmeans", convert2density = TRUE) +
  tm_shape(NLD_prov) +
  tm_borders() +
  tm_facets(
    by = "name",
    free.coords = F
  )
Your facet will still look at same as a single shape file, like this:
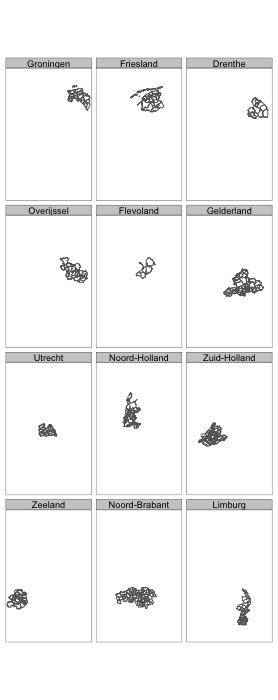
but when you try to save it as animation using the facet command, your in some way picking the facet of a facet which is how the panel gets displayed on top and it looks like this:
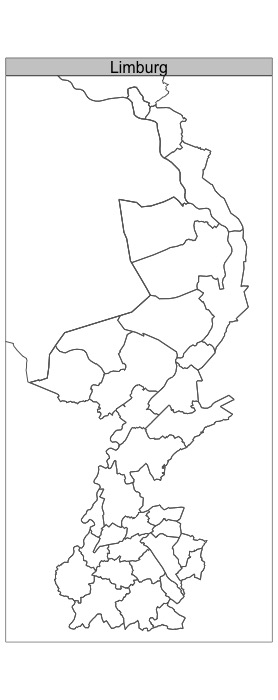
I think this may have to do with how multiple facets work together, when you render them over 1 or more shapefiles vs when your save them.
KiranmayiV
on 16 Dec 2020
OK. I got it. It has nothing to do with the number of shapes or the number of their corresponding facet layers.
It works with
tm_facets(by=...)and it does NOT work withtm_facets(along=...).And in my code, I am using
along, which is why it is not working. And in my example above, I was staying as close to my code as possible, so I was usingalongand that's why that wasn't working either.Posting _exactly_ @mtennekes's code, simply replacing in it
bybyalong:data(NLD_muni) data(NLD_prov) tm = tm_shape(NLD_muni) + tm_borders() + tm_facets(along="province") + tm_fill("population", style="kmeans", convert2density = TRUE) + tm_shape(NLD_prov) + tm_borders(lwd=4) + tm_facets(along="name")+tm_layout(panel.label.bg.color = "red") tmap_animation(tm+tm_facets(nrow=1,ncol=1), "ani.gif", width = 300, height = 300)
Haha this is another interesting finding.
KiranmayiV
on 16 Dec 2020
Haha this is another interesting finding.
Looks buggy to me :wink:
By the way, thank you for your time trying to help out with this!! :slightly_smiling_face:
prosoitos
on 16 Dec 2020
OK. I got it. It has nothing to do with the number of shapes or the number of their corresponding facet layers.
It works with
tm_facets(by=...)and it does NOT work withtm_facets(along=...).And in my code, I am using
along, which is why it is not working. And in my example above, I was staying as close to my code as possible, so I was usingalongand that's why that wasn't working either.Posting _exactly_ @mtennekes's code, simply replacing in it
bywithalong:data(NLD_muni) data(NLD_prov) tm = tm_shape(NLD_muni) + tm_borders() + tm_facets(along="province") + tm_fill("population", style="kmeans", convert2density = TRUE) + tm_shape(NLD_prov) + tm_borders(lwd=4) + tm_facets(along="name")+tm_layout(panel.label.bg.color = "red") tmap_animation(tm+tm_facets(nrow=1,ncol=1), "ani.gif", width = 300, height = 300)
It seems like you would still need two shapefiles to animate. Try with a single facet(along = ..) followed by tmap_animation(..) you will def not get the panel like you pointed out, but you wont get an animation either.
KiranmayiV
on 16 Dec 2020
No: look at my first example. I am creating an animation with a single shape.
Here is a simplified version of it (showing my initial problem about the label background):
data(NLD_prov)

anim_map <- tm_shape(NLD_prov) +
  tm_polygons(col = "#86baff") +
  tm_layout(panel.label.bg.color = "red") +
  tm_facets(along = "name", free.coords = F)

tmap_animation(anim_map, filename = "ag.gif", width = 300, height = 300)
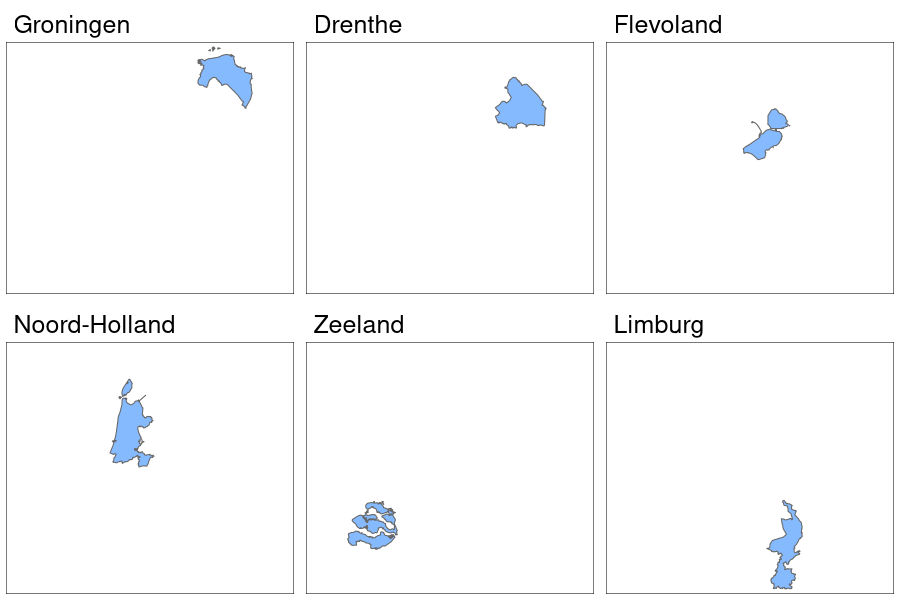
Of course, with this example, it doesn't look great. But with my data, this is what I want to show.
As soon as you can create facets with a shape, you can animate it. It's just a different way to display the facets, really.
prosoitos
on 16 Dec 2020
ok thanks for that @prosoitos, I am summarising things here for better brevity.
When using a single shape file:
tm_facets(along = "name")would basically split the data and plot on separate pages which is only visible by plotting and not on view mode [as per docs]. Panel doesn't get made because the plots are on separate pages. When saving,tmap_animation(anim_map, filename = "ag.gif", width = 300, height = 300)works.- If you need a panel head, you would need to use
tm_facets(by = "name"). But if you save usingtmap_animation(anim_map, filename = "ag.gif", width = 300, height = 300)you basically save the whole facet panel and don't have an animation rendered. If you save usingtmap_animation(anim_map+tm_facets(nrow=1,ncol=1), filename = "ag.gif", width = 300, height = 300)you wont get the panel head because of this https://github.com/mtennekes/tmap/issues/533#issuecomment-745728972.
Enter two shapefiles:
- You would need two shapefiles faceted using _by command_ as done by @mtennekes to get the panel head displayed in animation, like this:
anim_map <-
tm_shape(NLD_muni) +
tm_borders() +
tm_facets(by="province") +
#tm_fill("population", style="kmeans", convert2density = TRUE) +
tm_shape(NLD_prov) +
tm_borders() +
tm_facets(
by = "name",
free.coords = F
)
For saving this you would need to usetmap_animation(anim_map+tm_facets(nrow=1,ncol=1), filename = "ag.gif", width = 300, height = 300)because of this https://github.com/mtennekes/tmap/issues/533#issuecomment-745728972 and this would give you the panel header.
I hope I not missed anything and got everything right.
KiranmayiV
on 16 Dec 2020
Thanks for your input @prosoitos and @KiranmayiV !
One thing I noticed is that tm_facets is often misunderstood. This should be covered well in our upcoming tmap book @Nowosad For me these issues are a signal that there either are bugs in the tmap code and/or the user friendliness can be improved (i.e. by console warnings).
To clarify the use of tm_facets:
Initially, only one tm_facets was allowed per plot, for the simple reason that tmap creates one plot (which many consists of multiple facets). This is similar to facet_wrap for ggplot2. However, multiple tm_facets calls were handy/necessary for two cases:
- When 'converting' a small multiples plot to a one-map-per-frame plot, which is needed for
tmap_animation. Then it is useful to overrule the initialnrowandncolarguments oftm_facetsby 1. - When multiple shapes are being used which need to be split by data.
Both cases are illustrated by my first example above, where I use three (!) tm_facets. In this example it was fine to do that, but as you have shown, the use of too many tm_facets causes a buggy behavior in some cases, especially regarding the along argument.
There was also a bug when running my first example, since the second tm_facets didn't do anything. This is again the first example, this time with the correct output
data(NLD_muni)
data(NLD_prov)

tm = tm_shape(NLD_muni) +
    tm_borders() +
    tm_facets(by="province", nrow = 1, ncol = 1) +
    tm_fill("population", style="kmeans", convert2density = TRUE) +
tm_shape(NLD_prov) +
    tm_borders(lwd = 4)+
    tm_facets(by="name")+tm_layout(panel.label.bg.color = "red")

tmap_animation(tm, "ani.gif", width = 300, height = 300)
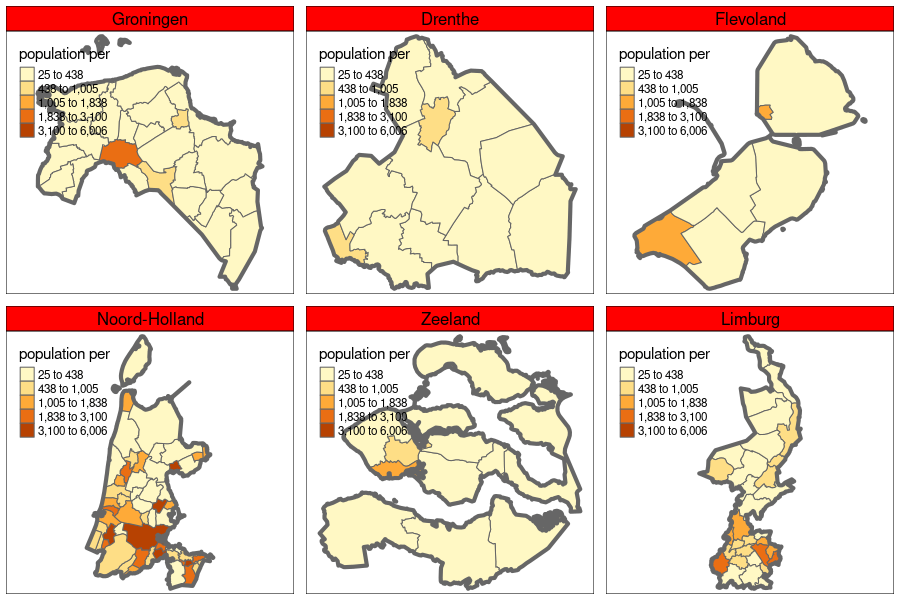
Note that I specified nrow and ncol in the first tm_facets, instead of in the tmap_animation call.
Also note the role of the second tm_facets. It is just to split the second shape. Without it, the result is:
data(NLD_muni)
data(NLD_prov)

tm = tm_shape(NLD_muni) +
    tm_borders() +
    tm_facets(by="province", nrow = 1, ncol = 1) +
    tm_fill("population", style="kmeans", convert2density = TRUE) +
tm_shape(NLD_prov) +
    tm_borders(lwd = 4)
    #tm_facets(by="name")+tm_layout(panel.label.bg.color = "red")

tmap_animation(tm, "ani.gif", width = 300, height = 300)
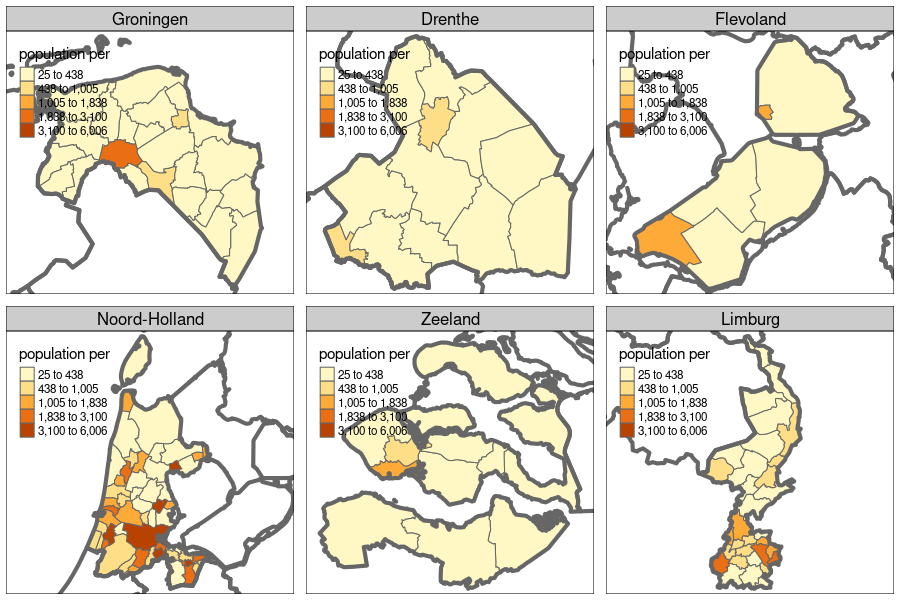
The problem with too many tm_facets is that a tm_facets element not only specifies how the data is split and the number of rows, columns but also whether scales and coordinates are 'free', which features are dropped etc. Using multiple tm_facets may cause internal conflicts.
Therefore, I recommend to use tm_facets in the following way:
- The first tm_facets of the plot should specify as much as possible (number of rows/columns, free scales, etc.).
- The other tm_facets should only be used to split data for those shapes. So for those, only the
byoralongargument should be used.
If there are easy-to-fix bugs left, I'm happy to fix them. However, my current focus is on v4 (#495). For that, please let me know if you have any suggestions to improve user-friendlyness.
mtennekes
on 17 Dec 2020
Related issues
 Robinlovelace
·
4Comments
mtennekes
·
8Comments
Robinlovelace
·
4Comments
mtennekes
·
8Comments
 dylanbeaudette
·
3Comments
dylanbeaudette
·
3Comments
 hbermeo
·
8Comments
hbermeo
·
8Comments
 Nowosad
·
4Comments
Nowosad
·
4Comments