Hi @mtennekes,
there are recurring discussions about the tm_grid() function and its defaults. Please take a look at some examples below.
In my opinion, there are a few things that could be improved:
- Less dense grid as a default
- Allowing to place a grid in the background (it can also be a default setting)
labels.inside.frame = FALSEas a default (and grid lines touching the map frame as a default- Use degrees sign as a default for lat/lon grid projection
- Larger margins when
labels.inside.frame = FALSE - (Bonus) allowing to expand grid lines out of the map frame
- (Bonus 2) allowing for hiding the grid lines inside the map frame (aka only showing axis ticks + labels)
What do you think about it? Please let us know if we can help with implementing or testing the changes.
J.
Related discussion: https://github.com/Robinlovelace/geocompr/issues/391
Related issues: https://github.com/mtennekes/tmap/issues/238 and https://github.com/mtennekes/tmap/issues/164
library(spData)
library(tmap)
library(sf)
#> Linking to GEOS 3.7.1, GDAL 2.3.2, PROJ 5.2.0
library(ggplot2)

# Geographic CRS ----------------------------------------------------------

# ggplot2 defaults
ggplot(world) +
  geom_sf()

# tmap defaults
tm_shape(world) +
  tm_borders() +
  tm_grid()

tm_shape(world) +
  tm_borders() +
  tm_grid(n.x = 3, n.y = 3,
          labels.inside.frame = FALSE)

# Projected CRS

# ggplot2 defaults
ggplot() +
  geom_sf(data = nz)

# tmap defaults
tm_shape(nz) +
  tm_borders() +
  tm_grid()

tm_shape(nz) +
  tm_borders() +
  tm_grid(n.x = 3, n.y = 3,
          labels.inside.frame = FALSE)

tm_shape(nz) +
  tm_borders() +
  tm_grid(n.x = 3, n.y = 3,
          labels.inside.frame = FALSE, projection = "longlat")

Created on 2019-06-06 by the reprex package (v0.3.0)
 Nowosad
All 11 comments
Thanks for these requests. Will take a look at it soon.
 mtennekes
on 6 Jun 2019
mtennekes
on 6 Jun 2019
- Less dense grid as a default
To be honest, I don't find the ggplot2 defaults better. Less grid lines may be nicer looking, but the main purpose of a grid should be to read coordinates for specific points on the map. Note that for non-map charts, like scatter plots, ggplot2 solves this by using major and minor grid lines. Not sure this is useful for maps though (apart from the work). So we need to find a good balance.
Also note that there is some hidden intelligence behind the default number of grid lines. Namely, it depends on the aspect ratio of the map, and on the scale:
```{r}
very small map
tm_shape(world) +
tm_polygons() +
tm_grid() +
tm_layout(scale = 2, outer.margins = .1)
think of this as a huge wall poster
tm_shape(world) +
tm_polygons() +
tm_grid() +
tm_layout(scale = .2, outer.margins = .1)
The code is here: https://github.com/mtennekes/tmap/blob/master/R/plot_misc_functions.R#L11-L19
This hard-coded parameter, 20, can of course be adjusted. Let me know what you think of it.


2. Allowing to place a grid in the background (it can also be a default setting)

This was already possible:

```{r}
tm_shape(world) +
    tm_grid() +
    tm_polygons() +
    tm_layout(inner.margins = 0)
I just added the possibility to place tm_grid also before tm_shape (which makes sense conceptually)
- labels.inside.frame = FALSE as a default (and grid lines touching the map frame as a default
Good point, but there could be problems with the margin (see next two points).
- Use degrees sign as a default for lat/lon grid projection
I added tm_graticules, which is similar to tm_grid, but with difference defaults, including projection, degree-symbol suffix.
{r}
tm_shape(nz) +
  tm_polygons() +
tm_graticules()
- Larger margins when labels.inside.frame = FALSE
Currently, the grid labels are placed in the outer.margins. Not sure how to improve this without putting too much work in it. Currently, I set labels.inside.frame to TRUE for tm_grid and to FALSE for tm_graticules, since the lat/lon numbers are much smaller than projected grid coordinates.
- (Bonus) allowing to expand grid lines out of the map frame
I'll go for another solution (see next point)
- (Bonus 2) allowing for hiding the grid lines inside the map frame (aka only showing axis ticks + labels)
For labels.inside.frame = FALSE, I'll try to implement separate ticks. Shouldn't be hard. Curved lines through the map frame is difficult since I use different viewports for the map and the outer spaces.
What are your thoughts / ideas on this?
UPDATE:
- Ticks implemented.
tm_gridhasticksandlinesargument.
Working on automatic adjustment of the outer margins based on the labels. Not easy, but should be possible.
Also note that the inner margins are by default some value above 0, to prevent the shape touching the frame; see qtm(nz) + tm_layout(inner.margins = 0). However, for unprojected world maps with grid, inner.margins need to be set to 0, for otherwise there appear ugly gaps between ticks and grid lines.
mtennekes
on 8 Jun 2019
Impressive changes @mtennekes !!!
I agree that the ggplot2 defaults are not perfect. In the same time, I think that the tmap defaults are a little bit too dense. I would suggest something in between, but I know this is debatable.
The background grid is great.
library(spData)
library(tmap)

tm_shape(world) +
  tm_grid() +
  tm_polygons()
#> Linking to GEOS 3.7.1, GDAL 2.3.2, PROJ 5.2.0

Created on 2019-06-10 by the reprex package (v0.3.0)
3., 4., and 5. The tm_graticule is even better. Its defaults should be (in my opinion) fine for most people. It just looks good (of course, after solving the issue with the margins).
library(spData)
library(tmap)

tm_shape(world) +
  tm_graticules() +
  tm_polygons() +
  tm_layout(inner.margins = 0)
#> Linking to GEOS 3.7.1, GDAL 2.3.2, PROJ 5.2.0

tm_shape(nz) +
  tm_graticules() +
  tm_polygons()

Created on 2019-06-10 by the reprex package (v0.3.0)
- and 7. Your solution is much better than my idea.
library(spData)
library(tmap)
data(world)

tm_shape(world) +
  tm_polygons() +
  tm_graticules(ticks = TRUE, lines = FALSE)
#> Linking to GEOS 3.7.1, GDAL 2.3.2, PROJ 5.2.0

Created on 2019-06-10 by the reprex package (v0.3.0)
PS Could there be a warning message when ticks = TRUE and labels.inside.frame = TRUE (e.g. tm_grid(ticks = TRUE, lines = FALSE, labels.inside.frame = TRUE))?
Nowosad
on 10 Jun 2019
Thanks for your feedback. I've made the grid lines a less dense, and added the warning.
mtennekes
on 10 Jun 2019
The margins are improved now. Please check if it works as expected.
mtennekes
on 16 Jun 2019
I've tested the changes on a few examples. It works definitely better. The only issue I've found is in the example below (see the bottom left label).
library(spData)
library(tmap)
library(sf)
#> Linking to GEOS 3.7.1, GDAL 2.3.2, PROJ 5.2.0

tm_shape(nz) +
  tm_borders() +
  tm_graticules()

Created on 2019-06-17 by the reprex package (v0.3.0)
EDIT:
I also found this inconsistency (see the y labels):
library(spData)
library(tmap)
library(sf)
#> Linking to GEOS 3.7.1, GDAL 2.3.2, PROJ 5.2.0

tm_shape(nz) +
  tm_grid(n.x = 4, n.y = 2) +
  tm_polygons()

tm_shape(nz) +
  tm_grid(n.x = 4, n.y = 3) +
  tm_polygons()

Created on 2019-06-17 by the reprex package (v0.3.0)
Nowosad
on 17 Jun 2019
Thanks Jakub.
I've fixed the first issue (the clipped y label).
Regarding the inconsistency: n.x and n.y are used for pretty scales (just like the n argument for aesthetic layers for the default style pretty). I've updated to docs to clarify this.
mtennekes
on 18 Jun 2019
:fireworks: Awesome changes! I've created a vignette describing different options related to tm_grid() and tm_graticules() (it will be published online after the tmap CRAN update).
What do you think about these changes @prosoitos?
Nowosad
on 19 Jun 2019
I love the changes! Thank you so much @mtennekes for working on this so quickly!!
Great idea to create tm_graticules! It gives the best of both worlds: tm_grid is great for more scientific maps or to have references matching the CRS and tm_graticules is great to produce more mainstream maps with geographic coordinates which are easy to interpret for a general audience. I love that.
To make tm_graticules even more friendly for the reader of the map, would it be possible to add °N, °S, °W and °E instead of having positive and negative values?
Again, this is inspired by the default of ggplot2. Here is an example showing S and W coordinates instead of negative values:
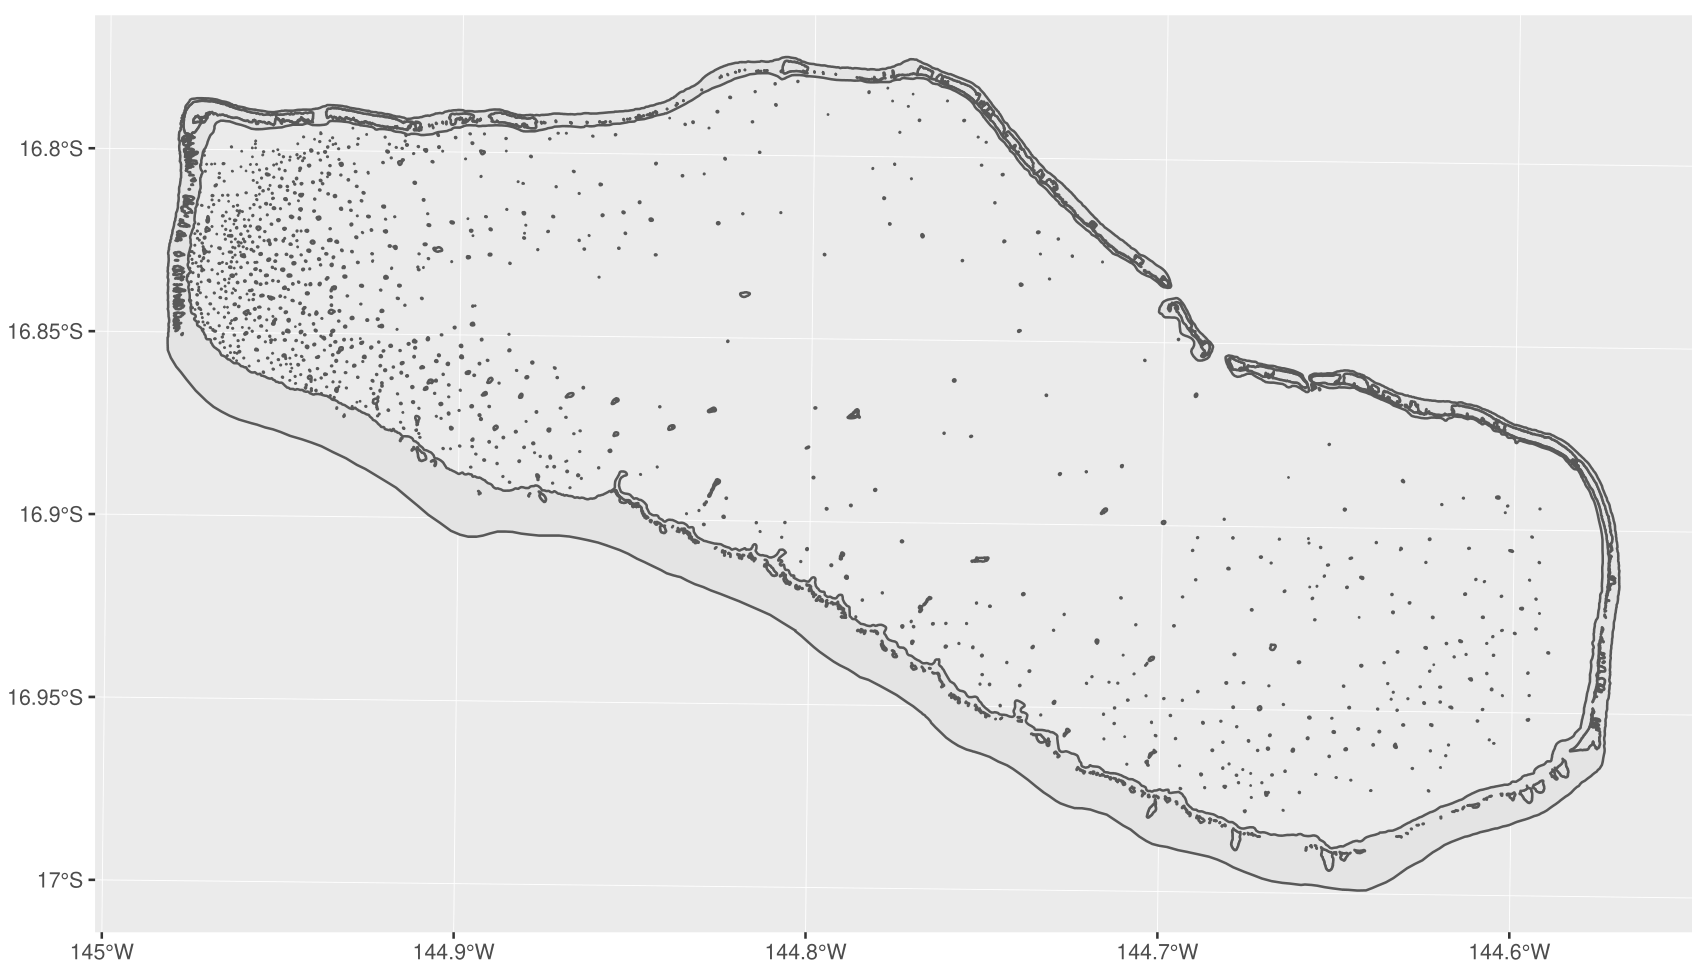
What do you think?
 prosoitos
on 19 Jun 2019
prosoitos
on 19 Jun 2019
It should work now.
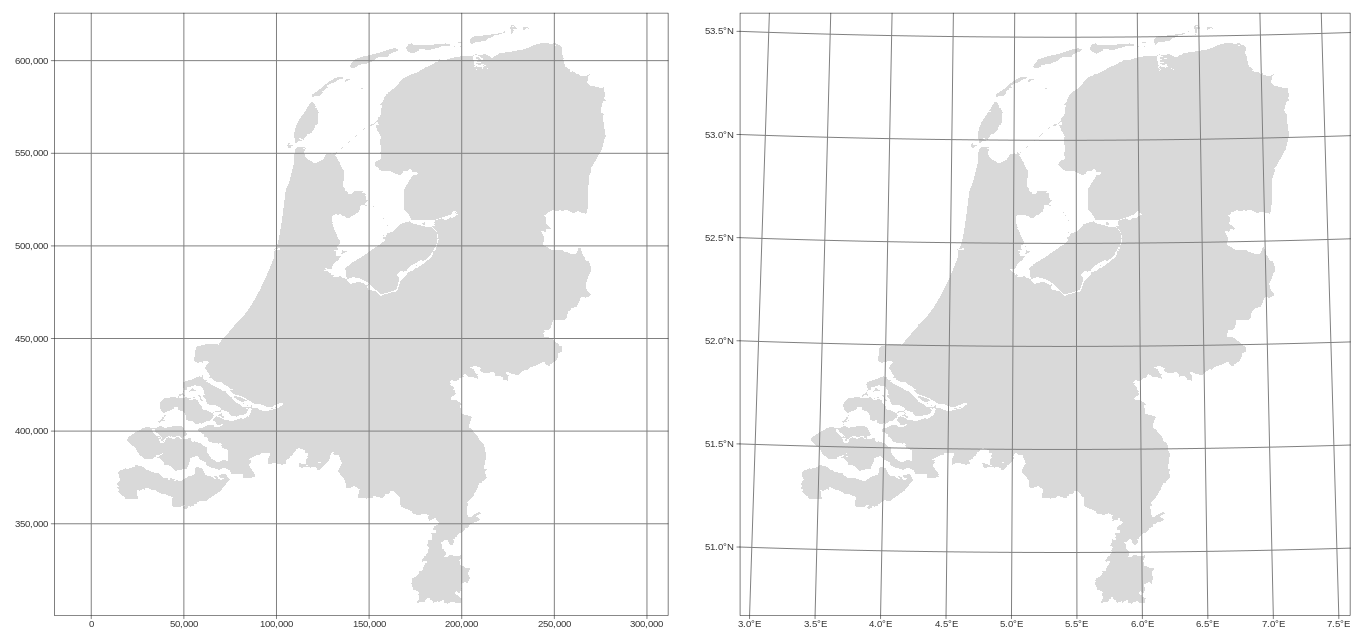
data(NLD_muni)

tmap_arrange(
    qtm(NLD_muni, borders = NULL) + tm_grid(),
    qtm(NLD_muni, borders = NULL) + tm_graticules()
)
mtennekes
on 25 Jun 2019
Amazing! I love it!! Thank you @mtennekes! This is really great :slightly_smiling_face:
prosoitos
on 25 Jun 2019
Related issues
 zjslagle
·
4Comments
zjslagle
·
4Comments
 Si-Chong
·
4Comments
Si-Chong
·
4Comments
 Robinlovelace
·
4Comments
Nowosad
·
4Comments
mtennekes
·
4Comments
Robinlovelace
·
4Comments
Nowosad
·
4Comments
mtennekes
·
4Comments
Most helpful comment
Thanks for your feedback. I've made the grid lines a less dense, and added the warning.