Tmap: Fill polygons with logarithmic scale
This is more of a question than an issue, so I hope I'm not misusing this space.
Is there any tmap equivalent of ggplot2's scale_colour_gradient function, and in particular anything similar to the trans argument, so that it would be possible to fill polygons by spreading the colors according to a log scale?
 fzenoni
All 15 comments
Great suggestion!
I think it makes sense to add a couple of options to the style argument (and maybe also the possibility to provide a custom transformation function?)
If so, which options? For ggplot2 these ones are available: "asn", "atanh", "boxcox", "exp", "identity", "log", "log10", "log1p", "log2", "logit", "probability", "probit", "reciprocal", "reverse" and "sqrt", but I'm not sure if they all are useful for color scaling in maps.
 mtennekes
on 21 Aug 2017
mtennekes
on 21 Aug 2017
I don't have much experience so far, as I'm barely scratching the field. Personally I've felt the strong need of a log10 scale, which is important when trying to appreciate differences while dealing with vastly different order of magnitudes. Moreover, I must say that I don't usually see scales other than linear on color-coded maps, and the ggplot2 reverse can already be implemented at the palette level with rev() or with the - sign if I'm not mistaken. I've struggled to find more documentation concerning the other options.
fzenoni
on 22 Aug 2017
Dear @mtennekes, I think it would be a nice option to have a new argument (e.g., trans) to visualize data with a skewed distribution.
Correct me if I am wrong, but I think it would only require to transform the values and next to update the legend accordingly.
Let me know if I can help with implementing/testing it.
library(tmap)
library(ggplot2)
library(spData)
options(scipen = 99*99)

# tmap
tm_shape(world) +
  tm_polygons(col = "pop")
#> Linking to GEOS 3.6.1, GDAL 2.3.2, PROJ 4.9.3

# tmap 2
world$pop_log10 = log10(world$pop)

tm_shape(world) +
  tm_polygons(col = "pop_log10")

# ggplot2
ggplot() +
  geom_sf(data = world, aes(fill = pop)) +
  scale_fill_continuous(trans = "log10")

Created on 2019-03-23 by the reprex package (v0.2.1)
 Nowosad
on 23 Mar 2019
Nowosad
on 23 Mar 2019
Yes, this one is badly needed.
How should a user specific this? Like ggplot2, with an additional argument trans? What values can it have? Prespecified options, such as "log10", or also functions?
mtennekes
on 24 Mar 2019
I would suggest following ggplot2 - an argument trans. It would be great to even start with just "log10" option. I am not sure if other transformations are also often used in maps...
Nowosad
on 24 Mar 2019
Started a new branch, trans. Your example is working:
tm_shape(world) +
  tm_polygons(col = "pop", trans = "log10",
    legend.format = list(format="f", big.mark = ",", scientific=TRUE))
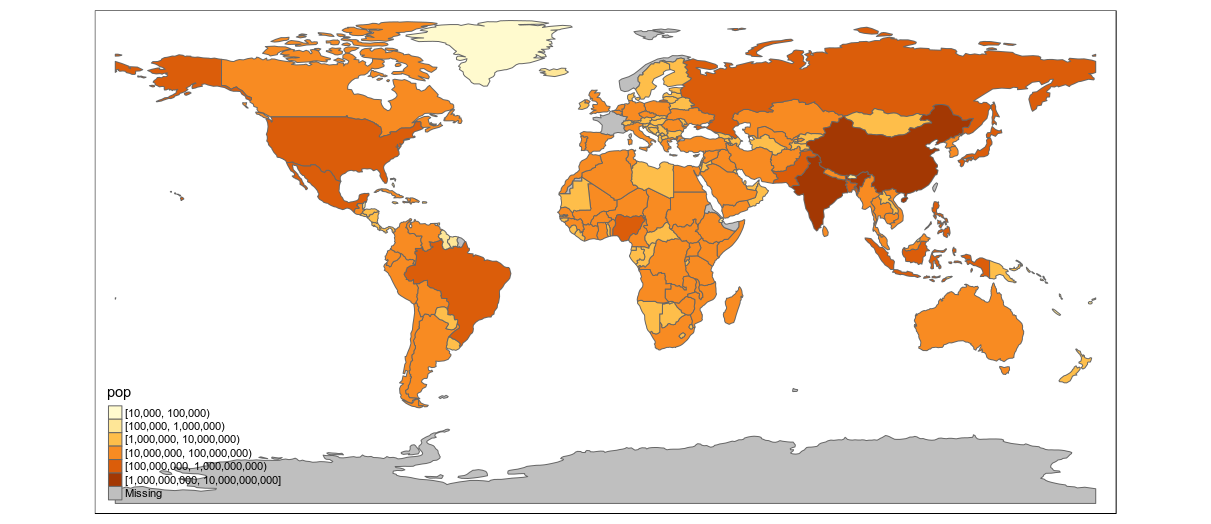
tm_shape(world) +
  tm_polygons(col = "pop", trans = "log10", style="cont",
    legend.format = list(format="f", big.mark = ",", scientific=TRUE))
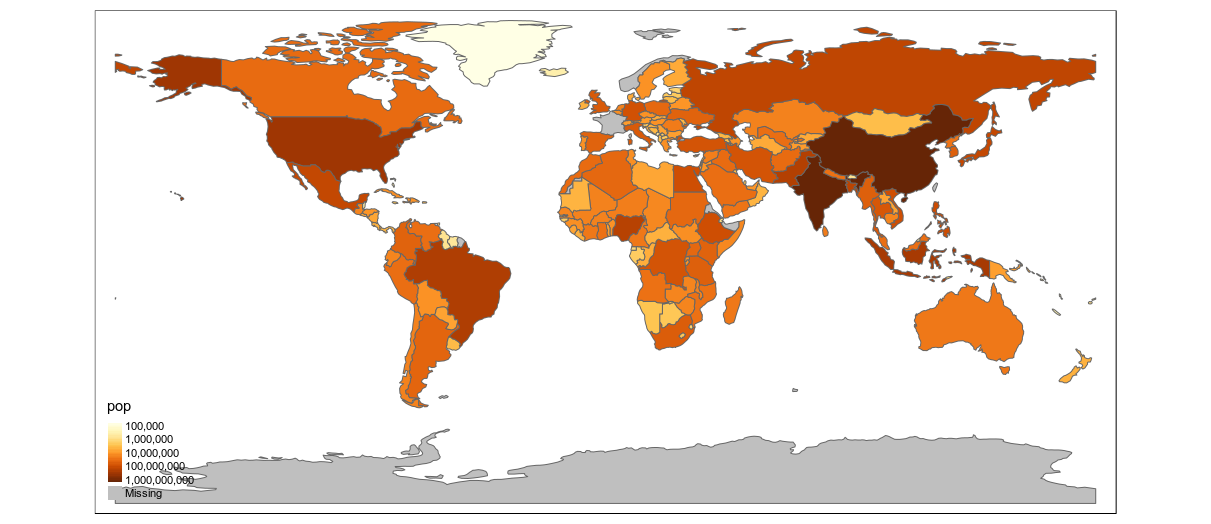
However, I'm not sure if this is the right way. I would prefer to add it as an option to style. The log10 transformation is probably the only transformation that will be used, and moreover, it will only be used when style is either pretty or cont. In other words, the log10 transformation will probably be used as an alternative to style, not together with it. And for other transformations, it is a little effect for users to transform the variable prior to using tmap.
What do you think?
mtennekes
on 26 Mar 2019
@mtennekes I think it is a valid idea... One question - what is your plan for the new style option names? log10_pretty and log10_cont? Or something else?
Nowosad
on 29 Mar 2019
Which one would be used more often? I could name that one log10.
mtennekes
on 30 Mar 2019
I asked people on Twitter for help - https://twitter.com/jakub_nowosad/status/1112243585095737345.
They were very helpful - if I counted they responses correctly:
- Continuous - 20 responses
- Pretty - 3 responses
- Both - 2 responses (one with 8 hearts)
Nowosad
on 2 Apr 2019
On the side note - it is possible to create a pretty log10 viz already with tmap:
library(tmap)
library(ggplot2)
library(spData)
options(scipen = 99*99)

# tmap
tm_shape(world) +
  tm_polygons(col = "pop",
              breaks = 10^(3:10),
              legend.format = list(format = "f",
                                   big.mark = ",",
                                   scientific = TRUE))
#> Linking to GEOS 3.6.1, GDAL 2.3.2, PROJ 4.9.3

Created on 2019-04-02 by the reprex package (v0.2.1)
Nowosad
on 2 Apr 2019
Brilliant idea to use the twitter crowd! So it would make sense to have both "log10" (continuous) and "log10_pretty".
mtennekes
on 2 Apr 2019
Yep, it seems so.
Nowosad
on 5 Apr 2019
Should be working. I also added a list item "big.num.abbr" which controls big number abbreviations, such as "mln". For logarithmic breaks, these are disabled by default.
mtennekes
on 12 Apr 2019
Hi! Just wanted to note that adding style="log10" with tm_polygon() results in "Error: Invalid style value(s)"; adding trans="log10" doesn't yield an error but is just ignored. Is there something I'm missing?
 bobidou23
on 20 Aug 2019
bobidou23
on 20 Aug 2019
@bobidou23 - it should work. Do you have the latest version of the tmap package?
Look at the example below:
library(tmap)
library(spData)

tm_shape(world) +
  tm_polygons(col = "pop", style = "log10")
#> Linking to GEOS 3.7.1, GDAL 2.3.2, PROJ 5.2.0

Created on 2019-08-22 by the reprex package (v0.3.0)
Nowosad
on 22 Aug 2019
Related issues
 Robinlovelace
·
4Comments
Robinlovelace
·
4Comments
 Si-Chong
·
4Comments
Nowosad
·
5Comments
Si-Chong
·
4Comments
Nowosad
·
5Comments
 jarsc568
·
8Comments
jarsc568
·
8Comments
 loreabad6
·
5Comments
loreabad6
·
5Comments
Most helpful comment
I asked people on Twitter for help - https://twitter.com/jakub_nowosad/status/1112243585095737345.
They were very helpful - if I counted they responses correctly: