Tidb: Disk IO keep close to 100%, even if I remove the region leaders on that node
Tidb cluster with 5 nodes are installed by docker, version is v2.1.2, cluser info as follows:
tidb-1   24C 128G 4TSAS
pd-1    24C 128G 4TSAS
tikv-1  32C 128G 512GSSD
tikv-2  32C 128G 512GSSD
tikv-3  32C 128G 512GSSD
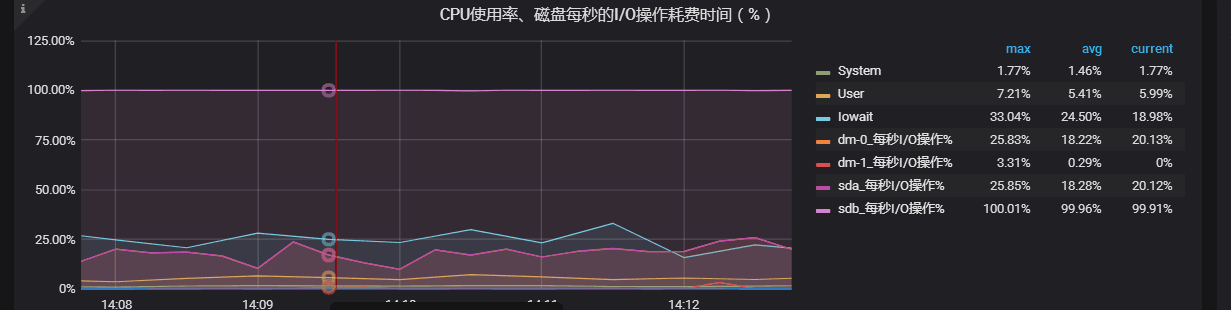
I found that the disk IO of tikv-3 was very high, close to 100%, but the other two nodes were very low, about 20%. By the pd-ctl command scheduler add evict-leader-scheduler 6, all the region leaders on tikv-3 are evicted, and the disk IO is still close to 100%, the other two nodes are about 60%.
Disk IO(sdb) info of tikv-3
Device:         rrqm/s   wrqm/s     r/s     w/s    rkB/s    wkB/s avgrq-sz avgqu-sz   await r_await w_await  svctm  %util
sda               0.00     0.00    0.00   10.00     0.00   160.00    32.00     0.14   13.50    0.00   13.50   9.70   9.70
sdb               0.00    10.00    4.00  272.00   512.00 67196.00   490.64   135.63  495.52  619.50  493.69   3.62 100.00
 jeeffy
All 20 comments
@jeeffy Thanks for your feedback!
Could you please check if there is a write stall? Or if there is another process to write the disk?
 rleungx
on 15 Jan 2019
rleungx
on 15 Jan 2019
Only tikv-3 is using the disk,how to check write stall in docker?
jeeffy
on 16 Jan 2019
@ethercflow PTAL.
rleungx
on 16 Jan 2019
@jeeffy
Eg: your tikv-3's data disk is /dev/sdb, you can analyze IO performance as follows
blktrace -d /dev/sdb (after 2 mins, ctrl-c to stop)
blkparse -i sdb -d sdb.blktrace.bin > /dev/null 2>&1
btt -i sdb.blktrace.bin > sdb.btt
then please upload sda.btt.
Notice, please run blktrace on other disks, it can generate IO request too.
 ethercflow
on 16 Jan 2019
ethercflow
on 16 Jan 2019
@ethercflow Thanks, I check disk sdb performance with fio -ioengine=psync -bs=32k -fdatasync=1 -thread -rw=randrw -percentage_random=100,0 -size=10G -filename=fio_randread_write_test.txt -name='fio mixed randread and sequential write test' -iodepth=4 -runtime=60 -numjobs=4 -group_reporting, as follows.
Jobs: 4 (f=4): [m(4)][100.0%][r=416MiB/s,w=423MiB/s][r=13.3k,w=13.5k IOPS][eta 00m:00s]
fio mixed randread and sequential write test: (groupid=0, jobs=4): err= 0: pid=172951: Wed Jan 16 09:49:07 2019
   read: IOPS=8426, BW=263MiB/s (276MB/s)(15.4GiB/60001msec)
    clat (usec): min=3, max=492016, avg=307.22, stdev=3589.96
     lat (usec): min=3, max=492016, avg=307.31, stdev=3589.96
    clat percentiles (usec):
     |  1.00th=[     8],  5.00th=[     9], 10.00th=[     9], 20.00th=[    10],
     | 30.00th=[    11], 40.00th=[    12], 50.00th=[    14], 60.00th=[   235],
     | 70.00th=[   277], 80.00th=[   314], 90.00th=[   363], 95.00th=[   412],
     | 99.00th=[  4555], 99.50th=[  8291], 99.90th=[ 22152], 99.95th=[ 44827],
     | 99.99th=[193987]
   bw (  KiB/s): min= 6784, max=113152, per=26.01%, avg=70146.58, stdev=28868.32, samples=457
   iops        : min=  212, max= 3536, avg=2192.03, stdev=902.14, samples=457
  write: IOPS=8444, BW=264MiB/s (277MB/s)(15.5GiB/60001msec)
    clat (usec): min=8, max=245, avg=29.33, stdev=15.62
     lat (usec): min=8, max=272, avg=29.95, stdev=15.73
    clat percentiles (usec):
     |  1.00th=[   11],  5.00th=[   13], 10.00th=[   16], 20.00th=[   18],
     | 30.00th=[   20], 40.00th=[   22], 50.00th=[   25], 60.00th=[   29],
     | 70.00th=[   35], 80.00th=[   40], 90.00th=[   51], 95.00th=[   61],
     | 99.00th=[   83], 99.50th=[   92], 99.90th=[  113], 99.95th=[  122],
     | 99.99th=[  141]
   bw (  KiB/s): min= 6848, max=113856, per=26.01%, avg=70280.33, stdev=28837.84, samples=457
   iops        : min=  214, max= 3558, avg=2196.21, stdev=901.19, samples=457
  lat (usec)   : 4=0.01%, 10=14.02%, 20=29.07%, 50=29.22%, 100=5.15%
  lat (usec)   : 250=4.30%, 500=17.23%, 750=0.22%, 1000=0.04%
  lat (msec)   : 2=0.07%, 4=0.14%, 10=0.41%, 20=0.07%, 50=0.03%
  lat (msec)   : 100=0.01%, 250=0.01%, 500=0.01%
  cpu          : usr=1.45%, sys=24.38%, ctx=2054313, majf=0, minf=1040
  IO depths    : 1=100.0%, 2=0.0%, 4=0.0%, 8=0.0%, 16=0.0%, 32=0.0%, >=64=0.0%
     submit    : 0=0.0%, 4=100.0%, 8=0.0%, 16=0.0%, 32=0.0%, 64=0.0%, >=64=0.0%
     complete  : 0=0.0%, 4=100.0%, 8=0.0%, 16=0.0%, 32=0.0%, 64=0.0%, >=64=0.0%
     issued rwt: total=505613,506652,0, short=0,0,0, dropped=0,0,0
     latency   : target=0, window=0, percentile=100.00%, depth=4

Run status group 0 (all jobs):
   READ: bw=263MiB/s (276MB/s), 263MiB/s-263MiB/s (276MB/s-276MB/s), io=15.4GiB (16.6GB), run=60001-60001msec
  WRITE: bw=264MiB/s (277MB/s), 264MiB/s-264MiB/s (277MB/s-277MB/s), io=15.5GiB (16.6GB), run=60001-60001msec

Disk stats (read/write):
  sdb: ios=257261/680815, merge=0/281, ticks=162746/32464, in_queue=194920, util=92.78%
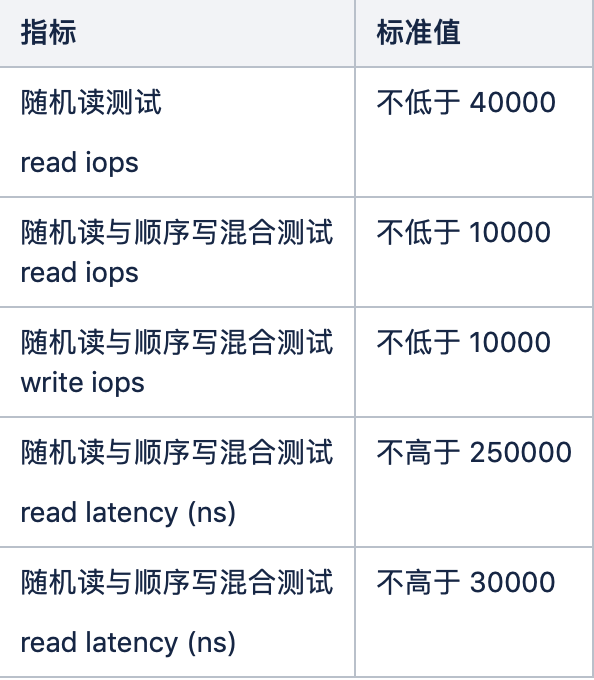
@jeeffy It seems disk's IO performance is not good enough, below is our minimum standard of production environment.
BTW, using blktrace you can get delays at each stage of block layer(include disk driver), it's more intuitive with real IO characteristic.
ethercflow
on 16 Jan 2019
Result of blktrace performance testing:
==================== All Devices ====================

            ALL           MIN           AVG           MAX           N
--------------- ------------- ------------- ------------- -----------

Q2Q               0.000001354   0.385233767   5.007913056          13
Q2G               0.000000666   0.000003183   0.000011095           6
G2I               0.000000690   0.000013946   0.000024828           6
Q2M               0.000000350   0.000000573   0.000001366           8
I2D               0.000000620   0.000010348   0.000020437           6
M2D               0.000004486   0.000013452   0.000031329           8
D2C               0.000027220   0.000068879   0.000093731          14
Q2C               0.000029327   0.000088669   0.000133251          14

==================== Device Overhead ====================

       DEV |       Q2G       G2I       Q2M       I2D       D2C
---------- | --------- --------- --------- --------- ---------
 (  8, 16) |   1.5386%   6.7407%   0.3694%   5.0016%  77.6807%
---------- | --------- --------- --------- --------- ---------
   Overall |   1.5386%   6.7407%   0.3694%   5.0016%  77.6807%

==================== Device Merge Information ====================

       DEV |       #Q       #D   Ratio |   BLKmin   BLKavg   BLKmax    Total
---------- | -------- -------- ------- | -------- -------- -------- --------
 (  8, 16) |       14        6     2.3 |        8       18       56      112

==================== Device Q2Q Seek Information ====================

       DEV |          NSEEKS            MEAN          MEDIAN | MODE
---------- | --------------- --------------- --------------- | ---------------
 (  8, 16) |              14      71366462.3               0 | 0(9)
---------- | --------------- --------------- --------------- | ---------------
   Overall |          NSEEKS            MEAN          MEDIAN | MODE
   Average |              14      71366462.3               0 | 0(9)

==================== Device D2D Seek Information ====================

       DEV |          NSEEKS            MEAN          MEDIAN | MODE
---------- | --------------- --------------- --------------- | ---------------
 (  8, 16) |               6     166521745.3               0 | 0(1)
                                                               ...(5 more)
---------- | --------------- --------------- --------------- | ---------------
   Overall |          NSEEKS            MEAN          MEDIAN | MODE
   Average |               6     166521745.3               0 | 0(1)
                                                               ...(5 more)


==================== Plug Information ====================

       DEV |    # Plugs # Timer Us  | % Time Q Plugged
---------- | ---------- ----------  | ----------------
 (  8, 16) |          2(         0) |   0.000803788%

       DEV |    IOs/Unp   IOs/Unp(to)
---------- | ----------   ----------
 (  8, 16) |        2.5          0.0
---------- | ----------   ----------
   Overall |    IOs/Unp   IOs/Unp(to)
   Average |        2.5          0.0

==================== Active Requests At Q Information ====================

       DEV |  Avg Reqs @ Q
---------- | -------------
 (  8, 16) |           1.3

==================== I/O Active Period Information ====================

       DEV |     # Live      Avg. Act     Avg. !Act % Live
---------- | ---------- ------------- ------------- ------
 (  8, 16) |          3   0.000064831   2.503984403   0.00
---------- | ---------- ------------- ------------- ------
 Total Sys |          3   0.000064831   2.503984403   0.00

# Total System
#     Total System : q activity
  0.000001973   0.0
  0.000001973   0.4
  0.000098256   0.4
  0.000098256   0.0
  5.008011312   0.0
  5.008011312   0.4
  5.008040941   0.4
  5.008040941   0.0

#     Total System : c activity
  0.000078306   0.5
  0.000078306   0.9
  0.000127583   0.9
  0.000127583   0.5
  5.008144563   0.5
  5.008144563   0.9
  5.008163300   0.9
  5.008163300   0.5

# Per process
#             jbd2 : q activity
  0.000001973   1.0
  0.000001973   1.4
  0.000098256   1.4
  0.000098256   1.0

#             jbd2 : c activity

#           kernel : q activity

#           kernel : c activity
  0.000078306   2.5
  0.000078306   2.9
  0.000127583   2.9
  0.000127583   2.5
  5.008144563   2.5
  5.008144563   2.9
  5.008163300   2.9
  5.008163300   2.5

#          kworker : q activity
  5.008011312   3.0
  5.008011312   3.4
  5.008040941   3.4
  5.008040941   3.0

#          kworker : c activity
All the disks on 3 tikvs are the same, they are Intel 545s 512G. Why only the disk IO of tikv-3 is close to 100%?
jeeffy
on 16 Jan 2019
hi, i have met the same issue...
I am using SSD disk,but it still not fit the requirement... when i do ansible-playbook bootstrap.yml it tells me "fio: randread iops of tikv_data_dir disk is too low: 11377 < 40000, it is strongly recommended to use SSD disks for TiKV and PD, or there might be performance issues."...
I saw previous issue: https://github.com/pingcap/tidb/issues/6359 said 8500 is min read iops reqirement, why it requires 40000 now...?
how can i skip machine performace checking? I have try to set "dev_mode = True" and "machine_benchmark = False" in tidb-ansible/inventory.ini but it is not working...
the tidb_version in tidb-ansible/inventory.ini is v2.0.11
thank you
 StoneTZ
on 16 Jan 2019
StoneTZ
on 16 Jan 2019
@rleungx PTAL
ethercflow
on 16 Jan 2019
@StoneZoul You can try to use the following command:
ansible-playbook bootstrap.yml --extra-vars "dev_mode=True"
rleungx
on 16 Jan 2019
@jeeffy Can you share us more metrics?
- write flow and compaction flow in both
RocksDB-kvandRocksDB-raftpanel of TiKV dashborad. - grpc message count in
Grpcpanel of TiKV dashborad.
Before you upload them, you can use edit it and modify the query like this:

- leader count and leader score in Balance panel of PD dashborad.
rleungx
on 16 Jan 2019
@StoneZoul You can try to use the following command:
ansible-playbook bootstrap.yml --extra-vars "dev_mode=True"
thank you, ansible-playbook bootstrap.yml --extra-vars "dev_mode=True" works
StoneTZ
on 16 Jan 2019
@jeeffy
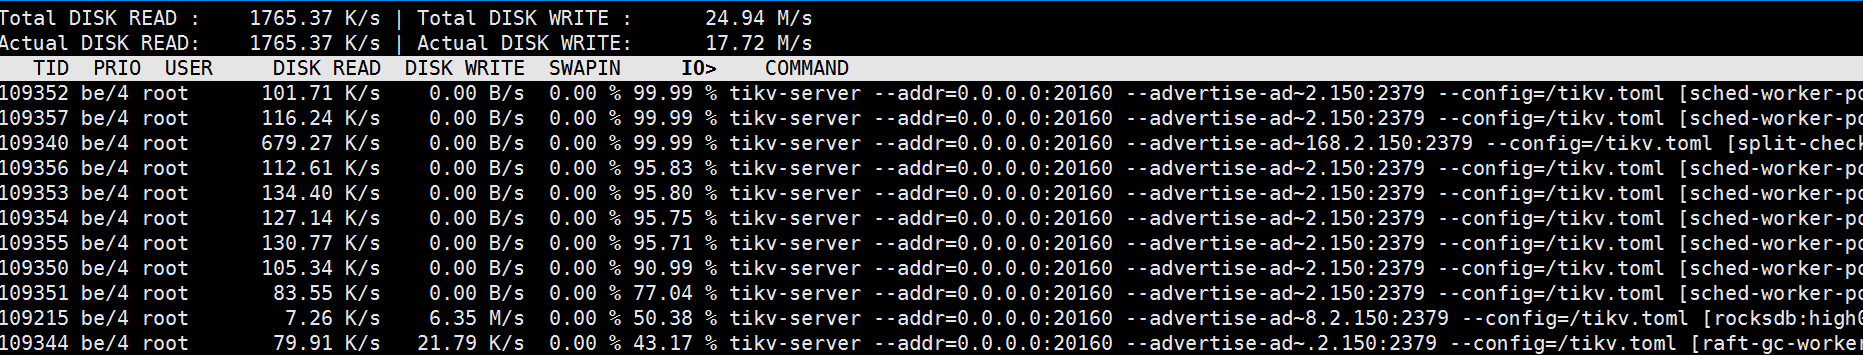
I think you can use iotop to check which costs high IO.
 siddontang
on 16 Jan 2019
siddontang
on 16 Jan 2019
@siddontang snapshot of iotop
jeeffy
on 17 Jan 2019
@jeeffy Would you please share us more info?
- Hosts os version
- filesystem mount parameters
- Is there any errors in dmesg
You may use https://github.com/ethercflow/diff-system-params/blob/master/recorder.sh to record the hosts kernel parameters and diff, let us make sure there's no difference between them first.
BTW, please upload the other two iotop infos. Thank you.
ethercflow
on 17 Jan 2019
hi, guys. i have some questions... The follow command is used to benchmark disk io performance in bootstrap.yml
" ./fio -ioengine=psync -bs=32k -fdatasync=1 -thread -rw=randread -size=10G -filename=fio_randread_test.txt -name='fio randread test' -iodepth=4 -runtime=60 -numjobs=4 -group_reporting --output-format=json --output=fio_randread_result.json"
my question is why choose "-ioengine=psync" instead of "-ioengine=libaio" ? why choose "-bs=32k -fdatasync=1" ? as the parameter of fio command?
StoneTZ
on 21 Jan 2019
@StoneZoul We use psync because it matches our current IO characteristics, below is the detail: https://www.jianshu.com/p/9d823b353f22
Welcome discussion
ethercflow
on 22 Jan 2019
@StoneZoul We use
psyncbecause it matches our current IO characteristics, below is the detail: https://www.jianshu.com/p/9d823b353f22
Welcome discussion
i see... thank you :)
StoneTZ
on 22 Jan 2019
I am going to close this issue as stale. Please feel free to re-open if you have additional questions. Thanks!
 nullnotnil
on 23 Jul 2020
nullnotnil
on 23 Jul 2020
Related issues
 wjhuang2016
·
3Comments
wjhuang2016
·
3Comments
 francis0407
·
3Comments
francis0407
·
3Comments
 tsthght
·
3Comments
tsthght
·
3Comments
 breeswish
·
3Comments
breeswish
·
3Comments
 tiancaiamao
·
3Comments
tiancaiamao
·
3Comments
Most helpful comment
thank you, ansible-playbook bootstrap.yml --extra-vars "dev_mode=True" works