Now that a first version of the DAP-based Theia debugger has been merged, we would like to make some improvements to the UI. The purpose of the changes is to improve the usability of the debugger in day-to-day operations, particularly for the case of multiple parallel debug sessions. We expect this case to be frequent when building services in and for the cloud. So here's the plan:
- [x] Make debug session tabs into Theia panels (#2846)
Currently the widgets representing a debug session are tabs inside a proper Theia panel. We want these widgets to be proper Theia panels so they can be dragged around. They should adjust their layout according to their boundaries: if the tab has more space vertically, the inner views (threads, variables, etc.) should stack vertically, when the tab is larger int he horizontal dimension, the views should be laid out horizontally. In particular, this allows to view two debug sessions in parallel by dragging the panel out of its usual location in a panel stack. - [x] Move step actions into panel toolbar (#2847)
We want to have buttons for suspend/resume/step, etc. to the local toolbar of the threads view of each debug session panel. This way, step actions are easily accessible and it is clear which debug session they apply to. [ ] Debug Panel
We'd like to introduce a panel containing the list of known debug configurations. As children of the debug configurations, we would show the debug sessions spawned from each configuration. If you happen to close a debug sesssion panel, you can get it back by double clicking the session in the deug panel.[ ] List of all breakpoints.
Currently, there is now view showing the list of breakpoints. Only when a debug session is started can you see the breakpoints which apply to the debug sessions. This would also provide a place for adding breakpoints (for example exception breakpoints) when no debug session is running.- [x] Expressions View (https://github.com/theia-ide/theia/pull/2944)
We would like to add a "debug console" to the debug sessions panel where the user can evaluate expressions in the current execution context. - [x] Reusing the debug panel for different debug sessions (https://github.com/theia-ide/theia/pull/3114)
 tsmaeder
All 19 comments
Here's a mockup of what we have in mind: 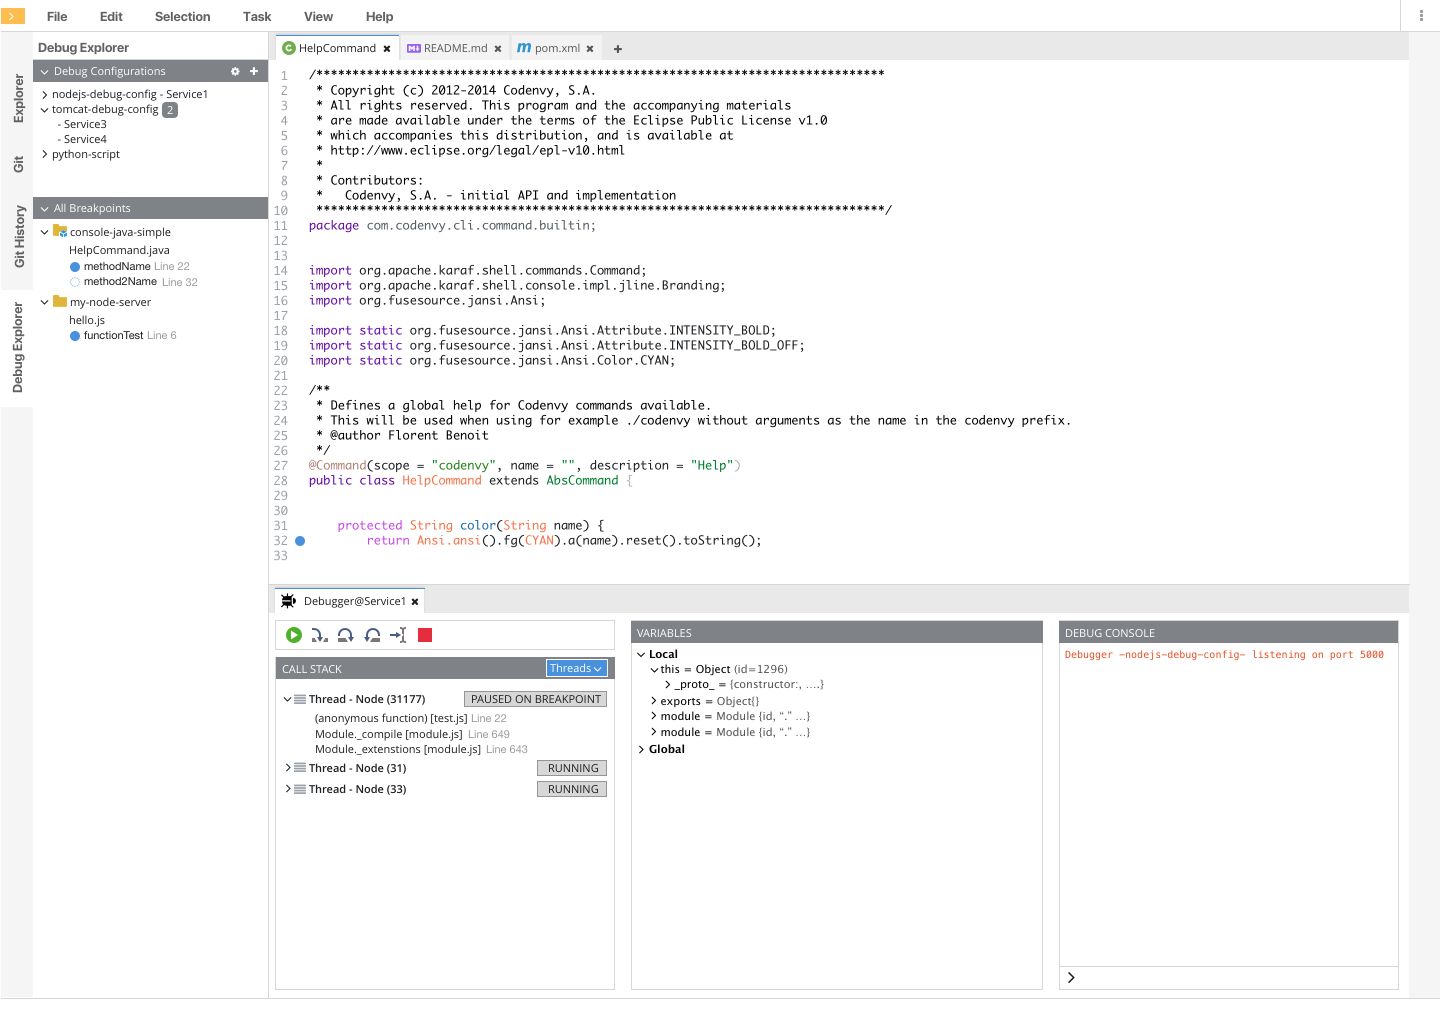
tsmaeder
on 11 Sep 2018
Theia doesn't support this kind of composable widgets. Introducing a secondary level of tab groups would impose quite some additional complexity to the UX. I suggest to do it in one widget, just like chrome dev tools or VS Code do.
Using an accordion to collapse everything you are not interested in works very well in those cases.
I like the possibility to switch between horizontal and vertical layout.
 svenefftinge
on 11 Sep 2018
svenefftinge
on 11 Sep 2018
@svenefftinge what do you mean "composable widgets"? The proposal does NOT call for a second level of tab groups. We want treat debug sessions like terminal windows: a new "panel" (prolly not the correct technical term) is opened when you start a debug session. It should be top level, so that it can be moved around the window. It's not right now.
tsmaeder
on 12 Sep 2018
@tsmaeder Ok I misunderstood it. The two panels looked like it contained arbitrary smaller things, configured by the user.
I am still skeptical as to whether your approach is really an improvement. I understand the desire to support multiple running debug sessions, but I feel that it can be easily done with one view by switching a context. Having always an extra view takes a lot of screen estate, which is a problem with debugging perspectives anyways.
I do work on microservice architectures and have to debug more than one process at the same time, but I cannot remember that I ever wanted to see both at the same time. So I doubt there is a competitive advantage with the proposed design.
svenefftinge
on 19 Sep 2018
I like the idea of moving the breakpoints list to the side panel (to match vscode). The current method (launched from the menu) isn't as intuitive.
 thegecko
on 21 Sep 2018
thegecko
on 21 Sep 2018
I like the debug UI from Chrome the most. Similarly to VS Code, it does not require much space with only 2 panels: the debug view and the debug console. But at the same time, it has rich functionality and better layout in the debug view. For example:
- it separates threads from call stacks, allowing to keep a selection between threads;
- it prints output from all debug session to the same debug console, but allow to filter them with a drop down.
In VS Code such things are not possible. In Eclipse, there are too many panels everywhere that one often ends up with a tiny editor in the middle.
 akosyakov
on 21 Sep 2018
akosyakov
on 21 Sep 2018

This is a screenshot of me attaching to the our wsagent process. I also debug jdt.ls in parallel. As wsagent has many, many threads, I have a hard time switching between a suspended thread in jdt.ls and one in wsagent. Yes, that problem exists switching between threads, as well, but it is reduced. What VSCode does is basically a copy of Eclipse, but minus the free placement of variables, etc.
tsmaeder
on 2 Oct 2018
Here is the explanation what is the debug console, how it gets populated by adapters and related to terminals:
VS Code supports 3 kinds of consoles to display debug output:
- the integrated terminal
- the external terminal (OS terminal)
- the debug console which does NOT support stdin and serves as well as the REPL
Existing implementations of debug adapters (Node.js, Chrome) assume by default that they are running in the debug console and use OutputEvent to send the output. If an adapter wants to open a terminal it sends RunInTerminal request:
- Node.js adapter allows to configure it as a part of a launch configuration: https://github.com/Microsoft/vscode-node-debug/blob/38cf4ef59353c56ecc522202f432f2c8688f64ba/package.json#L331-L345
- Chrome adapter apparently is always using the debug console.
OutputEvent allows adapters to enhance provided output with interactive information about variables and source location which is not possible to display in terminals, so everything from OutputEvent always ends up in the debug console and never in terminals.
Do not confuse, OutputEvent is not mean to implement the REPL, for it, there is Evaluate request which can be called as from the debug console but as well from other contexts as the watch or hovers.
akosyakov
on 4 Oct 2018
It is how the debug console looks now if i try to align it as on a mockup:
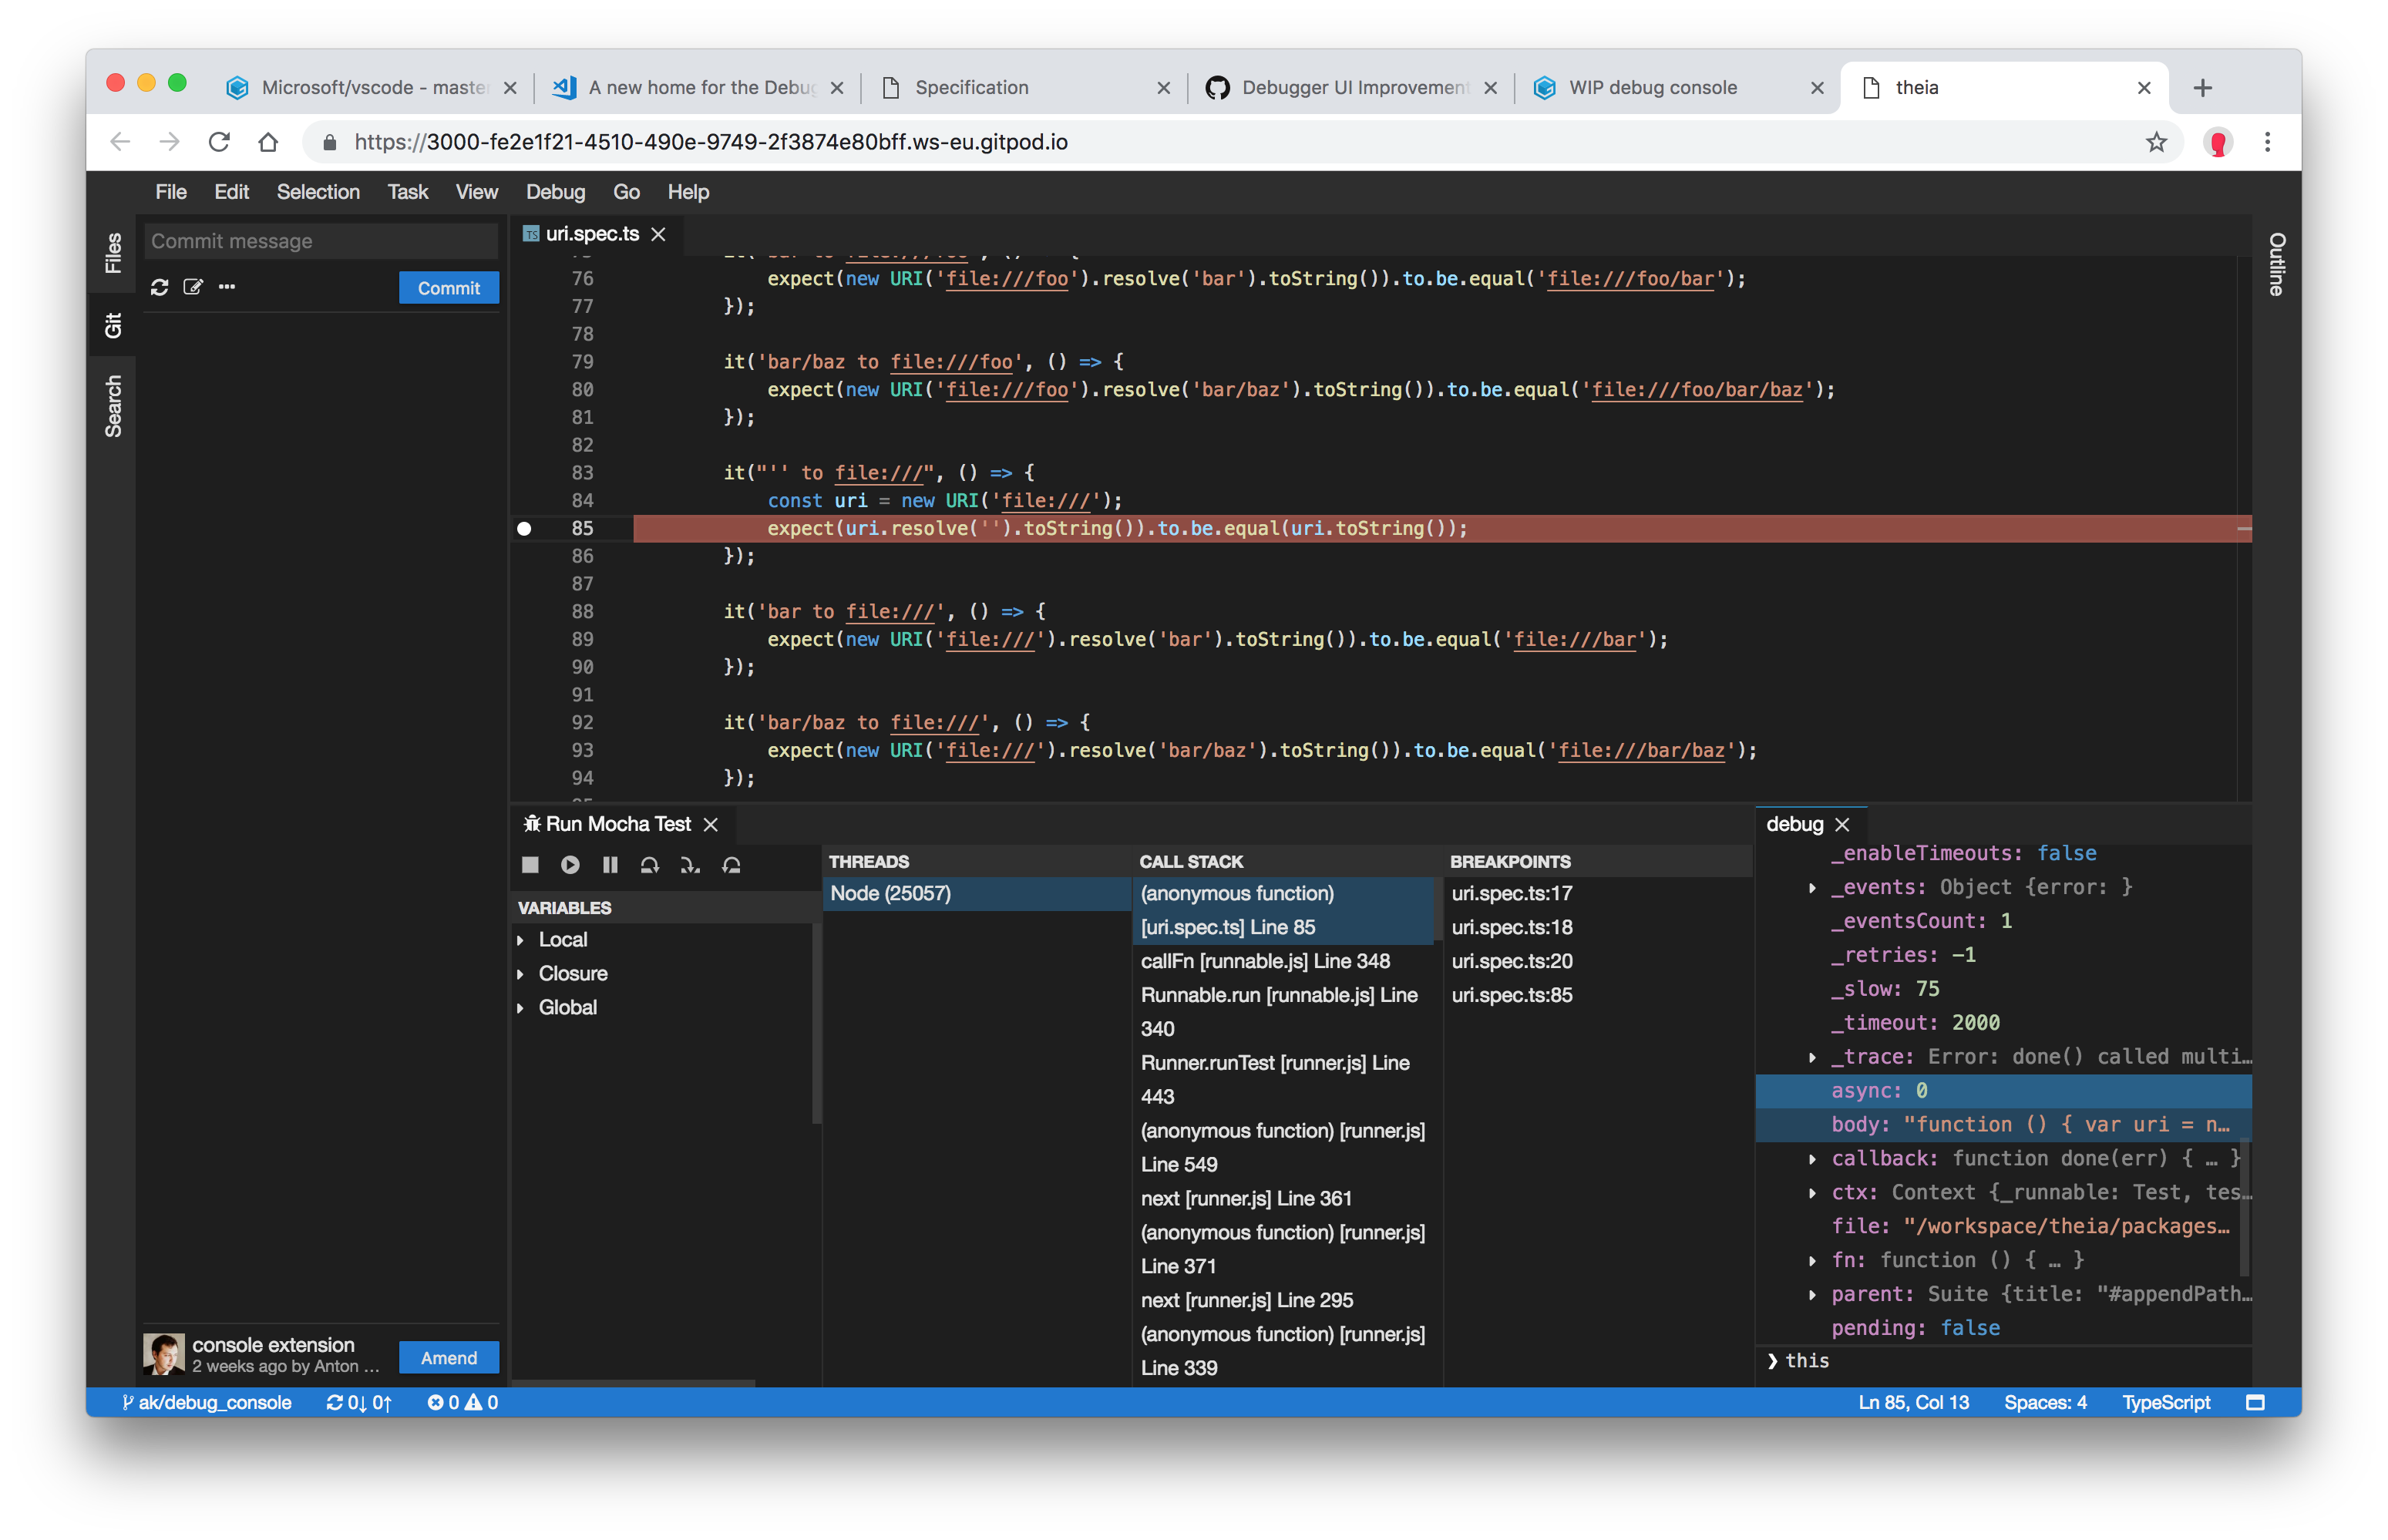
It can have a lot of ouput, in my opinion it deserves a separate panel.
akosyakov
on 4 Oct 2018
I have a hard time switching between a suspended thread in jdt.ls and one in wsagent.
You can switch between them using the drop down in the floating toolbar.
svenefftinge
on 4 Oct 2018
We agreed on the following requirements:
- It should be possible to run each session in its own widget or all sessions in one widget with a drop-down.
- There should not be a separate widget to display configurations and global breakpoints.
- There should be one debug console (REPL) which is sensitive to a currently active session and frame, as it is now.
akosyakov
on 5 Oct 2018
@akosyakov
Right now I am working on 1 (ability to reuse the widget for different debug sessions)
 tolusha
on 5 Oct 2018
tolusha
on 5 Oct 2018
@tolusha ok, I can focus on polishing internals of the widget then.
akosyakov
on 5 Oct 2018
We agreed on the following requirements:
* It should be possible to run each session in its own widget or all sessions in one widget with a drop-down.That is not how I remember it: what I was proposing is that we reuse open debug widgets and have the drop-down as an alternative to the "Debug Configurations" view that is in the design.
* There should not be a separate widget to display configurations and global breakpoints.Again, not sure if the widget makes sense if we have the debug configs drop down, but that doesn't mean we can have it to be opened on demand.
* There should be one debug console (REPL) which is sensitive to a currently active session and frame, as it is now.I wholeheartedly agree with this one :-)
tsmaeder
on 5 Oct 2018
There should not be a separate widget to display configurations and global breakpoints.
Just have a look what I have in my mind https://github.com/theia-ide/theia/pull/3111
tolusha
on 7 Oct 2018
That is not how I remember it: what I was proposing is that we reuse open debug widgets and have the drop-down as an alternative to the "Debug Configurations" view that is in the design.
I've put it in this way to ensure that your and our interest are taken into account.
Yes, we agreed with your point that separate session widgets could be useful for Java with lots of threads, but there are other use cases like Node.js. For example, in this case it will spawn 9 new widgets by running a single configuration when in the Node.js world a process is a just single thread and showing them together does not crowd UI so much.
We want to make sure that a user can choose. I'm waiting for https://github.com/theia-ide/theia/issues/2843#issuecomment-427382631 before starting working on it.
Again, not sure if the widget makes sense if we have the debug configs drop down, but that doesn't mean we can have it to be opened on demand.
Please see on #3111. But ok, we could have it, if it does not get on a way of a user and it is not a main debug view.
akosyakov
on 8 Oct 2018
I've put it in this way to ensure that your and our interest are taken into account.
That is fair enough, but please be precise on what we agreed on. Also, this is not about "our interests". I think we can make this a win-win situation without compromising the UI.
Yes, we agreed with your point that separate session widgets could be useful for Java with lots of threads, but there are other use cases like Node.js. For example, in this case it will spawn 9 new widgets by running a single configuration when in the Node.js world a process is a just single thread and showing them together does not crowd UI so much.
Is a cluster of 9 node instances a common case? Also, the tabs will be stacked, so all the crowed is the tab list. In return, you'll have more room for each processes stacks in the "call stack" view.
Also, if the stack depth is anything bug trivial, you can't see two stacks in parallel anyway in the limited space that you have in the "call stack" widget, since you have to scroll. The separate tabs would actually allow you to see them in parallel. So your objection is really how we show and select processes under debug. Maybe the "debug view" that shows running processes is not such a bad idea after all? Why don't we give our approach a try before throwing the bathwater out?
tsmaeder
on 10 Oct 2018
I've added debugViewLocation option to debug configuration that a user can specify a UI location to show a session. It can be either debug to show within the debug widget only or one of the sidebars.
The debug widget always shows all running sessions and allow to open them to sidebars or reveal already opened:
- users can collapse
Call StackandVariablesparts if they don't want to see them. We can have a context menu to hide parts. This feature will be generically interesting for all view containers. Breakpointspart is always showing all breakpoints but in context of the selected session or global.- The call stack and thread selections are preserved between threads and sessions accordingly.
It is not final, the PR is here: https://github.com/theia-ide/theia/pull/3119 It's waiting for the review from @svenefftinge
akosyakov
on 17 Oct 2018
@akosyakov looking at the demo, I've had this idea: We could start with a single view for debugging: under "Threads", you see all targets being debugged, showing their threads (as it is now).
Now, how about if I could grab a debug target and drag it to a location ("right") and just drop it there to start a second debug view? That way, we would not have to put anything in the debug configuration and I think it would be super intuitive.
Once the second debug view is open, I can drag and drop more debug targets to the view, or open more debug views by dropping debug targets at the appropriate location.
What do you think? Feasible? Desireable?
tsmaeder
on 31 Oct 2018
Related issues
 vinokurig
·
3Comments
akosyakov
·
3Comments
akosyakov
·
3Comments
vinokurig
·
3Comments
akosyakov
·
3Comments
akosyakov
·
3Comments
 cekvenich
·
3Comments
cekvenich
·
3Comments
 kittaakos
·
3Comments
kittaakos
·
3Comments