Thanos: query: inflated rate during counter reset
Version 0.5.0 on go1.12.5
I'm sometimes seeing unexpected spikes in my rate queries during counter resets:

The deduplicated counter is an accurate representation of the two replicas:
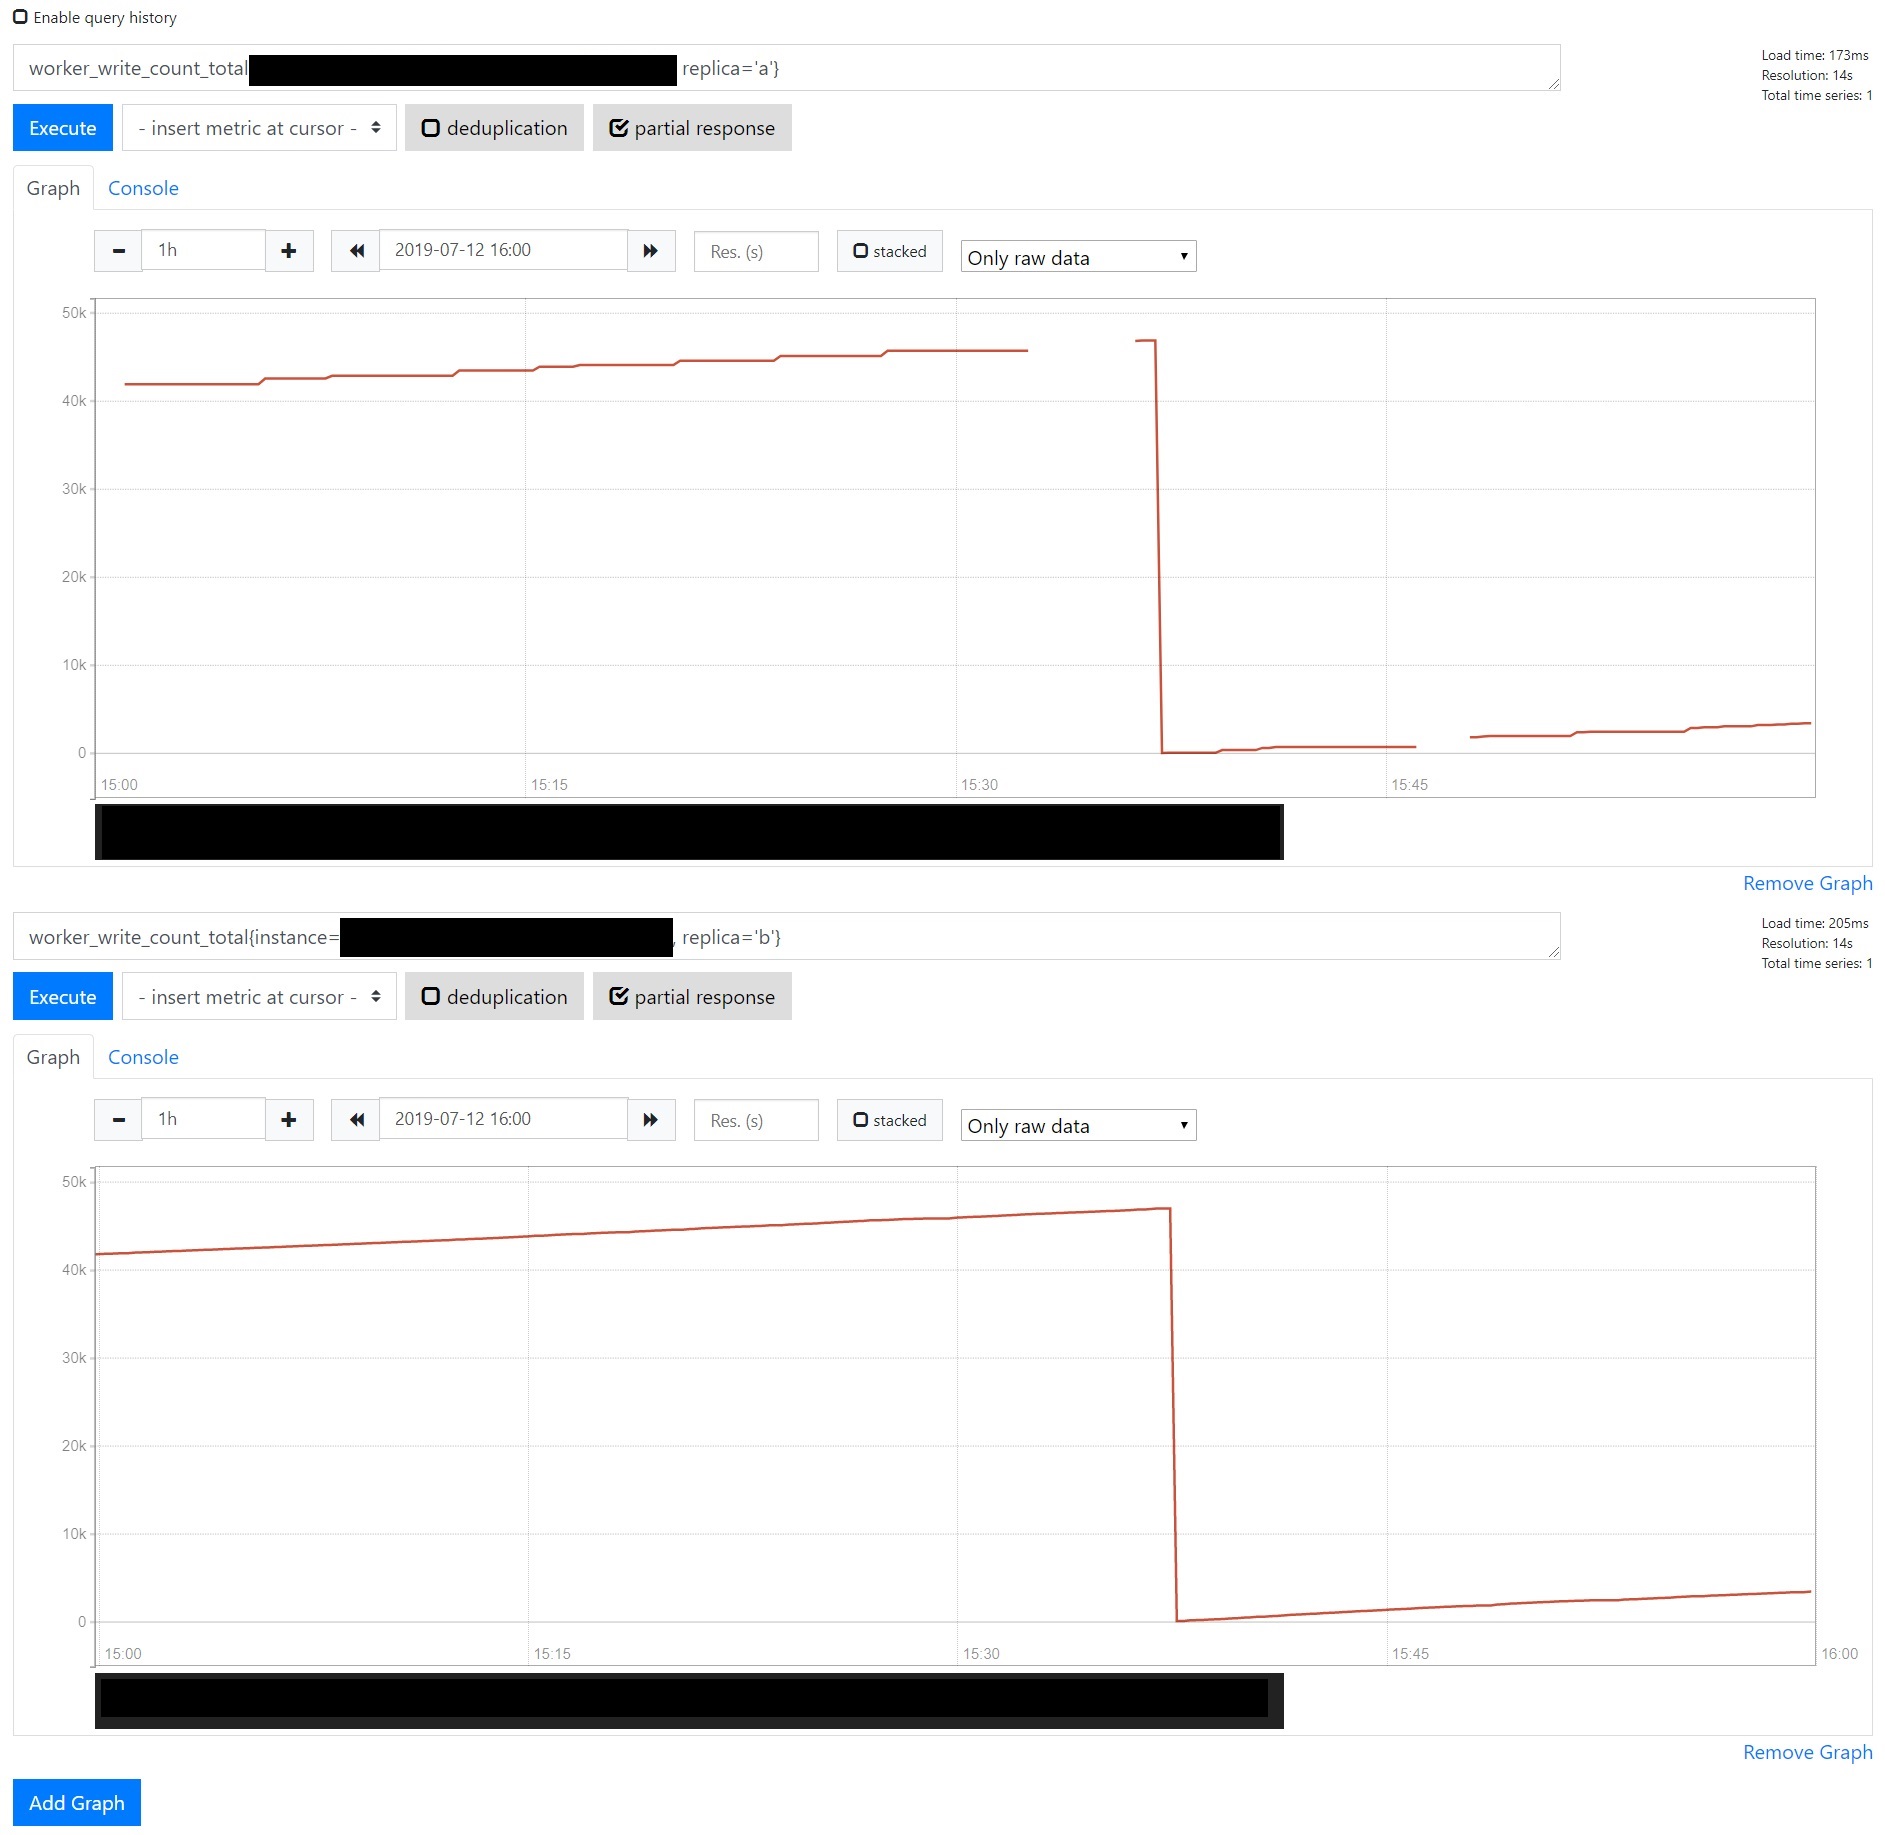
Looking at the numbers with dedup=false there's a small overlap where one of the replicas reports the reset a few samples before the other, which might be a factor if the rate is being calculated across replicas:
ts | replica a | replica b | deduplicated | [5m] rate
-- | -- | -- | -- | --
1562945818 | 46906 | 47000 | 47000 | 2.4
1562945832 | 42 | 47000 | 47000 | 2.31
1562945846 | 66 | 47000 | 66 | 168.8
1562945860 | 66 | 115 | 66 | 164.81
1562945874 | 66 | 115 | 66 | 162.58
1562945888 | 66 | 201 | 201 | 163.5
 llaaiiqq
All 18 comments
I have to look more closely into it but I think we are also seeing this bug from time to time jus did not find the time to analyze it.
 FUSAKLA
on 15 Jul 2019
FUSAKLA
on 15 Jul 2019
I am also seeing a very similar issue where the following query:
avg(rate(node_cpu_seconds_total{mode="idle"}[1m])) by (hostname)*100.00
Host-1 = 98.98200000001816
Host-2 = 1596023.3499794072
Host-3 = 95.270366926
 cwolfinger
on 22 Jul 2019
cwolfinger
on 22 Jul 2019
To add a further comment - if I add the following filters:
- replica="prometheus-0"
- replica="prometheus-1"
- replica="prometheus-2"
- replica=~"prometheus-[0|1]"
The results are all ok - if I mix in the any of the following filters the results are incorrect: - replica=~"prometheus-[1|2]" - max value seen in returned query 110
- replica=~"prometheus-[0|2]" - result value seen in returned query 500,000
So the addition of the 3rd replica seems to cause the "rate / irate" function to misbehave - there are no unusual logs in the thanos-sidecar or the thanos query or the prometheus.
Version used is .6
cwolfinger
on 22 Jul 2019
Further comment the spikes I am seeing are not related to counter resets.
cwolfinger
on 23 Jul 2019
So I finally found the time to look into this.
I think the issue is in de-duplication in combination with increase or rate and somehow frequent holes in HA Prometheus replicas (rolling update + some SD delay, rolling update of HA Prometheus instances, target's /metrics endpoint randomly timing out). Unfortunately I'm not able to simulate it.
The exact symptom is way higher increase for deduplicated query than for increases for separate replicas without the deduplication
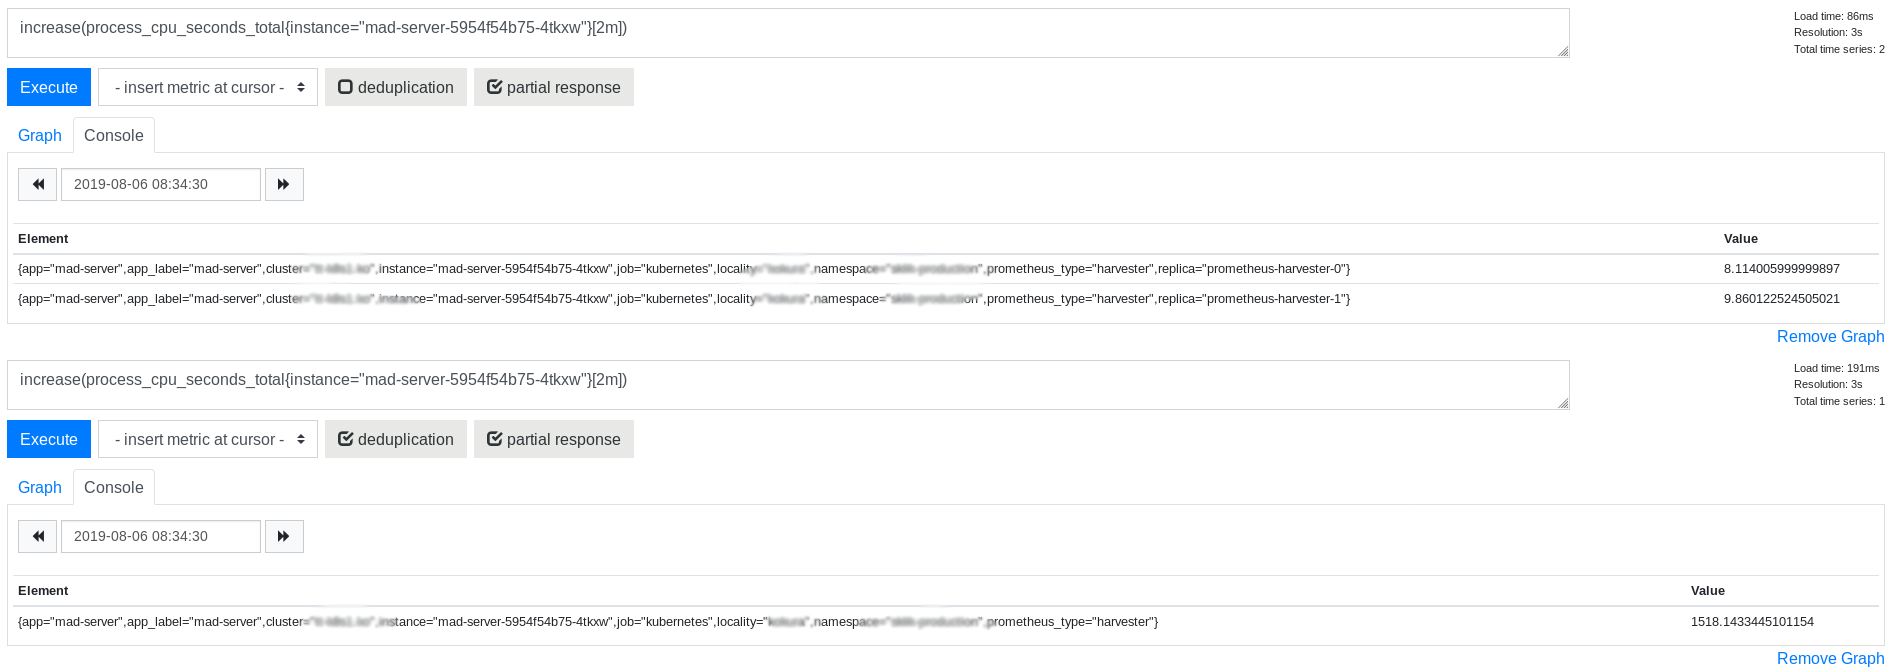
Interesting part is that raw data seems to look ok for the same range selector
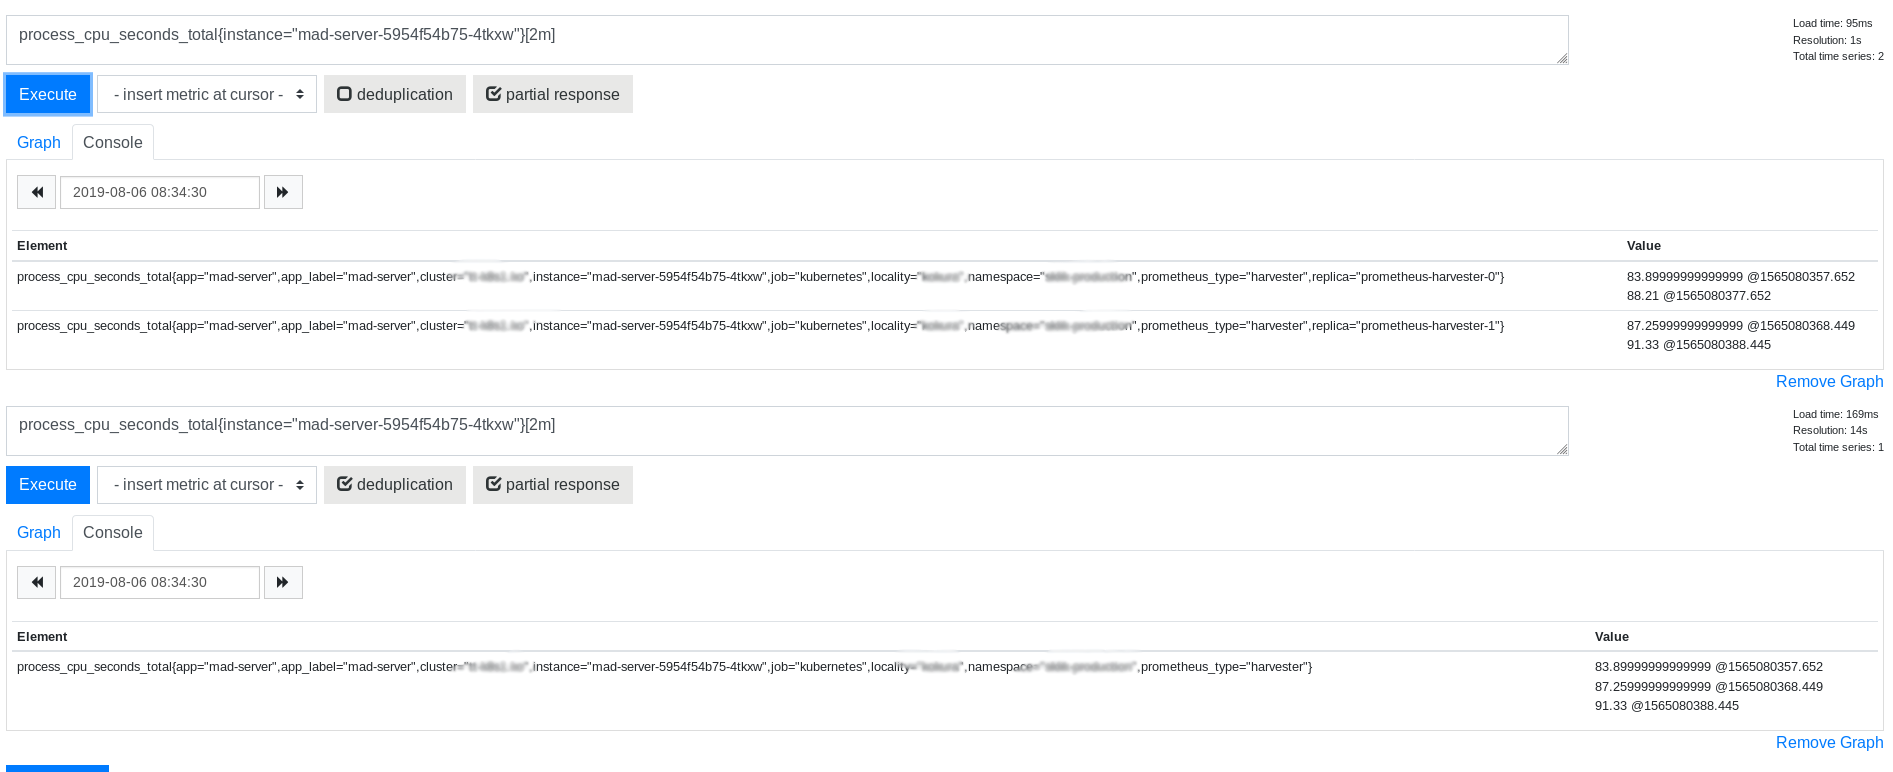
So this leads to my suspicion on the combination of deduplication and increase.
If anyone has any clues where to look I'll be glad for any direction or advice. I'm going through the whole query evaluation code path to the PromQL engine and trying to find any possible clue so it's going slowly.
FUSAKLA
on 18 Aug 2019
Finally managed to create a test case where the issue happens so now I can at least verify if I manage to fix it :smile:
FUSAKLA
on 20 Aug 2019
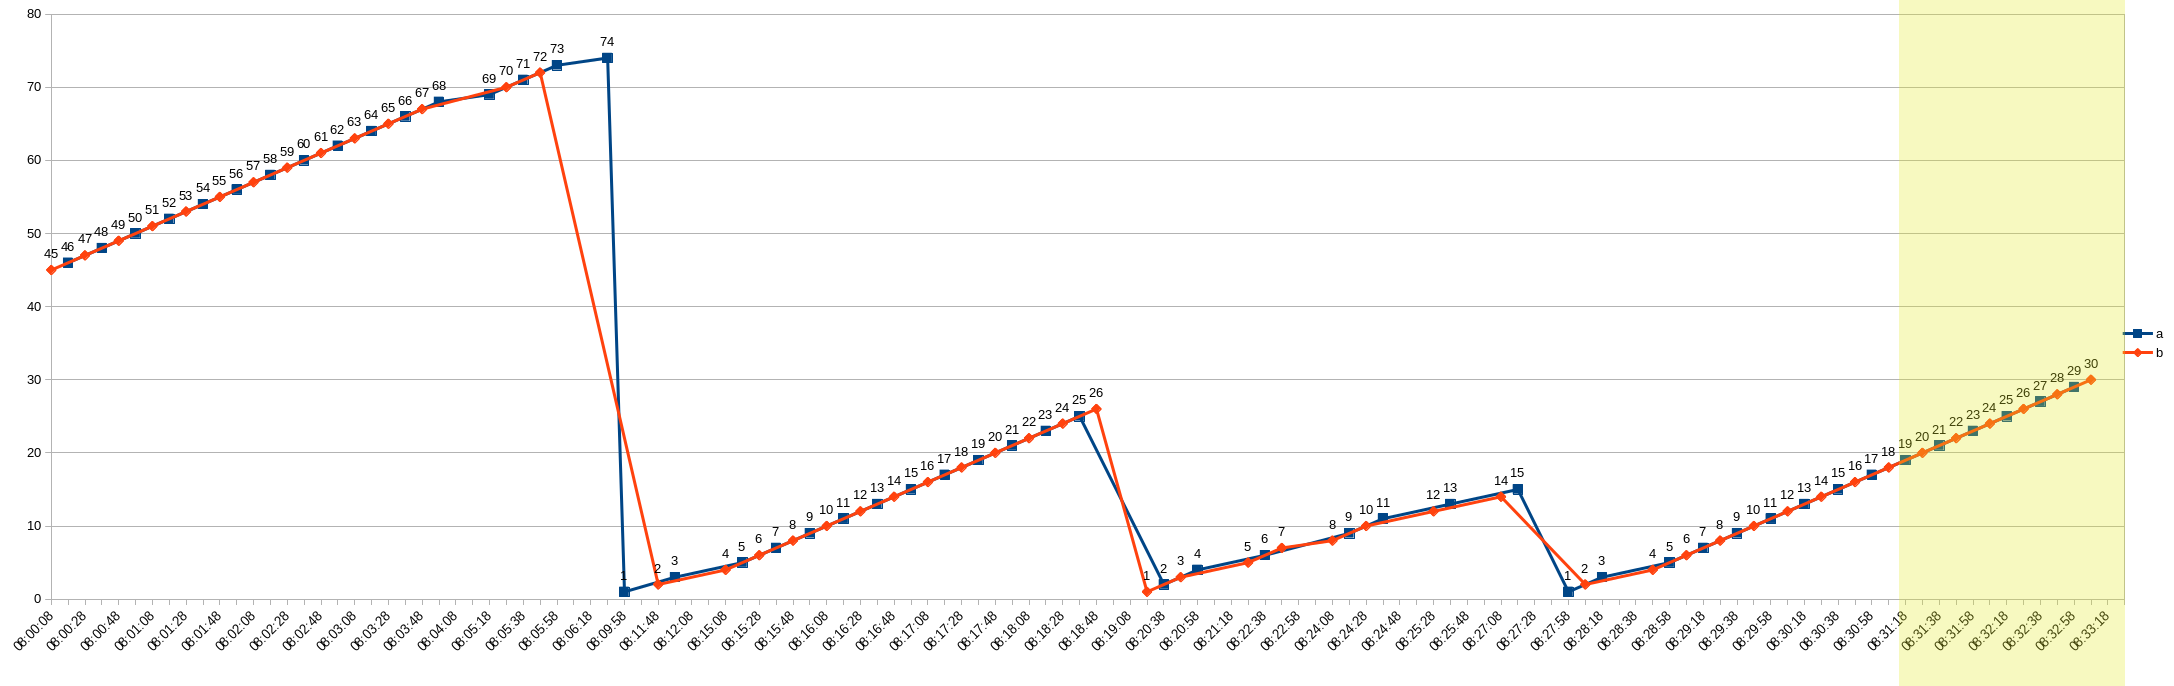
Ok, so the issue is caused by counter resets as suspected. The root cause is that because of those resets and one replica managing to scrape the target one more time than the other it has higher counter value. Illustrated on the next two figures. There were timeouts on target scrapes and some target restarts during that observation time.
Raw data in the chunk returned by the Thanos query for the query for both replicas
Data returned by the iterator with counter resets applied
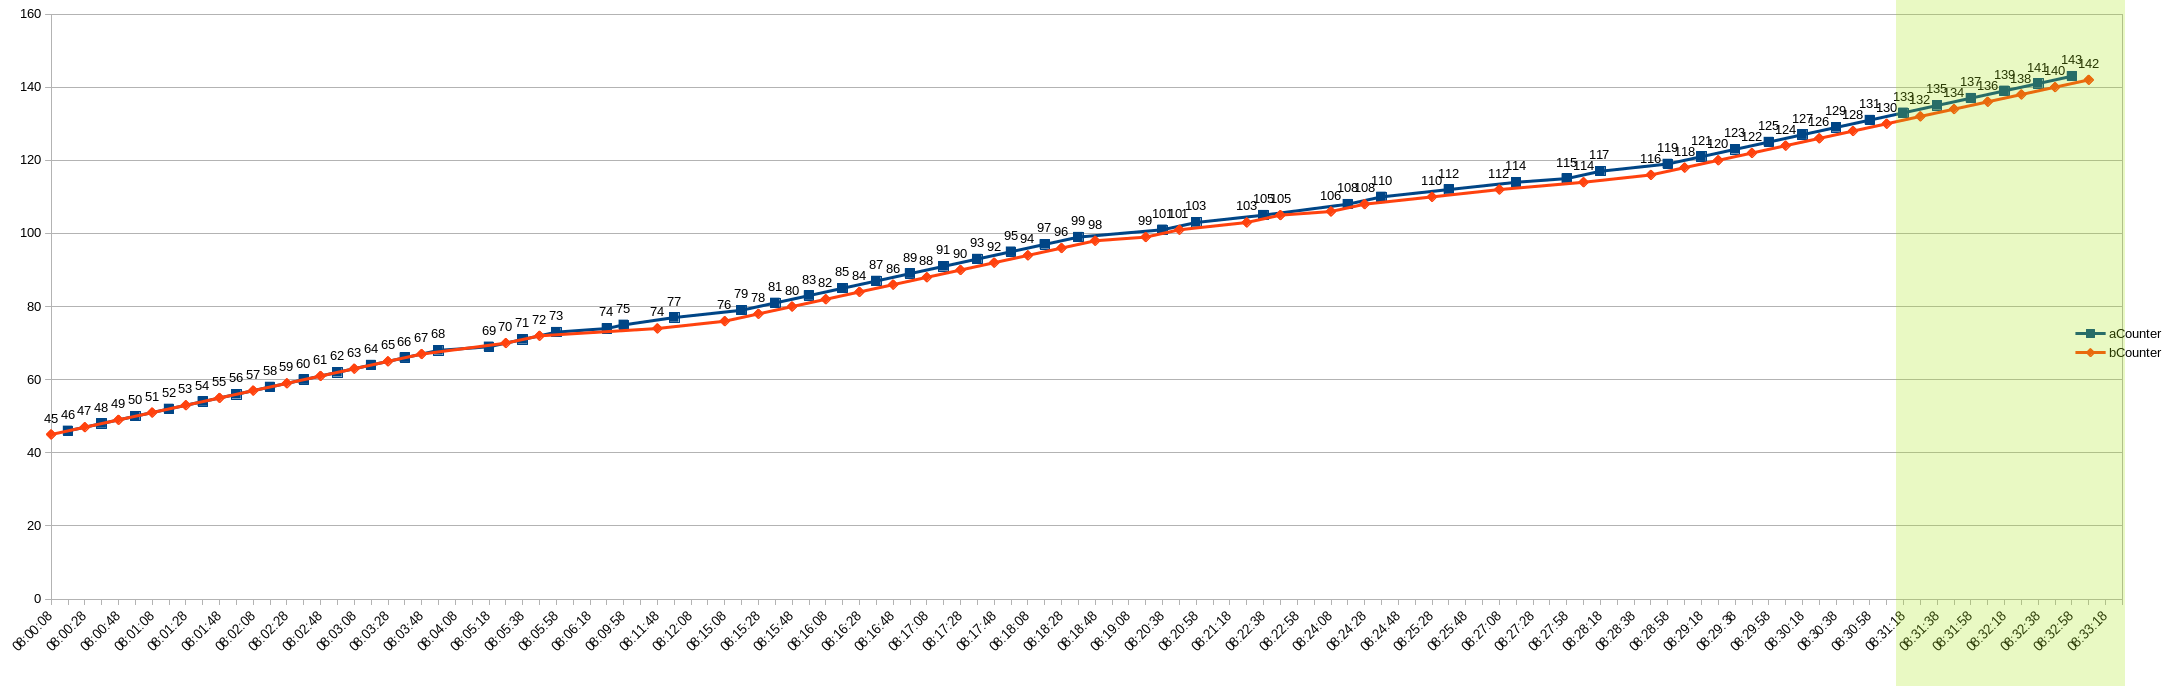
This data chunk is returned by the Thanos query for instant query increase(metric_name[2m]).
The time range used for evaluation 2m is highlighted with the yellow stripes. The blue replica a has lower timestamps of data points which is preferred by the deduplication algorithm so it is the main replica. But if this replica goes down, the algorithm will switch after applying the penalty to the backup b replica. But this other replica has lower value which is then treated in increase or rate function evaluation as a reset and is handled that way. So the b replica value is added to the previous a replica value. This leads to those enormous spikes.
Few interesting findings:
- the counter reset handling is applied on two places:
- in the
extrapolatedRatefunction in PromQL - in the Thanos
CounterSeriesIteratorfunctionNext
- in the
- Using the
CounterSeriesIteratorcauses the query to be affected by the data out of the range selector time interval, If the deduplication took place before applying the counter resets (as on the figure 1) the result will be ok.
I tried to switch to the newChunkSeriesIterator(its) here same way as other aggregates and it resolves this one particular issue.
https://github.com/thanos-io/thanos/blob/865d5ec710b5651ead08a7dc73864a6f5dbeeaa9/pkg/query/iter.go#L143
But I'm sure the CounterSeriesIterator has it's reason to be there so it won't be definitely so easy :)
Unfortunately we are hitting this issue from time to time and when it happens in SLO calculations it ruins them completely so it is pretty serious bug for us.. I'd be glad to fix it but we need to discuss how to do it. Applying deduplication before the counter resets could solve it but I'm not sure if this is the right way or should we switch to completely different solution of deduplication?
FUSAKLA
on 26 Aug 2019
Did you manage to discuss the solution of the problem? We faced the same issue.
 bogdanov1609
on 25 Sep 2019
bogdanov1609
on 25 Sep 2019
Hi, sorry for the delay. Unfortunately I did not find the time but next week I should manage to get to it.
I actually tested the deduplication before counter resets with success but I need to dig in more to see what would be impact of such change. I'm afraid it could cause issues with down sampled data.
FUSAKLA
on 28 Sep 2019
This issue has been automatically marked as stale because it has not had recent activity. It will be closed if no further activity occurs. Thank you for your contributions.
![stale[bot] picture](https://avatars3.githubusercontent.com/in/1724?v=4&s=40) stale[bot]
on 11 Jan 2020
stale[bot]
on 11 Jan 2020
This issue/PR has been automatically marked as stale because it has not had recent activity. Please comment on status otherwise the issue will be closed in a week. Thank you for your contributions.
stale[bot]
on 27 Feb 2020
Still, to investigate.
On Thu, 27 Feb 2020 at 11:14, stale[bot] notifications@github.com wrote:
This issue/PR has been automatically marked as stale because it has not
had recent activity. Please comment on status otherwise the issue will be
closed in a week. Thank you for your contributions.—
You are receiving this because you are subscribed to this thread.
Reply to this email directly, view it on GitHub
https://github.com/thanos-io/thanos/issues/1326?email_source=notifications&email_token=ABVA3O7OHUMF73C7JXAHNQTRE6OC5A5CNFSM4ICONOZ2YY3PNVWWK3TUL52HS4DFVREXG43VMVBW63LNMVXHJKTDN5WW2ZLOORPWSZGOEND65RI#issuecomment-591916741,
or unsubscribe
https://github.com/notifications/unsubscribe-auth/ABVA3O2U6TUOI2YWQUPUQILRE6OC5ANCNFSM4ICONOZQ
.
 bwplotka
on 27 Feb 2020
bwplotka
on 27 Feb 2020
This issue/PR has been automatically marked as stale because it has not had recent activity. Please comment on status otherwise the issue will be closed in a week. Thank you for your contributions.
stale[bot]
on 19 Apr 2020
Not fixed.
On Sun, 19 Apr 2020 at 11:40, stale[bot] notifications@github.com wrote:
This issue/PR has been automatically marked as stale because it has not
had recent activity. Please comment on status otherwise the issue will be
closed in a week. Thank you for your contributions.—
You are receiving this because you commented.
Reply to this email directly, view it on GitHub
https://github.com/thanos-io/thanos/issues/1326#issuecomment-616099884,
or unsubscribe
https://github.com/notifications/unsubscribe-auth/ABVA3O5I2EQDG6LBHWX3TBTRNLIITANCNFSM4ICONOZQ
.
bwplotka
on 20 Apr 2020
@FUSAKLA did you ever find a solution to this? We are hitting this issue now.
 ipstatic
on 20 Apr 2020
ipstatic
on 20 Apr 2020
Just curious @superQ if this is not the exactly same issue as we started to investigate here: https://github.com/thanos-io/thanos/issues/2401
Let's join forces (((:
bwplotka
on 21 Apr 2020
Yes, it could be the same problem. It seems like it's related to handling resets and multiple chunks in the chunk streaming API.
 SuperQ
on 21 Apr 2020
SuperQ
on 21 Apr 2020
Ok, I can confirm this is the same as https://github.com/thanos-io/thanos/issues/2401
Given the other issue is more active (I described all the details on findings) I will close this issue as duplicate https://github.com/thanos-io/thanos/issues/2401
bwplotka
on 28 Apr 2020
Related issues
 miekg
·
30Comments
miekg
·
30Comments
 mattbostock
·
32Comments
mattbostock
·
32Comments
 Capitrium
·
46Comments
Capitrium
·
46Comments
 smalldirector
·
33Comments
smalldirector
·
33Comments
 0robustus1
·
27Comments
0robustus1
·
27Comments
Most helpful comment
Ok, so the issue is caused by counter resets as suspected. The root cause is that because of those resets and one replica managing to scrape the target one more time than the other it has higher counter value. Illustrated on the next two figures. There were timeouts on target scrapes and some target restarts during that observation time.
Raw data in the chunk returned by the Thanos query for the query for both replicas

Data returned by the iterator with counter resets applied

This data chunk is returned by the Thanos query for instant query
increase(metric_name[2m]).The time range used for evaluation
2mis highlighted with the yellow stripes. The blue replicaahas lower timestamps of data points which is preferred by the deduplication algorithm so it is the main replica. But if this replica goes down, the algorithm will switch after applying the penalty to the backupbreplica. But this other replica has lower value which is then treated inincreaseorratefunction evaluation as a reset and is handled that way. So the b replica value is added to the previousareplica value. This leads to those enormous spikes.Few interesting findings:
extrapolatedRatefunction in PromQLCounterSeriesIteratorfunctionNextCounterSeriesIteratorcauses the query to be affected by the data out of the range selector time interval, If the deduplication took place before applying the counter resets (as on the figure 1) the result will be ok.I tried to switch to the
newChunkSeriesIterator(its)here same way as other aggregates and it resolves this one particular issue.https://github.com/thanos-io/thanos/blob/865d5ec710b5651ead08a7dc73864a6f5dbeeaa9/pkg/query/iter.go#L143
But I'm sure the
CounterSeriesIteratorhas it's reason to be there so it won't be definitely so easy :)Unfortunately we are hitting this issue from time to time and when it happens in SLO calculations it ruins them completely so it is pretty serious bug for us.. I'd be glad to fix it but we need to discuss how to do it. Applying deduplication before the counter resets could solve it but I'm not sure if this is the right way or should we switch to completely different solution of deduplication?