Teslamate: Poor Elevation scale in Drive Details
I'm a new user since yesterday, and am very impressed so far.
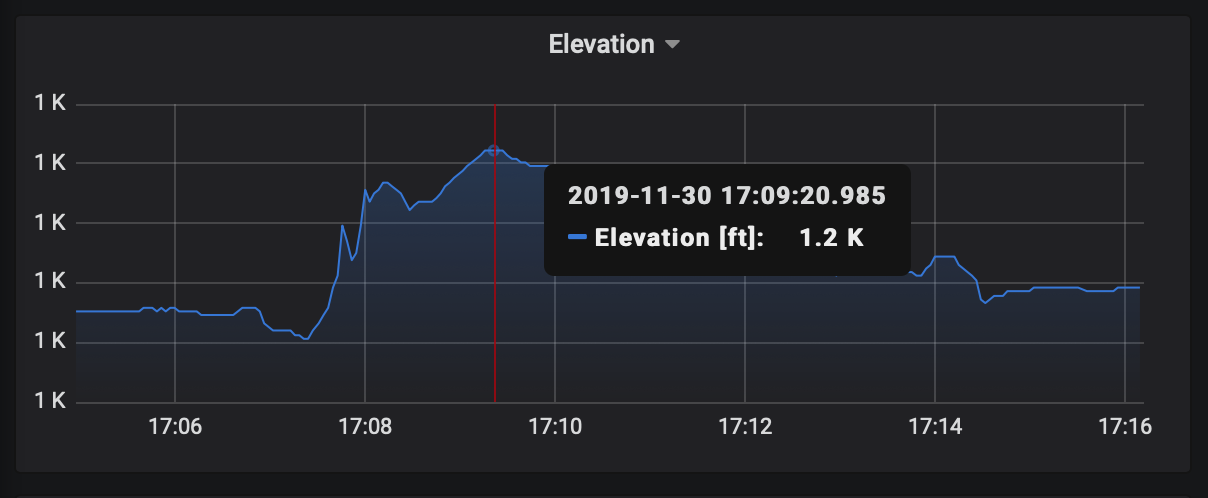
I note that the Elevation plots in the Drive Details view have a very poor Y axis scale. The elevation range for this drive is roughly 1100 ft to 1200 ft, but every Y axis tick is labeled as "1K", and the details that appear when hovering over the plot with the cursor are all labeled either "1.1K" or "1.2".
See attached screenshot.
Is there some Grafna tweak I need to make?
I'm running TeslaMate in Docker on Ubuntu 19.10.
 khorton
All 2 comments
I'm a new user since yesterday, and am very impressed so far.
Thanks!
Is there some Grafna tweak I need to make?
I'll update the scale with the next release :-)
In principle, the dashboards can be fully customized. If you'd like to fix it yourself in the meantime do this:
- sign in with the default user
admin(password isadmin) - Click edit on the elevation graph and change
Visualization > Axes > Left Y > Unittonone - Save the dashboard as JSON and import it as a new dashboard
 adriankumpf
on 2 Dec 2019
adriankumpf
on 2 Dec 2019
Thanks for the assistance. That worked. I'll dig into the Grafna docs to figure out how to link my modified dashboard to the Drives dashboard (assuming that all my changes will be overwritten when the next release comes out - I better validate that assumption before I go too crazy with changes).
khorton
on 3 Dec 2019
Related issues
 netkruzer
·
6Comments
netkruzer
·
6Comments
 tobiasehlert
·
4Comments
tobiasehlert
·
4Comments
 bahree
·
3Comments
bahree
·
3Comments
 jun3280net
·
4Comments
jun3280net
·
4Comments
 natrlhy
·
6Comments
natrlhy
·
6Comments
Most helpful comment
Thanks for the assistance. That worked. I'll dig into the Grafna docs to figure out how to link my modified dashboard to the Drives dashboard (assuming that all my changes will be overwritten when the next release comes out - I better validate that assumption before I go too crazy with changes).