Tensorboard: Profiling not showing up in Firefox 70
Environment information (required)
Please run diagnose_tensorboard.py (link below) in the same
environment from which you normally run TensorFlow/TensorBoard, and
paste the output here:
Diagnostics
Diagnostics output
``````
--- check: autoidentify
INFO: diagnose_tensorboard.py version 9bd44fb6775a3136318041872718de2aadc4bba0
--- check: general
INFO: sys.version_info: sys.version_info(major=3, minor=6, micro=8, releaselevel='final', serial=0)
INFO: os.name: posix
INFO: os.uname(): posix.uname_result(sysname='Linux', nodename='raph', release='4.15.0-1059-oem', version='#68-Ubuntu SMP Sat Oct 12 04:02:24 UTC 2019', machine='x86_64')
INFO: sys.getwindowsversion(): N/A
--- check: package_management
INFO: has conda-meta: False
INFO: $VIRTUAL_ENV: '/home/raph/mnist_examples/venv'
--- check: installed_packages
INFO: installed: tensorboard==2.0.1
INFO: installed: tensorflow==2.0.0
INFO: installed: tensorflow-estimator==2.0.1
--- check: tensorboard_python_version
INFO: tensorboard.version.VERSION: '2.0.1'
--- check: tensorflow_python_version
INFO: tensorflow.__version__: '2.0.0'
INFO: tensorflow.__git_version__: 'v2.0.0-rc2-26-g64c3d38'
--- check: tensorboard_binary_path
INFO: which tensorboard: b'/home/raph/mnist_examples/venv/bin/tensorboard\n'
--- check: readable_fqdn
INFO: socket.getfqdn(): 'raph'
--- check: stat_tensorboardinfo
INFO: directory: /tmp/.tensorboard-info
INFO: os.stat(...): os.stat_result(st_mode=16895, st_ino=7340626, st_dev=66307, st_nlink=2, st_uid=1001, st_gid=1001, st_size=4096, st_atime=1572559676, st_mtime=1572561856, st_ctime=1572561856)
INFO: mode: 0o40777
--- check: source_trees_without_genfiles
INFO: tensorboard_roots (1): ['/home/raph/mnist_examples/venv/lib/python3.6/site-packages']; bad_roots (0): []
--- check: full_pip_freeze
INFO: pip freeze --all:
absl-py==0.8.1
astor==0.8.0
cachetools==3.1.1
certifi==2019.9.11
chardet==3.0.4
gast==0.2.2
google-auth==1.6.3
google-auth-oauthlib==0.4.1
google-pasta==0.1.7
grpcio==1.24.3
h5py==2.10.0
idna==2.8
Keras-Applications==1.0.8
Keras-Preprocessing==1.1.0
Markdown==3.1.1
numpy==1.17.3
oauthlib==3.1.0
opt-einsum==3.1.0
pip==19.3.1
pkg-resources==0.0.0
protobuf==3.10.0
pyasn1==0.4.7
pyasn1-modules==0.2.7
requests==2.22.0
requests-oauthlib==1.2.0
rsa==4.0
setuptools==41.6.0
six==1.12.0
tensorboard==2.0.1
tensorflow==2.0.0
tensorflow-estimator==2.0.1
termcolor==1.1.0
urllib3==1.25.6
Werkzeug==0.16.0
wheel==0.33.6
wrapt==1.11.2
``````
Next steps
No action items identified. Please copy ALL of the above output,
including the lines containing only backticks, into your GitHub issue
or comment. Be sure to redact any sensitive information.
For browser-related issues, please additionally specify:
- Browser type and version (e.g., Chrome 64.0.3282.140): Firefox 70.0
- Screenshot, if it’s a visual issue:
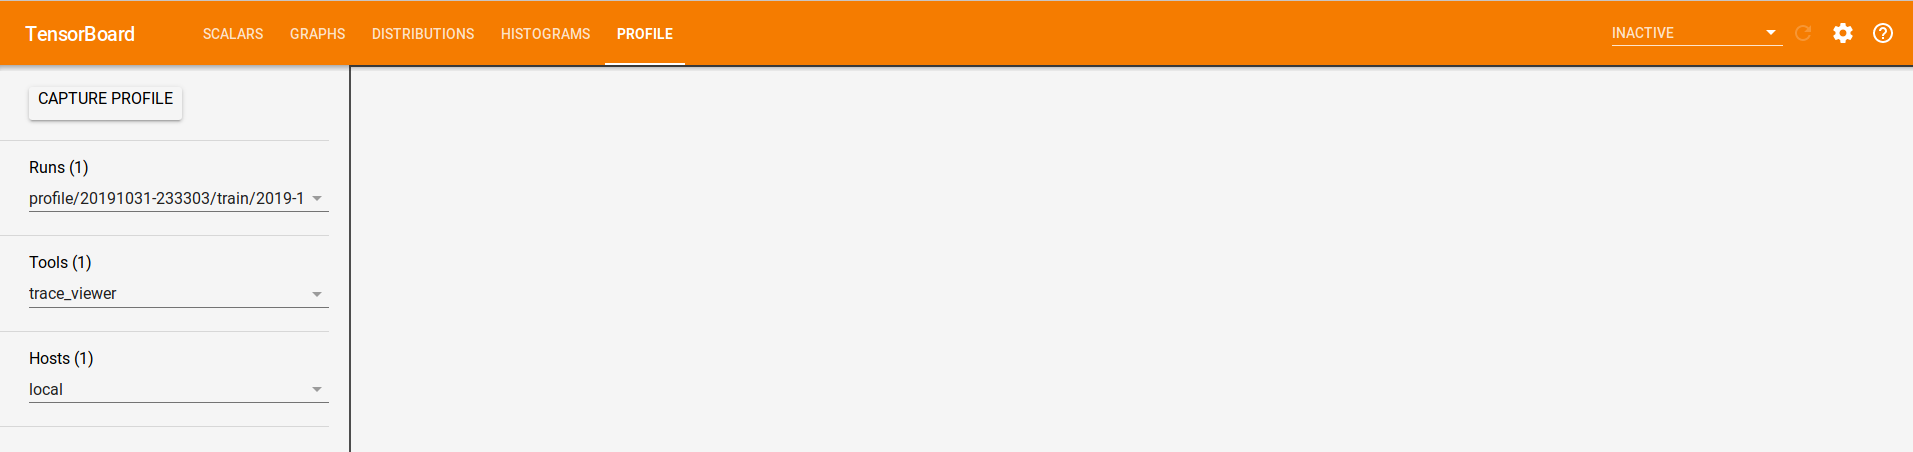
Issue description
Profile is not showing up in Firefox 70.0. Same logs directory is properly showing up in Chrome.
from __future__ import absolute_import, division, print_function, unicode_literals

# TensorFlow and tf.keras
import tensorflow as tf
from tensorflow import keras

import numpy as np

print(tf.__version__)
print(tf.config.experimental.list_physical_devices('GPU'))

fashion_mnist = keras.datasets.fashion_mnist

(train_images, train_labels), (test_images, test_labels) = fashion_mnist.load_data()

model = keras.Sequential([
    keras.layers.Flatten(input_shape=(28, 28)),
    keras.layers.Dense(128, activation='relu'),
    keras.layers.Dense(10, activation='softmax')
])

model.compile(optimizer='adam',
              loss='sparse_categorical_crossentropy',
              metrics=['accuracy'])

model.fit(train_images, train_labels, batch_size=64, epochs=10, callbacks=[tf.keras.callbacks.TensorBoard(profile_batch=3)])
 RaphaelMeudec
All 12 comments
Thanks for the report. The core issue is that the Trace Viewer used by the Profile plugin is built using an old, experimental library "polymer-micro" that doesn't work in Firefox, Safari.
I've filed a bug in the Chromium project to see if it can be fixed there.
https://bugs.chromium.org/p/chromium/issues/detail?id=1020620
 psybuzz
on 1 Nov 2019
psybuzz
on 1 Nov 2019
It would be nice if TensorBoard told me that Chrome is needed to view the profile. I've been monkeying around for half an hour to find out why the profiling doesn't work.
By the way, it doesn't work in Chromium, either:

Version: 80.0.3968.0
 rmoehn
on 26 Nov 2019
rmoehn
on 26 Nov 2019
Seconded - at first I thought something was wrong with how I was calling the tracer in tensorflow2, and only when I came across this issue did I realize it's simply a display issue. It would be great if you could at least add a snippet of javascript that checks browser type/version and says "it's incompatible - you need
 st--
on 20 Jan 2020
st--
on 20 Jan 2020
(Duplicate of #1291? this one has much better description though)
st--
on 20 Jan 2020
Is there a solution for this yet? I have the exact same problem, using tensorflow 2.0.1 and opening TensorBoard in Chrome.
The other tabs show information fine, but the profile tab stays empty.
 astridtijskens
on 17 Feb 2020
astridtijskens
on 17 Feb 2020
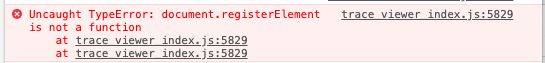
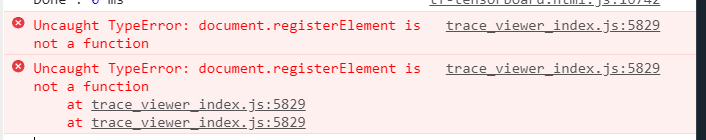
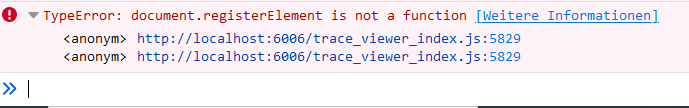
I'm seeing this issue in Chrome 80 for macOS as well. Specifically, I'm seeing the following in the console:
Jk this is tracked in #3209
 TylerADavis
on 5 Mar 2020
TylerADavis
on 5 Mar 2020
Same on Win10, Chrome Version 80.0.3987.132 (64-Bit) with Tensorboard 2.1.0
And Firefox 74.0 (64bit)
 Stefan1232
on 15 Mar 2020
Stefan1232
on 15 Mar 2020
Adding that this happens on Linux as well -- Chrome 80.0.3987.149 (Official Build) (64-bit), Tensorboard 2.1.0.
 ecrows
on 24 Mar 2020
ecrows
on 24 Mar 2020
same here with Tensorflow 2.0.0 and chrome 81.0.4044.122 on mac 10.14.6 (18G103)
 jimmieliu
on 29 Apr 2020
jimmieliu
on 29 Apr 2020
As of latest TensorBoard and https://www.tensorflow.org/tensorboard/tensorboard_profiling_keras, the profile plugin should work on Firefox, Chrome, and others. Please give the new plugin a try. Thanks!
 stephanwlee
on 11 May 2020
stephanwlee
on 11 May 2020
@RaphaelMeudec Can you link to your diagnose_tensorboard.py script?
 robertlugg
on 18 May 2020
robertlugg
on 18 May 2020
@robertlugg Not sure what you refer to, but the code that I used when I encountered the error is in the first post of this issue.
RaphaelMeudec
on 18 May 2020
Related issues
 vipulroxx
·
3Comments
vipulroxx
·
3Comments
 yaroslavvb
·
4Comments
yaroslavvb
·
4Comments
 iron9light
·
4Comments
iron9light
·
4Comments
 datlife
·
4Comments
datlife
·
4Comments
 ismael-elatifi
·
3Comments
ismael-elatifi
·
3Comments
Most helpful comment
It would be nice if TensorBoard told me that Chrome is needed to view the profile. I've been monkeying around for half an hour to find out why the profiling doesn't work.
By the way, it doesn't work in Chromium, either:
Version: 80.0.3968.0