Tensorboard: Performance data broken in 1.3.0rc0/1
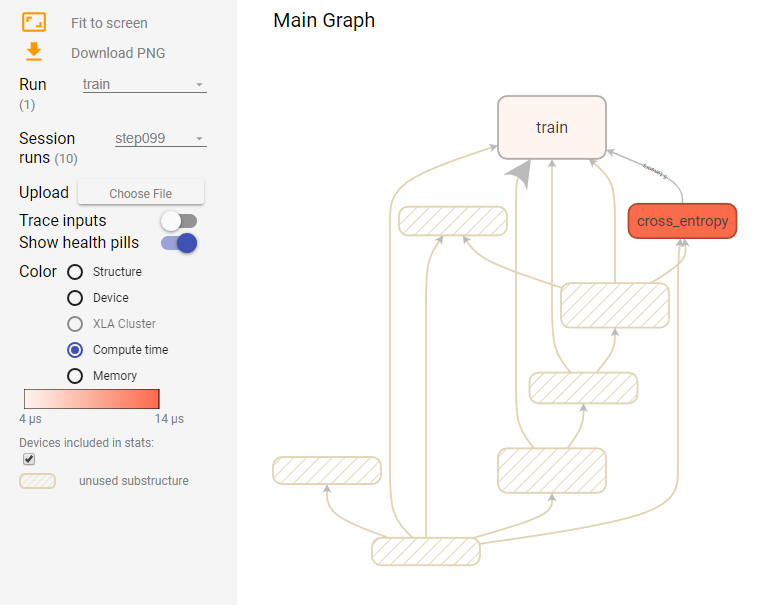
I noticed that performance metrics such as compute time and memory usage are broken in TF 1.3.0 rc0 and rc1. When running the official MNIST example with summaries, tensorboard shows many unused nodes. Especially the 'devices' section on the left appears to contain no devices at all.

Here are the tensorflow logs
python .\mnist.py --log_dir logs --data_dir data --fake_data True
2017-07-30 08:30:58.271485: W C:\tf_jenkins\home\workspace\rel-win\M\windows-gpu\PY\35\tensorflow\core\platform\cpu_feature_guard.cc:45] The TensorFlow library wasn't compiled to use AVX instructions, but these are available on your machine and could speed up CPU computations.
2017-07-30 08:30:58.271549: W C:\tf_jenkins\home\workspace\rel-win\M\windows-gpu\PY\35\tensorflow\core\platform\cpu_feature_guard.cc:45] The TensorFlow library wasn't compiled to use AVX2 instructions, but these are available on your machine and could speed up CPU computations.
2017-07-30 08:30:58.907658: I C:\tf_jenkins\home\workspace\rel-win\M\windows-gpu\PY\35\tensorflow\core\common_runtime\gpu\gpu_device.cc:955] Found device 0 with properties:
name: GeForce GTX 1070
major: 6 minor: 1 memoryClockRate (GHz) 1.683
pciBusID 0000:01:00.0
Total memory: 8.00GiB
Free memory: 6.68GiB
2017-07-30 08:30:58.907767: I C:\tf_jenkins\home\workspace\rel-win\M\windows-gpu\PY\35\tensorflow\core\common_runtime\gpu\gpu_device.cc:976] DMA: 0
2017-07-30 08:30:58.908268: I C:\tf_jenkins\home\workspace\rel-win\M\windows-gpu\PY\35\tensorflow\core\common_runtime\gpu\gpu_device.cc:986] 0:   Y
2017-07-30 08:30:58.908320: I C:\tf_jenkins\home\workspace\rel-win\M\windows-gpu\PY\35\tensorflow\core\common_runtime\gpu\gpu_device.cc:1045] Creating TensorFlow device (/gpu:0) -> (device: 0, name: GeForce GTX 1070, pci bus id: 0000:01:00.0)
Accuracy at step 0: 0.0
Accuracy at step 10: 1.0
Accuracy at step 20: 1.0
Accuracy at step 30: 1.0
Accuracy at step 40: 1.0
Accuracy at step 50: 1.0
Accuracy at step 60: 1.0
Accuracy at step 70: 1.0
Accuracy at step 80: 1.0
Accuracy at step 90: 1.0
2017-07-30 08:31:46.475993: I C:\tf_jenkins\home\workspace\rel-win\M\windows-gpu\PY\35\tensorflow\stream_executor\dso_loader.cc:139] successfully opened CUDA library cupti64_80.dll locally
Adding run metadata for 99
System Setup
Tensorflow 1.3.0 rc0 / rc1 with GPU support
GeForce GTX 1070
Windows 10 x64
Python 3.6 / 3.5
Chrome 59.0.3071.115
 cheind
All 13 comments
For what it's worth, I've had no trouble with performance data using the code in this commit, which is in turn adapted from mnist_with_summaries.py.
The UI element that reads, "Devices included in stats" is not a list of devices but a checkbox. If you set the "Color" radio button mode to "Device" then the legend should change to show the devices (though mine just has "unknown device," which has been the behavior since at least TFr1.1).
 wchargin
on 2 Aug 2017
wchargin
on 2 Aug 2017
@wchargin when I'm trying to run the example you mention I get
Traceback (most recent call last):
  File "demo.py", line 29, in <module>
    from tensorboard.plugins.image import summary as image_summary
ModuleNotFoundError: No module named 'tensorboard.plugins.image'
Looking in the package directory of tensorflow-tensorboard (v 0.1.2) reveals that there is no plugins.image directory, but a plugins.images directory. The only module in that directory, besides __init__.py is images_plugin.py. Am I missing something?
cheind
on 3 Aug 2017
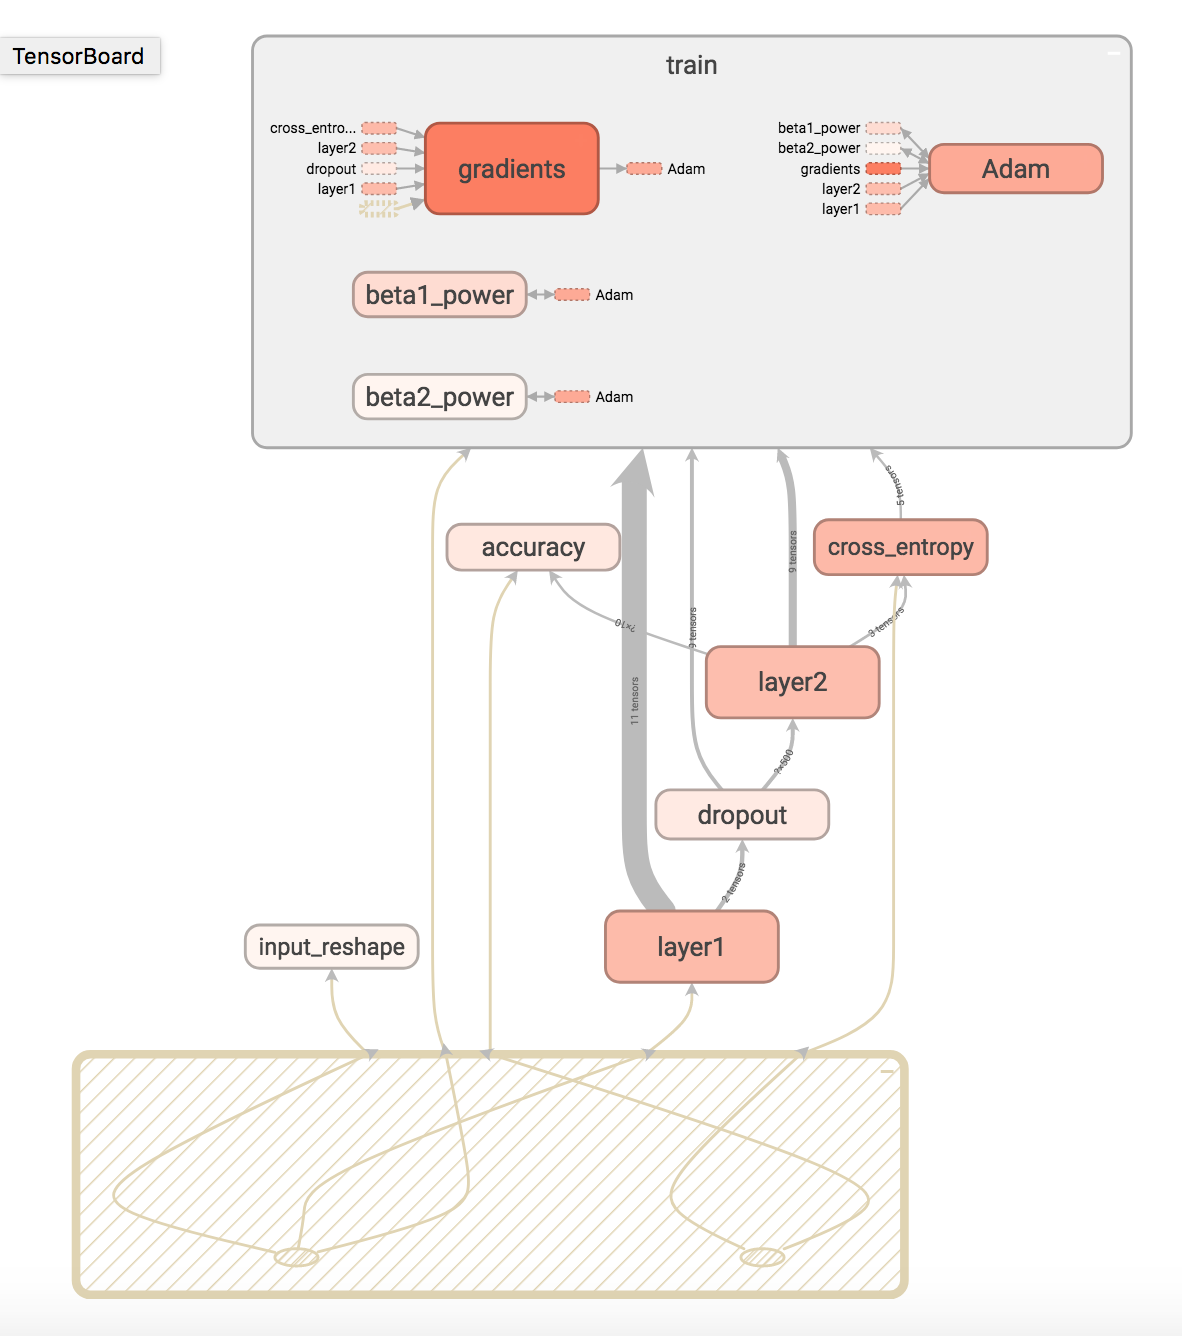
@wchargin ok I managed to get it run by just using tf.summary.image instead. Here's how my output looks

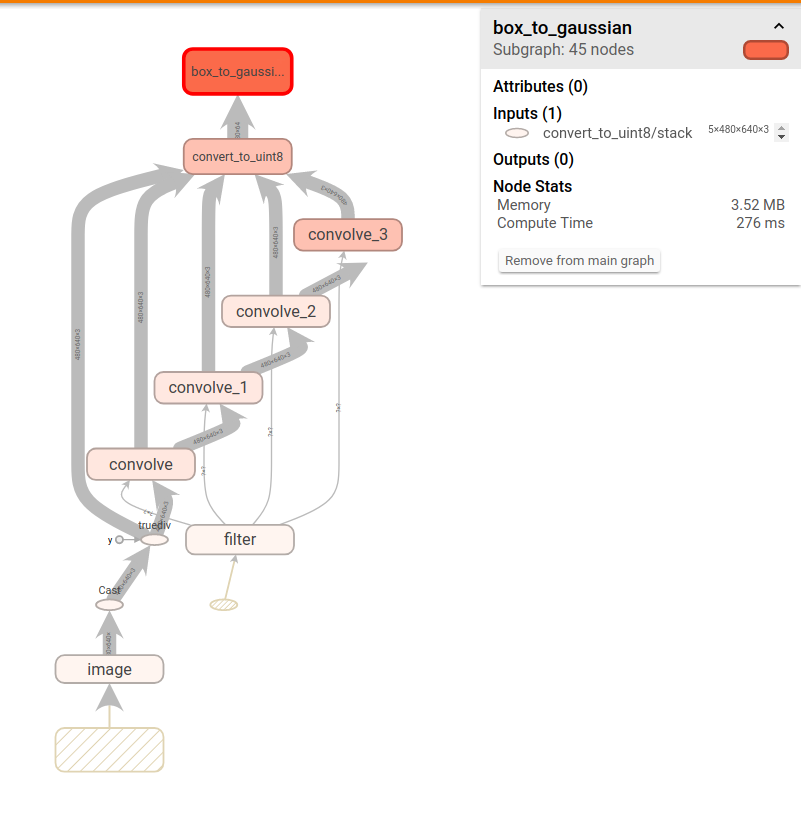
Although timing info seems to be there for name_scopes, it shows many more unused nodes for which no information is present. For example unfolding convolve_1 gives

cheind
on 3 Aug 2017
I get the same results that you do, and indeed some of those seem like they should have data. Note that the top one is an assert_type, which is actually a noop because the assertion happens at graph construction time. But others, like the Conv2D, probably should be listed; I'm not sure why they're not. @chihuahua knows the most about the graph visualizer, so I'll let him handle this.
wchargin
on 3 Aug 2017
Something that might be happening: the substructures that are marked as unused might have been removed or changed by TensorFlow's graph optimizer. If this is the case, then the coloring and lack of information would make sense. I have no idea whether this is in fact the case.
wchargin
on 3 Aug 2017
I installed TF nightly for Mac python 2.7 (tensorflow-1.3.0rc1-cp27-none-linux_x86_64.whl from http://ci.tensorflow.org/view/Nightly/job/nightly-matrix-cpu/TF_BUILD_IS_OPT=OPT,TF_BUILD_IS_PIP=PIP,TF_BUILD_PYTHON_VERSION=PYTHON2,label=cpu-slave/
and I see the performance data.

Maybe this is an issue that got fixed recently?
 chihuahua
on 5 Aug 2017
chihuahua
on 5 Aug 2017
This would be of course the best case. Any chance to ask a TF developer on this, I didn't want to cross-post the issue there.
cheind
on 5 Aug 2017
Today, I tried with tensorflow 1.3.0rc2 on MNIST with summaries examples without luck:
Device section also looks weird.
Graph looks ok when viewing its structure

Log says
W C:\tf_jenkins\home\workspace\rel-win\M\windows-gpu\PY\35\tensorflow\core\platform\cpu_feature_guard.cc:45] The TensorFlow library wasn't compiled to use AVX instructions, but these are available on your machine and could speed up CPU computations.
2017-08-07 18:45:02.842228: W C:\tf_jenkins\home\workspace\rel-win\M\windows-gpu\PY\35\tensorflow\core\platform\cpu_feature_guard.cc:45] The TensorFlow library wasn't compiled to use AVX2 instructions, but these are available on your machine and could speed up CPU computations.
2017-08-07 18:45:03.131301: I C:\tf_jenkins\home\workspace\rel-win\M\windows-gpu\PY\35\tensorflow\core\common_runtime\gpu\gpu_device.cc:955] Found device 0 with properties:
name: GeForce GTX 1070
major: 6 minor: 1 memoryClockRate (GHz) 1.683
pciBusID 0000:01:00.0
Total memory: 8.00GiB
Free memory: 6.68GiB
2017-08-07 18:45:03.131437: I C:\tf_jenkins\home\workspace\rel-win\M\windows-gpu\PY\35\tensorflow\core\common_runtime\gpu\gpu_device.cc:976] DMA: 0
2017-08-07 18:45:03.132609: I C:\tf_jenkins\home\workspace\rel-win\M\windows-gpu\PY\35\tensorflow\core\common_runtime\gpu\gpu_device.cc:986] 0:   Y
2017-08-07 18:45:03.133077: I C:\tf_jenkins\home\workspace\rel-win\M\windows-gpu\PY\35\tensorflow\core\common_runtime\gpu\gpu_device.cc:1045] Creating TensorFlow device (/gpu:0) -> (device: 0, name: GeForce GTX 1070, pci bus id: 0000:01:00.0)
Seems still broken in now released v1.3 - I'm having the same issues (with mnist_with_summaries.py).
I also provided a minimal example on Stackoverflow and now found this issue here...
However, I also had similar problems already on v1.2.1 with my own graphs. Many Items would have stats, but some sub items inside Ops grouped with name scopes would be shown as unused-substructures without stats, yielding in false results for the sum of the whole group...
 hofingermarkus
on 18 Aug 2017
hofingermarkus
on 18 Aug 2017
I met the same problem in my own project when I want to check the runtime,I also tried the tutorial code and find that, if I choose to use the CPU to finish all the tasks, all the runtime statics show just correctly, but when I didn't choose to use cpu on purpose, I got the same result and.Also, device cannot be chosen in Tensorboard. So I wonder if there are some bugs related to the gpu ?I use GTX1060 with 6GB memory
 saharaheart
on 30 Sep 2017
saharaheart
on 30 Sep 2017
I am having the same problem on v1.3.0, Ubuntu, on CPU.
 lengstrom
on 11 Oct 2017
lengstrom
on 11 Oct 2017
I fixed this problem when update tensorflow to tensorflow 1.4.0
 persistforever
on 3 Nov 2017
persistforever
on 3 Nov 2017
Updating to 1.4.0 also fixed it for me, no other changes necessary
 Faur
on 4 Jan 2018
Faur
on 4 Jan 2018
Related issues
 KylePiira
·
4Comments
wchargin
·
3Comments
KylePiira
·
4Comments
wchargin
·
3Comments
 datlife
·
4Comments
datlife
·
4Comments
 wengqi123
·
3Comments
wengqi123
·
3Comments
 yegortokmakov
·
3Comments
yegortokmakov
·
3Comments
Most helpful comment
Seems still broken in now released v1.3 - I'm having the same issues (with mnist_with_summaries.py).
I also provided a minimal example on Stackoverflow and now found this issue here...
https://stackoverflow.com/questions/45739917/tensorboard-profiling-compute-time-everything-is-a-unused-substructure-in
However, I also had similar problems already on v1.2.1 with my own graphs. Many Items would have stats, but some sub items inside Ops grouped with name scopes would be shown as unused-substructures without stats, yielding in false results for the sum of the whole group...