Tendermint: Tendermint shows time dependent performance degredation
BUG REPORT
Tendermint version: 0.20.0-27bd1dea
Environment:
- OS: Ubuntu 18.04 LTS (Bionic Beaver)
- Processor: Intel(R) Xeon(R) CPU E5-2650 v3 @ 2.30GHz (10 cores)
- Memory: 15GB
What happened:
The tm-bench tool shows a performance degradation over time. Initially, I can get performance on the order of 2000tx/s, but this drops off rapidly as the test duration increases. After 1000s, I see transaction rates of only ~200tx/s, and this continues to fall as the test duration increases.
What you expected to happen:
Tendermint transaction rates should be consistent, regardless of test duration.
How to reproduce it:
A detailed report of the study can be found here
This report contains scripts to reproduce the problem, as well as the config.toml from the test runs.
Anything else do we need to know:
I'll be out of the office and unable to check emails for the next week, but I'll be happy to communicate with your team about this issue when I'm back on 9.7.18
 z-bowen
All 21 comments
We've recently created patches to tm-bench to fix this. There was an issue with the tm-bench code. (Basically stats were only being collected from the last 20 blocks, not over all blocks in that duration) Thanks for making the report, its awesome!
The graphs you made look roughly like a 1/x curve which is what we'd expect since tm-bench was only reading the last 20 blocks, but dividing by the entire time.
 ValarDragon
on 29 Jun 2018
ValarDragon
on 29 Jun 2018
Any pauses needed to maintain throughput on the Tendermint end should be invisible to the user, as the memory buffer stays available at all times.
given you are limiting the number of requests per IP, right? Otherwise, any DDOS attack will lead to OOM (out of memory) errors.
 melekes
on 2 Jul 2018
melekes
on 2 Jul 2018
I run the scripts on my dev. machine and can confirm there is a decline in performance.
Tendermint: https://github.com/tendermint/tendermint/tree/release/v0.22.0
tm-bench: https://github.com/tendermint/tools/commit/db419a308e6618eb52d0df6193fbbce482417311
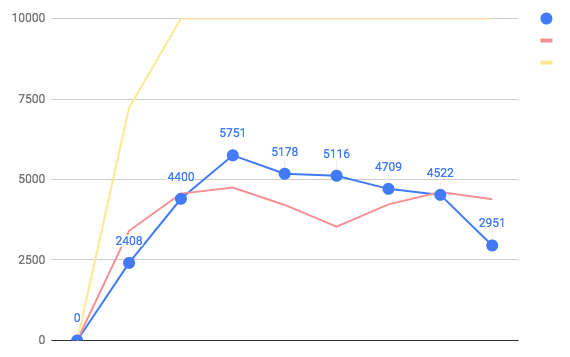
red - std.dev
yellow - max
last point - avg. txs 500 sec.
melekes
on 2 Jul 2018
Not immediately apparent of why this is happening.
melekes
on 2 Jul 2018
Mempool is growing over time:
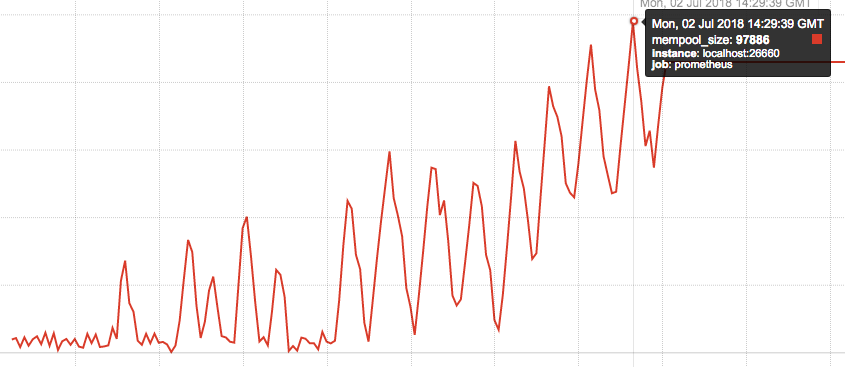
Block size is unstable at first few min, but later tends to be at max - 10000 txs

melekes
on 2 Jul 2018
With mempool.recheck turned off and limited mempool (10000)
sed -i'' -e 's/^recheck = true/recheck = false/' ./mktemp/config/config.toml
sed -i'' -e "s/^size = 100000/size = $6/" ./mktemp/config/config.toml
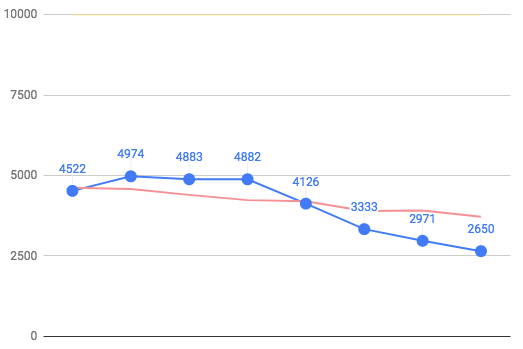
last point - 1000 sec.
There is a decline, although not so steep.
melekes
on 2 Jul 2018
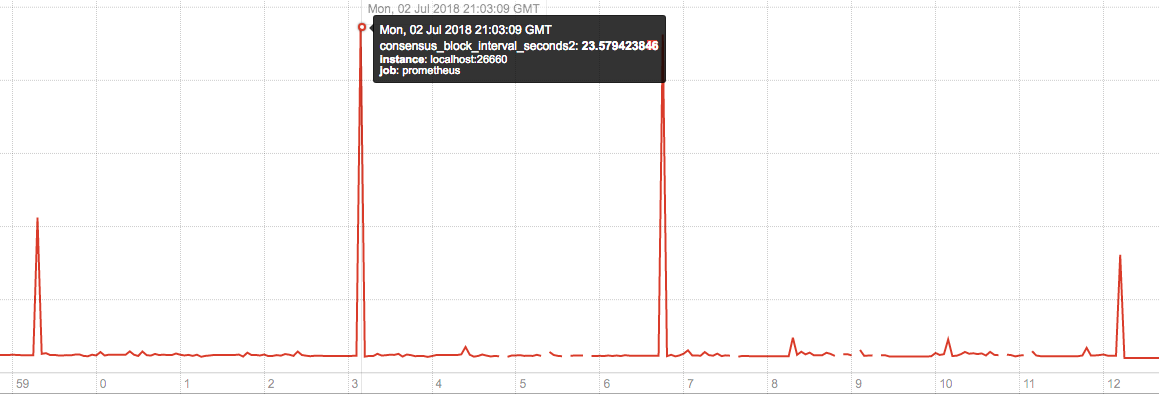
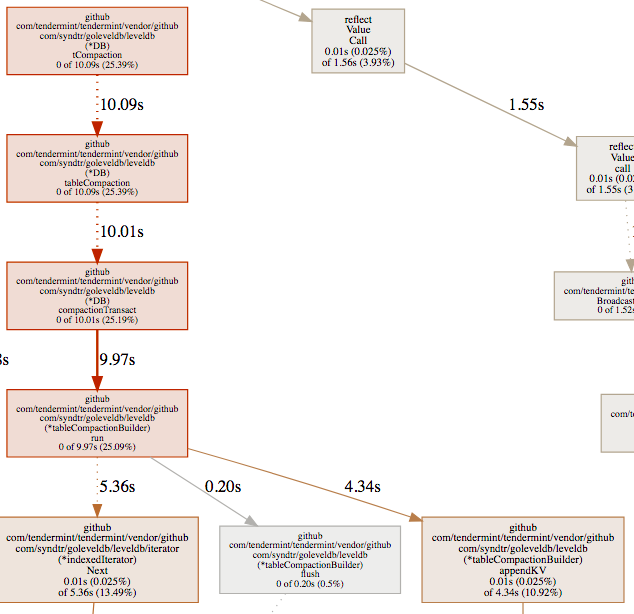
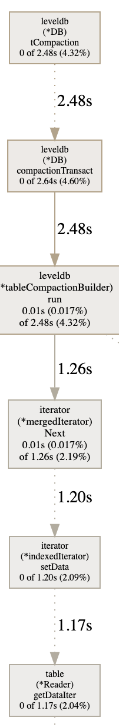
It looks like indexing blocks can take a surprising amount of time (up to 23 sec.) and pauses become longer over time.
I[07-03|09:05:15.561] Indexed block module=txindex height=165 took=18.037554829s leveldb=17.911976289s
melekes
on 3 Jul 2018
Short summary:
1) There was an issue with tm-bench, which is now fixed https://github.com/tendermint/tendermint/issues/1835#issuecomment-401402231
2) given default mempool size - 100000, rechecking that many transactions (eventually mempool gets full) slows us down
3) sometimes indexing a block can take up to 20 sec. and the duration seems to increase over time (given constant load) https://github.com/syndtr/goleveldb/issues/226.
melekes
on 3 Jul 2018
Given the lack of response in the goleveldb issue, is the resolution for that just to switch to cleveldb?
I'm on board with reducing mempool size, until we get sorting by fees its current size is one of the biggest security risks remaining. (see math in #2127)
ValarDragon
on 25 Aug 2018
Given the lack of response in the goleveldb issue, is the resolution for that just to switch to cleveldb?
we may also try to fix it ourselves or switch to another Golang DB
melekes
on 26 Aug 2018
Performed the same set of tests with CLevelDB https://github.com/tendermint/tendermint/pull/2337: no performance degradation.
melekes
on 12 Sep 2018
OK, made outliers appear less often with goleveldb by increasing DB limits: https://github.com/tendermint/tendermint/pull/2370/files#diff-dce1ae536a4b73f300ab57af2affaab5R27
But it's not viable long-term solution.
melekes
on 12 Sep 2018
Interesting. Would be cool to see benchmarks with bolt and badger as well.
Go-ethereum is using syndtr/goleveldb, so it's relatively trusted, and we should discuss the options changes you linked above.
We probably won't want to use bolt: https://news.ycombinator.com/item?id=14336617. Mainly it's a lot slower because it provides higher guarantees that we don't need because we provide them at the consensus layer.
Badger looks really promising but it's also still young (1.0 was November 2017). I'd be interested in running nodes with it to try it out, but we probably need to prioritize a solid CLevelDB build story.
 ebuchman
on 13 Sep 2018
ebuchman
on 13 Sep 2018
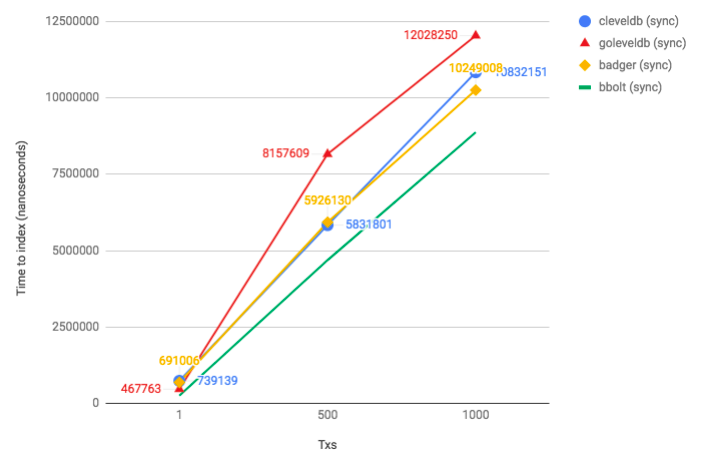
Indexing a block with {N} Txs 250 bytes each
goleveldb - https://github.com/syndtr/goleveldb/commit/c4c61651e9e37fa117f53c5a906d3b63090d8445
cleveldb -https://github.com/DataDog/leveldb/commit/12a0b6e10a5bf779330ed8b7c0f1f39f212d34e2
badger - 1.5.3 https://github.com/dgraph-io/badger
bbolt - v1.3.0 https://github.com/etcd-io/bbolt
code for badger and bbolt - https://gist.github.com/melekes/85b8c07dd917828dc2ac6696129b73f2
state/txindex/kv$ go test -bench=. -benchmem
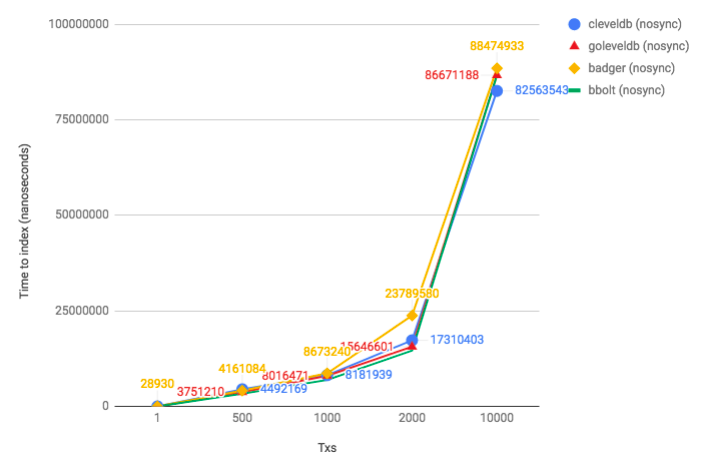
# goleveldb (default settings; nosync)
BenchmarkTxIndex1-2               200000             10247 ns/op            1811 B/op        21 allocs/op
BenchmarkTxIndex500-2                300           3751210 ns/op         1020700 B/op      8106 allocs/op
BenchmarkTxIndex1000-2               200           8016471 ns/op         2013772 B/op     16213 allocs/op
BenchmarkTxIndex2000-2               100          15646601 ns/op         4074734 B/op     32408 allocs/op
BenchmarkTxIndex10000-2               20          86671188 ns/op        23420196 B/op    162329 allocs/op

# goleveldb (sync writes = true)
BenchmarkTxIndex1-2                 3000            467763 ns/op            1918 B/op        21 allocs/op
BenchmarkTxIndex500-2                200           8157609 ns/op         1047671 B/op      8087 allocs/op
BenchmarkTxIndex1000-2               100          12028250 ns/op         2093492 B/op     16154 allocs/op
BenchmarkTxIndex2000-2                50          25454058 ns/op         4229632 B/op     32284 allocs/op
BenchmarkTxIndex10000-2               10         108365240 ns/op        24169504 B/op    162224 allocs/op

# cleveldb (default settings; no sync)
BenchmarkTxIndex1-2               200000             11200 ns/op            1216 B/op        18 allocs/op
BenchmarkTxIndex500-2                300           4492169 ns/op          600188 B/op      8002 allocs/op
BenchmarkTxIndex1000-2               200           8181939 ns/op         1200278 B/op     16002 allocs/op
BenchmarkTxIndex2000-2               100          17310403 ns/op         2400537 B/op     32002 allocs/op
BenchmarkTxIndex10000-2               20          82563543 ns/op        12002612 B/op    160005 allocs/op

# cleveldb (sync writes = true)
BenchmarkTxIndex1-2                 2000            739139 ns/op            1241 B/op        18 allocs/op
BenchmarkTxIndex500-2                200           5831801 ns/op          600273 B/op      8002 allocs/op
BenchmarkTxIndex1000-2               100          10832151 ns/op         1200533 B/op     16002 allocs/op
BenchmarkTxIndex2000-2               100          20475515 ns/op         2400536 B/op     32002 allocs/op
BenchmarkTxIndex10000-2               20          94279046 ns/op        12002617 B/op    160005 allocs/op

# badger (default settings; no sync - `SyncWrites = false`)
BenchmarkTxIndex1-2                50000             28930 ns/op            2776 B/op        72 allocs/op
BenchmarkTxIndex500-2                500           4161084 ns/op          803793 B/op     15079 allocs/op
BenchmarkTxIndex1000-2               200           8673240 ns/op         1695002 B/op     30165 allocs/op
BenchmarkTxIndex2000-2               100          23789580 ns/op         3448048 B/op     60238 allocs/op
BenchmarkTxIndex10000-2               20          88474933 ns/op        17476653 B/op    300630 allocs/op

# badger (sync writes = true)
BenchmarkTxIndex1-2                 3000            691006 ns/op            2782 B/op        71 allocs/op
BenchmarkTxIndex500-2                200           5926130 ns/op          805023 B/op     15077 allocs/op
BenchmarkTxIndex1000-2               100          10249008 ns/op         1698675 B/op     30161 allocs/op
BenchmarkTxIndex2000-2               100          20576168 ns/op         3447974 B/op     60238 allocs/op
BenchmarkTxIndex10000-2               20         101992062 ns/op        17474236 B/op    300617 allocs/op

# bbolt (NoSync = true)
BenchmarkTxIndex1-2               100000             18514 ns/op            7798 B/op        57 allocs/op
BenchmarkTxIndex500-2                500           3333937 ns/op          809285 B/op     10454 allocs/op
BenchmarkTxIndex1000-2               200           6932448 ns/op         1824207 B/op     21973 allocs/op
BenchmarkTxIndex2000-2               100          14620038 ns/op         4084135 B/op     44367 allocs/op
BenchmarkTxIndex10000-2               20          86685214 ns/op        25702784 B/op    237371 allocs/op

# bbolt (default settings; NoSync = false)
BenchmarkTxIndex1-2                 5000            260364 ns/op            7801 B/op        57 allocs/op
BenchmarkTxIndex500-2                300           4685496 ns/op          808789 B/op     10466 allocs/op
BenchmarkTxIndex1000-2               200           8870041 ns/op         1820557 B/op     21971 allocs/op
BenchmarkTxIndex2000-2                50          21821480 ns/op         4219036 B/op     44908 allocs/op
BenchmarkTxIndex10000-2               10         111969185 ns/op        29244730 B/op    254814 allocs/op
Note that when SyncWrites = false, that doesn't mean data is in memory. It just means we've left it to the filesystem to decide when to flush to disk.
sync writes (fsync after each commit; used in state and blockstore)
nosync writes (currently used when indexing a block)
Summary
- cleveldb is slower than goleveldb for single writes (_because every time you have to cross the cgo boundary?_)
- bbolt is the fastest (up to ~5000-10000 random writes where it becomes slower than other 3 DBs https://github.com/etcd-io/bbolt#leveldb-rocksdb)
- badger and bbolt does not have API to flush individual writes (
SetSync). Only global SyncWrites setting.
Conclusion
I think we should consider switching to bbolt as a primary database (it's faster for our use-case + it provides better guarantees). I don't think we need an LSM-based database if we don't have > 10000writes per second (https://github.com/etcd-io/bbolt#leveldb-rocksdb). I suspect we're currently doing < 100 writes per second (evidence, blockstore) + 1 large write (block indexing) per second.
This will also improve read performance (especially range scans).
On the other hand, bbolt has a slightly different API (https://github.com/etcd-io/bbolt#using-buckets) where it's your job to split KV pairs between buckets. Note in the above tests I used a single bucket.
melekes
on 13 Sep 2018
TODO:
- [ ] Check with indexing turned off that we don't have perf. degredation
- [ ] See if the old versions of goleveldb have the same behavior (regression issue)
- [ ] Check if etcd-io/bbolt has the same issue
- [ ] How big a B+tree can be in bbolt (probably memory limited). that's why indexing should be offloaded to something like Postgresql which can dump pars of trees on disk?
- [ ] How bloom-filter in LevelDB improves read efficiency?
melekes
on 17 Sep 2018
Referencing https://github.com/cosmos/cosmos-sdk/issues/2131 to ensure that, in addition to looking at the performance characteristics of the underlying DB, consideration is given to how data is stored as well.
Specifically, the key used to reference each node in the DB should be immutable over the lifetime of the node (a unique integer value could fit nicely). This to avoid page fills and thus reorgs/compactions.
Sorry if this is obvious, just seemed natural to bring it up in the context of this issue.
 mdyring
on 3 Oct 2018
mdyring
on 3 Oct 2018
This is some 🔥 work here @melekes
 jackzampolin
on 22 Jun 2019
jackzampolin
on 22 Jun 2019
bbolt is reported to be slower when fast-syncing.
melekes
on 22 Jun 2019
closed https://github.com/syndtr/goleveldb/issues/226. I'm no longer seeing pauses due to compaction or rather pauses are manageble - 2-3s (for a block with 5000 txs 250 bytes each).
melekes
on 27 Aug 2020
melekes
on 27 Aug 2020
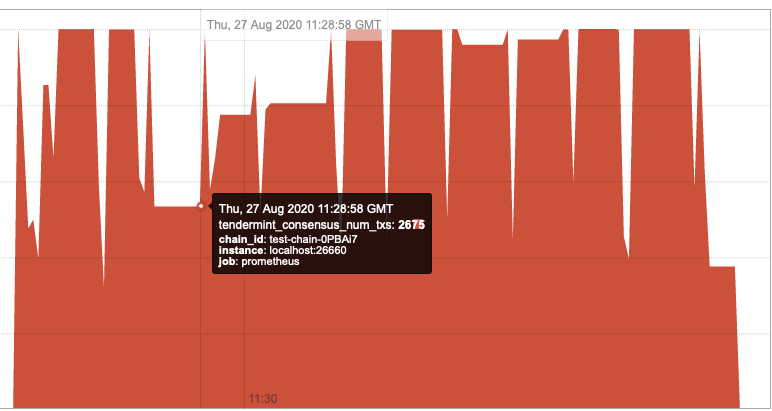
latest master (5c62ab1) with default settings
I'm no longer observing time dependent performance degradation. However, long pauses are still present (for possible reasons and, hopefully, a fix refer to https://github.com/tendermint/tendermint/issues/3905).
If anyone is still experiencing this, please let us know!
melekes
on 27 Aug 2020
Related issues
 yuomii
·
24Comments
yuomii
·
24Comments
 zramsay
·
24Comments
ebuchman
·
25Comments
melekes
·
23Comments
zramsay
·
24Comments
ebuchman
·
25Comments
melekes
·
23Comments
 mattkanwisher
·
24Comments
mattkanwisher
·
24Comments
Most helpful comment
Indexing a block with {N} Txs 250 bytes each
goleveldb - https://github.com/syndtr/goleveldb/commit/c4c61651e9e37fa117f53c5a906d3b63090d8445
cleveldb -https://github.com/DataDog/leveldb/commit/12a0b6e10a5bf779330ed8b7c0f1f39f212d34e2
badger - 1.5.3 https://github.com/dgraph-io/badger
bbolt - v1.3.0 https://github.com/etcd-io/bbolt
code for badger and bbolt - https://gist.github.com/melekes/85b8c07dd917828dc2ac6696129b73f2
state/txindex/kv$ go test -bench=. -benchmemNote that when SyncWrites = false, that doesn't mean data is in memory. It just means we've left it to the filesystem to decide when to flush to disk.
sync writes (fsync after each commit; used in state and blockstore)
nosync writes (currently used when indexing a block)
Summary
SetSync). Only global SyncWrites setting.Conclusion
I think we should consider switching to bbolt as a primary database (it's faster for our use-case + it provides better guarantees). I don't think we need an LSM-based database if we don't have > 10000writes per second (https://github.com/etcd-io/bbolt#leveldb-rocksdb). I suspect we're currently doing < 100 writes per second (evidence, blockstore) + 1 large write (block indexing) per second.
This will also improve read performance (especially range scans).
On the other hand, bbolt has a slightly different API (https://github.com/etcd-io/bbolt#using-buckets) where it's your job to split KV pairs between buckets. Note in the above tests I used a single bucket.