Super-productivity: Memory consumption too high
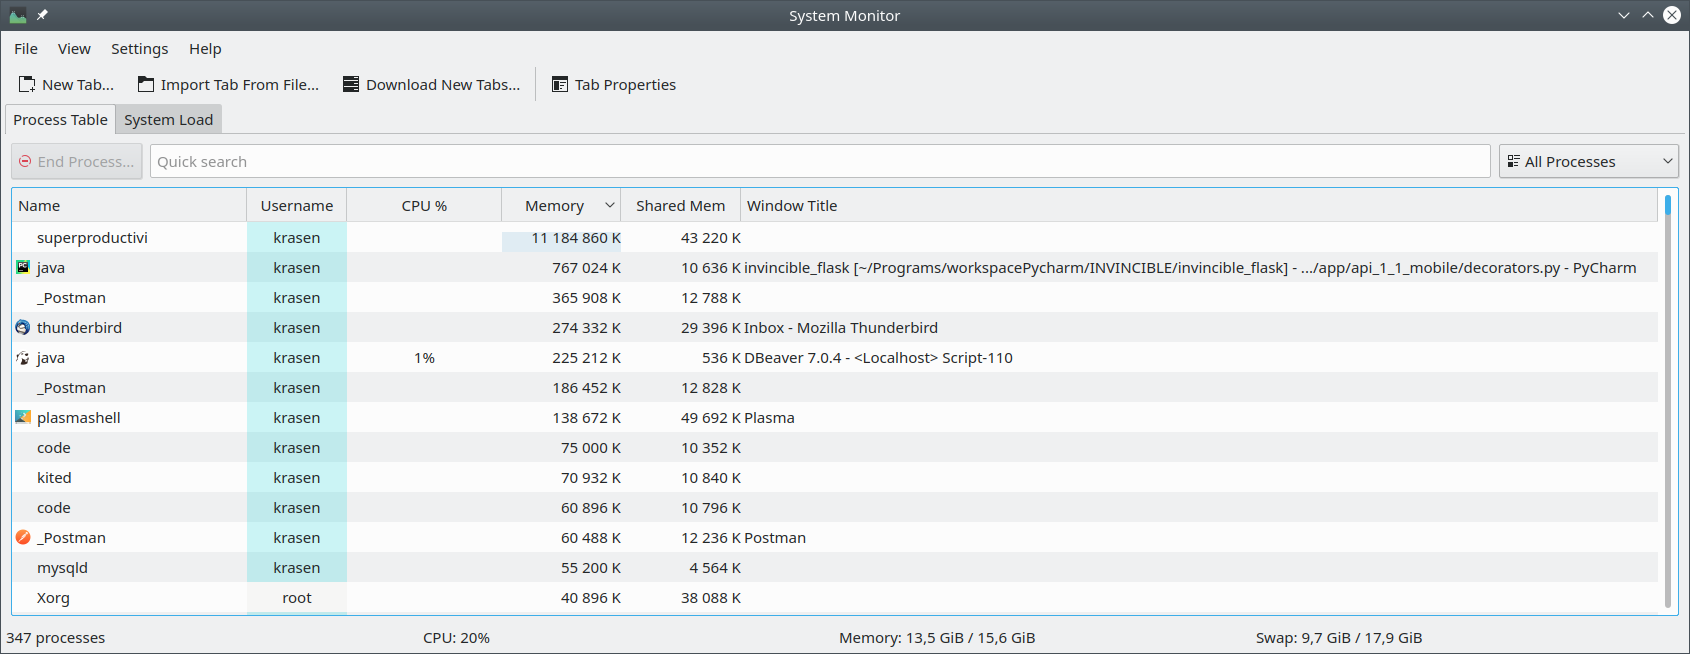
Memory consumption was too high this morning when I started my computer after hibernate. I opened the monitor tool and watched how with every second the superProductivity app increased its memory usage. I stoped it on about 11G of RAM.
version: 5.4.1
 makkasi
All 11 comments
Thanks for opening this up. This is absurdly high.
Did the memory usage stay at this level afterward or did it drop to a more normal level again?
 johannesjo
on 10 Aug 2020
johannesjo
on 10 Aug 2020
I stopped it since I was watching it growing from 10 500 till 11 000. It was not dropping.
makkasi
on 10 Aug 2020
I tried to reproduce this, but I am unable to do so. There doesn't seem to be any obvious memory leak. Maybe it's an electron issue of some sort. I assume that there is not much I can do at the moment, but please let me know if the issue reappears!
johannesjo
on 10 Aug 2020
Yes of course. There is not much info in order to do anything on your side. If I see this again will try to make some memory snapshot. I don't know tool for this though. Thank you.
makkasi
on 10 Aug 2020
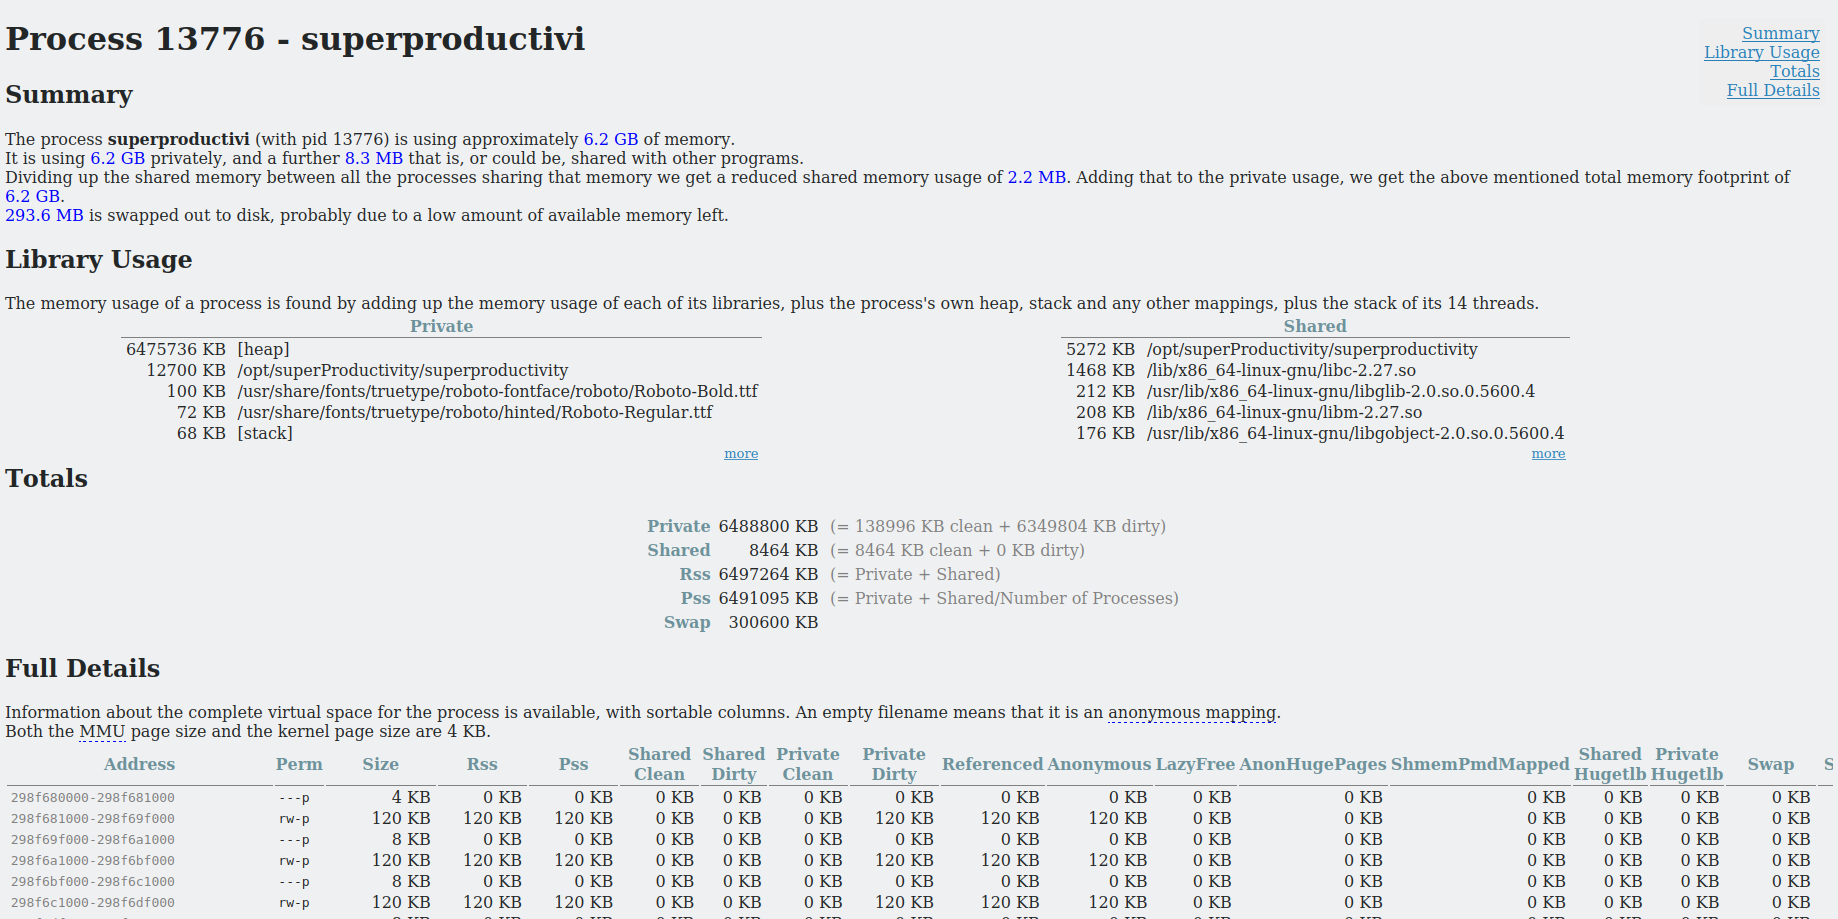
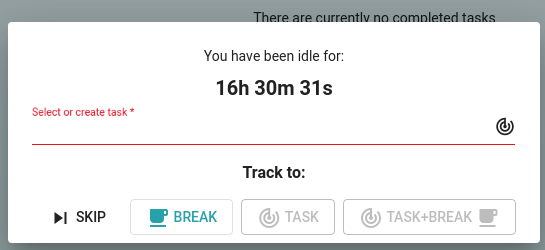
Hi again. I saw first high memory consumption (6g). Then I took snapshot of the memory. Then I opened the app and saw the clock frozen :). Then I minimized the app and opened it again and saw the clock updated (66 hours) and the memory consumption was back to normal.
makkasi
on 13 Aug 2020
Sorry , I did not want to close it. Reopening.
makkasi
on 13 Aug 2020
Strange. It is not reopening from firefox, but it is reopening from chrome :)
makkasi
on 13 Aug 2020
Darn! For a moment I hoped the issue solved itself xD
Thanks for getting back to me! I've a suspicion what might be going on. Might be that the browser (electron) saves and then executes all missed interval handlers from the callstack at once (there is at least one every second when tracking time). Gotta do some research!
johannesjo
on 13 Aug 2020
I found this:
https://stackoverflow.com/a/14840440/1574004
I'll try adjusting every setInterval function this way.
johannesjo
on 14 Aug 2020
A fixed version will be available on the edge channel soon. Thank you very much again for digging into this. I hope that the changes will resolve the issue.
johannesjo
on 17 Aug 2020
@makkasi sorry for bothering you again, but did you encounter this again with the most recent version?
johannesjo
on 22 Sep 2020
Related issues
 wada3n
·
3Comments
wada3n
·
3Comments
 sdruskat
·
3Comments
sdruskat
·
3Comments
 fkohrt
·
3Comments
fkohrt
·
3Comments
 jac1013
·
3Comments
jac1013
·
3Comments
 wimel
·
3Comments
wimel
·
3Comments