Stylus: Injection issue Chromium v80
Cent 4.2.7.116 (Official Build) (64-bit) (portable) (Chromium 80.0.3987.132)
Win 8.1
master
@tophf I would guess this might have something to do with #843 but it might just be some new issue in Chromium 80 in general. I recently updated to Cent beta and started noticing the problem, which I can't repro in v78.
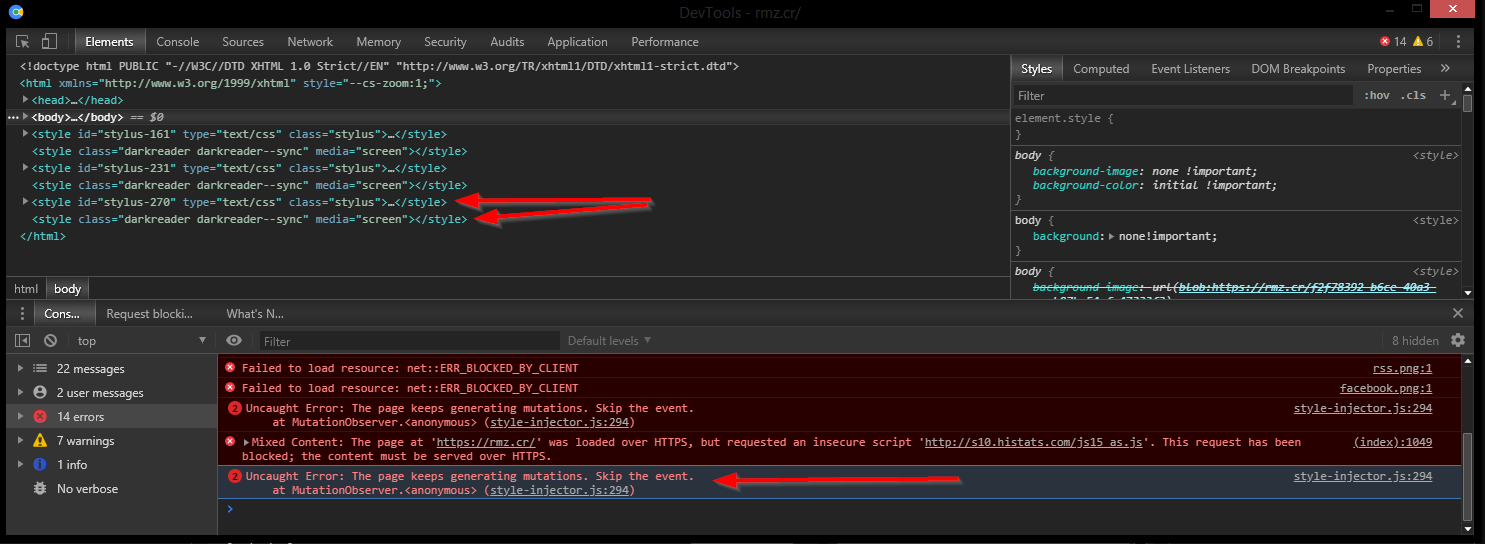
We've got a conflict with DarkReader. When DR is active, we're not winning the race to last place on style injection anymore, and it throws the "The page keeps generating mutations. Skip the event" error.
 narcolepticinsomniac
All 75 comments
Didn't investigate yet but it could be also something in Darkreader.
As for a long-term solution, we can switch to using adoptedStyleSheets in Chrome 73+ so this DOM trickery won't be needed anymore, the styles won't be exposed as elements. In the future we may even use it to style ShadowDOM. The downside is that Chrome doesn't allow to edit rules of such styles (they're displayed in italics) but I'd say it's a negligible price.
 tophf
on 16 Mar 2020
tophf
on 16 Mar 2020
...it could be also something in Darkreader
Yeah, I guess when I double checked my old Cent portable, DR hadn't updated so I couldn't repro. Probably one of these two, huh?
narcolepticinsomniac
on 16 Mar 2020
Yep, looks like those. I think we can just remove the console error and show it via console.debug so it's hidden by default. As for adoptedStyleSheets, there's no universal way to observe changes in it other than periodic checking so this approach would only work until people start using this technology...
tophf
on 16 Mar 2020
DR is spamming errors on some pages without Stylus even enabled:

narcolepticinsomniac
on 16 Mar 2020
I wonder if they'd be open to not screwing with our styles. I get they're in a similar specificity contest, but it shouldn't be with us. Anyone who's using both is likely using Stylus to override DR's shortcomings.
narcolepticinsomniac
on 16 Mar 2020
I'm working on a possible workaround right now.
tophf
on 16 Mar 2020
I opened what I consider to be a pretty serious unrelated issue for DR like a week and a half ago, and there's been no response yet. It might be becoming more trouble than it's worth. It's always been the best of a lot of bad options though.
narcolepticinsomniac
on 16 Mar 2020
Opened a PR. See if it helps.
tophf
on 16 Mar 2020
Nah, man. Nice idea, but they're chasing us around.
narcolepticinsomniac
on 16 Mar 2020
Ah, this looks deliberate and hostile.
tophf
on 16 Mar 2020
What did we ever do to them? =)
narcolepticinsomniac
on 16 Mar 2020
Stylus: *exists*
tophf
on 16 Mar 2020
So there are only two things we can really do: ask them to stop or just live with that and switch to console.debug to hide the error.
tophf
on 16 Mar 2020
Couldn't hurt to ask. I have to think the fact that we inject USERstyles warrants an exemption from this overzealous approach.
narcolepticinsomniac
on 16 Mar 2020
I gotta take off for the day. If you feel like opening an issue, go ahead, otherwise I'll do it later.
narcolepticinsomniac
on 16 Mar 2020
You do it. I'm not even using their extension.
tophf
on 16 Mar 2020
@tophf Could you test something related to that DR issue I mentioned? I ran into a similar bug without DR on this page. I'd like to know if you can repro.
Basically, just inspect that page while hovering/clicking nodes in the DOM tree while observing CPU. It skyrockets for me on both computers tested. On that particular page, I figured out the cause, which appears to be an active animation. It's an infinite spinner animation which is hidden off screen with positioning and opacity instead of display. I can fix the CPU issue entirely by killing animations or hiding that particular element via display in a userstyle.
If this is not some heisenbug which is only affecting me for whatever reason, it'd have to be a browser bug. Something DR does causes the same CPU issue with hovering the DOM tree in devtools on any page it's active. Fixing it on that one page makes me optimistic, but I'd like to know if this is a legit bug for everybody, or if I'm the only lucky one.
narcolepticinsomniac
on 17 Mar 2020
Yeah that page does a lot of JS calc:
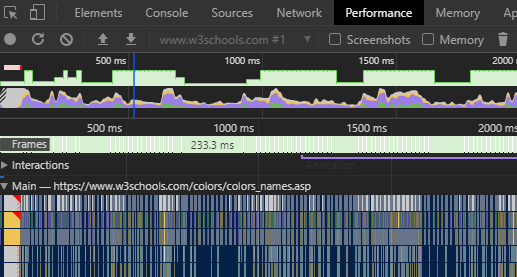
I see the same without opening devtools, ~50% CPU (i7 4GHz) for this tab in Chrome's task manager.
tophf
on 17 Mar 2020
AFAICT, the page itself wastes less than 10% with the stupid animation that's hidden with positioning instead of display. It's when you open devtools and start using them, hovering DOM nodes in particular, there's some bug that causes CPU to skyrocket another 50%.
Seriously, just hide those elements and recheck:
div.goog-te-spinner-pos, div.goog-te-spinner-animation { display: none!important; }
narcolepticinsomniac
on 17 Mar 2020
Uhm, I see now 200% CPU with or without that CSS, even with devtools closed, even while not moving the mouse a bit.
The profiler shows it's because of https://www.googletagservices.com/activeview/js/current/osd_listener.js
Gee, the first time I've tried I probably had uBlock enabled.
tophf
on 17 Mar 2020
I don't think that's a factor in what I'm describing. I don't even see that in the logger. It'd certainly be blocked by uBO or my hosts file anyway.
narcolepticinsomniac
on 17 Mar 2020
I tested in Canary previously.
In Chrome 80 I see what you describe (CPU jumps from 10% to 50%) and adding that CSS helps.
tophf
on 17 Mar 2020
This is very similar to what happens when you inspect any page DR is active on. Not sure what they have in common, but it's gotta be something. Clearly, a pretty egregious browser bug, no?
narcolepticinsomniac
on 17 Mar 2020
Either that or it's something terribly wrong in that goog-te crap.
tophf
on 17 Mar 2020
If you checked a page DR is active on, the CPU behavior is pretty much the same. I gotta think there's something wrong with element highlighting in Chromium devtools.
narcolepticinsomniac
on 17 Mar 2020
Finally got around to opening that issue.
narcolepticinsomniac
on 17 Mar 2020
Now that I'm actively looking for it, that freaking devtools bug is malignant, so I opened an issue.
narcolepticinsomniac
on 18 Mar 2020
Landed in 46.0.2472.0
Holy hell. Thanks for looking into it and providing additional info.
narcolepticinsomniac
on 18 Mar 2020
DR merged the PR to exempt Stylus.
narcolepticinsomniac
on 31 Mar 2020
I gave DR a try, seems nice. Since I don't need it on sites where I have Stylus themes I've disabled DR injection completely via browser policies. I could disable DR everywhere and only allow it on some sites, which is quite simple, but I needed the opposite: allow it everywhere except the few stylusized sites so here's the instruction for Windows (see the policies documentation for other platforms).
DIY
edit the following code and run it in devtools console on any page
copy(String.raw`REGEDIT4 [HKEY_CURRENT_USER\Software\Policies\Google\Chrome] "ExtensionSettings"=` + JSON.stringify(JSON.stringify({ eimadpbcbfnmbkopoojfekhnkhdbieeh: { runtime_blocked_hosts: [ "*://*.google.com", "*://github.com", ] } })))- paste the contents of the clipboard in a plain-text editor (Notepad)
- save it as
"123.reg"(quotes ensure the file type isreg) - double-click this file and confirm merging it in the Windows registry
- go to
chrome://policyURL in the browser and clickReload policiesbutton
There should be an OK status shown, here's an excerpt from my policies:
Important notes:
\Google\Chromein the code above will be\Chromiumfor Chromium and some forks.eimadpbcbfnmbkopoojfekhnkhdbieehis the id of DR extension.- max 100 items can be specified in
runtime_blocked_hostsorruntime_allowed_hostsusing the match pattern syntax but without the path part
tophf
on 4 Apr 2020
@tophf Since Chromium only half-assed the fix for the CPU issue, it's gonna be festering for the foreseeable future. Any chance you can figure out WTH DR does which triggers this bug on every page it injects styles into? I've tried and come up with nada.
narcolepticinsomniac
on 29 Aug 2020
I see the same high CPU consumption even if I disable DR and reload that page.
tophf
on 30 Aug 2020
Yep, it occurs on maybe 20% of pages I come across, without DR, and we know active animations are a trigger. It occurs on 100% of the pages on which DR is active, so it does something to trigger it.
Check this site with and without - or any page where the bug isn't normally triggered, it will be once DR's enabled. I haven't figured out why.
narcolepticinsomniac
on 30 Aug 2020
Still roughly the same with or without DR: browser 20%, GPU 25%, devtools 25%, tab 60%. I'm using Chromium 84. I press Ctrl-Shift-C and move the cursor over the page in fast circles for a few seconds.
tophf
on 30 Aug 2020
I see the following behavior in Cent and Canary. Without DR, CPU spikes when you hover DOM nodes, and normalizes when you stop and hover just one. With DR enabled, CPU never releases, whether it's 60%+, or 20%+, depending on the version.
narcolepticinsomniac
on 30 Aug 2020
Ah, my DR config is different. When I enable dynamic mode I see what you mean. Can't investigate though because devtools can't simultaneously run js profiler while I use its other features like node highlighting...
tophf
on 30 Aug 2020
IIRC, I searched the dynamic theme for animations, and came up empty. Could be I missed something, but I've never found anything obvious in the DOM either. I suppose it's very possible there's other triggers too. Maybe some other fancy CSS properties.
narcolepticinsomniac
on 30 Aug 2020
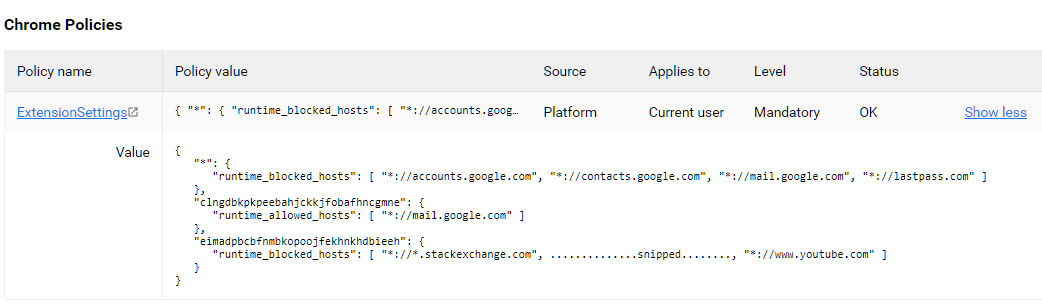
Something I can do is chrome://tracing
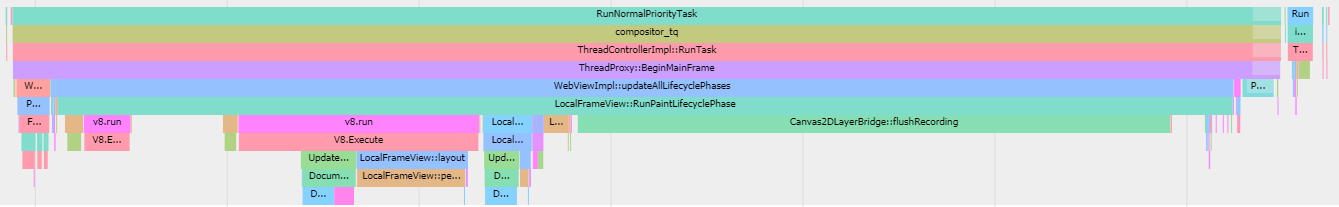
This is what happens in the tab process every 16ms, the image spans 7ms so it's roughly 43%. The image shows something recalculates styles and uses Canvas for adjustments, which implies it's DR as it indeed does all that in dynamic mode, AFAICT.
I don't know why they do it in every presentation frame (60fps ~ every 16ms) though. I would have thought it's only necessary when there is a DOM change.
tophf
on 30 Aug 2020
This is a browser bug though, right? We know an active CSS animation can cause it. It happens frequently enough on random pages without DR, that there must be other triggers. It stands to reason, since DR injects CSS, that something they inject also triggers this bug, animation or otherwise.
narcolepticinsomniac
on 30 Aug 2020
The image shows that it's DR who runs its own JS code every frame so maybe there's something they can do about it...
tophf
on 30 Aug 2020
That's cool, thanks. I'm still confused though. I don't get how hovering DOM nodes triggers DR to do anything. I thought it was the other way around, and something DR injected triggered the known CPU bug in devtools. The behavior is almost identical.
narcolepticinsomniac
on 30 Aug 2020
Maybe devtools does something at every frame that triggers DR's adjustment code. Still, this is something DR devs might be able to fix.
tophf
on 30 Aug 2020
Wouldn't that be sweet. I've come to terms with the fact that the browser bug's gonna suck for a while, but I forget about the DR CPU issue constantly, until the fans kick on. Sucks every time. I'll pass along the info, thanks.
narcolepticinsomniac
on 30 Aug 2020
The image shows that it's DR who runs its own JS code every frame so maybe there's something they can do about it...
Just this. Nothing else is loaded in animation Frame as far I can tell.
The image shows something recalculates styles and uses Canvas for adjustments, which implies it's DR as it indeed does all that in dynamic mode,
We have canvas for image calculating, but having a simple break point on that isn't getting triggered.
Re-calculating styles is native browser code however, extension can trigger it like this piece of code, but this happens regardless of hovering elements on a normal rate.
 Gusted
on 30 Aug 2020
Gusted
on 30 Aug 2020
@Gusted, if I disable rAF by running requestAnimationFrame = () => {} in DR's content script context the bug goes away so maybe breakpoints aren't triggered while node highlighter is active in devtools. The bug here is specifically the fact that CPU isn't reset to 0 when I stop moving the mouse over the page in Ctrl-Shift-C mode.
tophf
on 30 Aug 2020
The bug here is specifically the fact that CPU isn't reset to
0when I stop moving the mouse over the page in Ctrl-Shift-C mode.
I'm getting lost. So this means when every frame we are checking the styles it's re-calculating styles but when devtools is going over the nodes it's actually getting CPU Spikes etc, alongside the checking styles.
Gusted
on 30 Aug 2020
Not sure what to clarify...
Without DR's dynamic mode when I stop moving the mouse, tab's CPU is reset to 0.
With DR's dynamic mode when I stop moving the mouse, tab's CPU stays at 60% or so. Disabling rAF fixes the problem.
tophf
on 30 Aug 2020
Well that should mean that a less less bloated version of this rAF behavior should also trigger the bug.
exampla.zip
@narcolepticinsomniac Could you have a try, for me it's regardless of any rAF a high power usage.
Gusted
on 30 Aug 2020
Yes, the same problem is observed with exampla.
BTW, I guess Chrome 85 is the version that has that devtools patch because CPU consumption is reduced to 25% during hovering and 15% afterwards, which is almost 3 times less than Chromium 84 I'm using now.
tophf
on 30 Aug 2020
What about a even less bloated version
exampla.zip Just to make sure it's accessing a sheet of a stylesheet.
Gusted
on 30 Aug 2020
Yep, same.
tophf
on 30 Aug 2020
Than I'm really confused why in earth a simple element.sheet.cssRules.lenght alongside hovering elements in devtools is causing this.
Gusted
on 30 Aug 2020
@narcolepticinsomniac
If you like to, you can open up a issue for another cpu spike only this time with the less less bloated version of dark reader as we are kinda forced to check the length of the css rules in order to make sure we stay up to date with the styles to modify.
Gusted
on 31 Aug 2020
Could you have a try
Yeah, man, the example has the same bug.
If you like to, you can open up a issue for another cpu spike only this time with the less less bloated version of dark reader
I'd be happy to, but tbh, you both seem to have a better handle on what's causing this issue than I do.
narcolepticinsomniac
on 31 Aug 2020
I'd be happy to, but tbh, you both seem to have a better handle on what's causing this issue than I do.
I have already another issue specific to my System(High power usage). The whole CPU Spike is maybe 1/2% higher than normal for my CPU 🤷🏽♀️ I can't make a issue about that.
Gusted
on 31 Aug 2020
Do you know how to fix this problem, and want me to file a new issue to address it? If so, I'll gladly attempt to pass off tophf's debugging as my own brilliant deductions. =)
narcolepticinsomniac
on 31 Aug 2020
Than I'm really confused why in earth a simple
element.sheet.cssRules.lenghtalongside hovering elements in devtools is causing this.
Someone at chromium owes me a explanation. That's the only thing I know.
I'll gladly attempt to pass off tophf's debugging as my own brilliant deductions. =)
Oh oh please hold me out of the upcoming drama 😈
Gusted
on 31 Aug 2020
No drama. Tophf is used to me taking credit for his hard work. =)
I'm just not following what you're looking for me to do here. Nobody hates this bug more than I do, so it's not for lack of interest. Tell me what I should say, and where I should say it, and I'll do so.
If you know what's causing the CPU issue, and how to fix it, I'm not sure why you wouldn't just go ahead and do it. If it's just semantics, and you want a new issue filed which better describes the issue, you seem to have a way better understanding of how that should go.
narcolepticinsomniac
on 31 Aug 2020
If you know what's causing the CPU issue, and how to fix it, I'm not sure why you wouldn't just go ahead and do it. If it's just semantics, and you want a new issue filed which better describes the issue, you seem to have a way better understanding of how that should go.
I don't, the only possible logical explanation is that when multiple process. e.g. now the site itself(a isolated sandboxed process) whereby the extension runs also out of context(Last time I checked) and a Devtools(A isolated process in direct contact with it's site) is accessing the same rule at the same time(as it's run on different process it can be possible) this is not being handled right I guess, as it's like I said a isolated process, so who would expect this behavior.
But this is just a very very wild thought from what I logical can up with.
Just open up a chromium bug and make sure to have this  and than fill out the rest. About it's causing a spike along side a very simple extension.
Gusted
on 31 Aug 2020
open up a chromium bug
Booo!
I thought the objective here was for DR to work around Chromium's shortcomings. Tophf seems to think it can be done. Chromium wouldn't even adequately fix their own ludicrous performance issues, which occur independently from any extension. The odds of even getting a response to any performance issue caused by a conflict with an extension are astronomical.
narcolepticinsomniac
on 31 Aug 2020
Tophf seems to think it can be done.
Than he can show me how. As we need to check the length of the styles. As caching whole Stylesheets will look good on my memory(Thank you gmail for being so un-optimized like always). And probably CSSRules itself can cause this. As it's already being accessed anyway 🤷🏽♀️.
The odds of even getting a response to any performance issue caused by a conflict with an extension are astronomical.
Well it's triggering specific code that is causing this. I can think having this code on a site can cause the issue as well.
Gusted
on 31 Aug 2020
I don't know how DR works in dynamic mode so I suggested it probably can do the check only if DOM is mutated e.g. use MutationObserver instead of requestAnimationFrame.
tophf
on 1 Sep 2020
I don't know how DR works in dynamic mode so I suggested it probably can do the check only if DOM is mutated e.g. use MutationObserver instead of requestAnimationFrame.
Not sure if MutationObserver works for when a stylesheet(non-DOM) changes it's cssRules.
Also CC: @alexanderby
Gusted
on 1 Sep 2020
But even now DR won't detect the change if the amount of added rules equals the amount of removed rules e.g. one rule is added and one removed. Anyway, like I said my idea was that DR only needs to react to DOM changes because I thought that covers 99.99999% of cases. If that's not so, then this is the end of my idea.
tophf
on 1 Sep 2020
one rule is added and one removed
Never seen that issue 🤷🏽♀️
Anyway, like I said my idea was that DR only needs to react to DOM changes because I thought that covers 99.99999% of cases. If that's not so, then this is the end of my idea.
unfortunate style sheets are behaving the same as Constructable Stylesheets. What means it doesn't show up into the DOM.
Gusted
on 1 Sep 2020
It looks like you guys are saying requestAnimationFrame is buggy when used in conjunction with node highlighting, creating the CPU issue.
If that's the case, and requestAnimationFrame is necessary for reliability, couldn't you detect whether devtools is open and not recalculate if it is? I've played around a little with devtools in the past, and IIRC, you can do a simple tab query to check if the URL exists, at least in Chromium.
I might've been using a devtools specific API to detect, but I don't think so. Either way, detecting devtools to prevent the CPU loop should be doable.
narcolepticinsomniac
on 2 Sep 2020
The more I think about it, devtools being detectable via the tabs API might be my memory playing tricks on me, combined with wishful thinking.
At the time, I was experimenting with with running the Stylus UI in a devtools panel, and I just dug up an old WIP, and all the navigation was handled via message passing.
Obviously, you can definitely detect devtools if you're injecting a panel and running a script, but that requires an API, and would be a pretty convoluted way to simply detect devtools. There must be a simpler way to detect though.
narcolepticinsomniac
on 2 Sep 2020
Damn. I'm playing around with that old WIP now, and I wish I followed through with it. The code is jenky af, no doubt, but I had it working pretty damn good in Chromium, and I still think the ability to run the whole UI through a devtools panel is super convenient.
IIRC, some functionality and navigation needed tweaking when the UI is run in a panel, and in Chromium, I went with lazy window.top checks, which isn't compatible with FF. If we fixed those checks, there were only a couple other minor issues to work around.
@tophf Check out this old WIP in Chromium. I even had the manager opening applicable styles by default.
narcolepticinsomniac
on 2 Sep 2020
At the time, I obviously concluded it was more aggravation than it was worth, and that's probably still true. Having forgotten most of the frustrating little compatibility issues now, it seems like a cool idea again. =)
narcolepticinsomniac
on 2 Sep 2020
@Gusted to detect a change in constructable stylesheets it's much more reliable to intercept its setter in page context, example: page.js.
@narcolepticinsomniac to detect devtools being open there's a better trick: https://stackoverflow.com/questions/7798748/
tophf
on 2 Sep 2020
There must be a simpler way to detect though.
Figured there had to be, given all the shady sites who freeze script execution when you open them.
So without even having to change their approach, couldn't DR simply detect if devtools are open, and not recalculate styles if they are?
narcolepticinsomniac
on 2 Sep 2020
@Gusted to detect a change in constructable stylesheets it's much more reliable to intercept its setter in page context, example: page.js.
I remember a conversation with me and alexander about adoptedStyleSheets and use to intercept to detect changes, however he was against this idea and probably not going to like this idea either.
So without even having to change their approach, couldn't DR simply detect if devtools are open, and not recalculate styles if they are?
That means I can't debug bugs that involves stylesheets and dark reader doing something about it.
Gusted
on 2 Sep 2020
he was against this idea and probably not going to like this idea either.
Why? This is the only correct method. Your current method is not reliable.
tophf
on 2 Sep 2020
Why? This is the only correct method. Your current method is not reliable.
I've already asked alexander for a comment so hopefully you have a answer soon.
Not sure what he said as I can't find the the messages about it anymore.
Gusted
on 2 Sep 2020
This is the only correct method. Your current method is not reliable.
IME, tophf only sounds that sure of himself when he is.
Truthfully, it doesn't matter to me if it's fixed correctly, or some jenky workaround, as long as devtools are more responsive when DR is enabled, and I'm not constantly realizing CPU is going haywire when trying to inspect.
That means I can't debug bugs
If that's a concern, then you could only bypass recalculating styles when devtools are open in non-dev installs. We have some minor differences in behavior and functionality based on install types.
narcolepticinsomniac
on 2 Sep 2020
Related issues
 Mottie
·
39Comments
Mottie
·
39Comments
 saxamaphone69
·
64Comments
saxamaphone69
·
64Comments
 HoLLy-HaCKeR
·
74Comments
narcolepticinsomniac
·
27Comments
HoLLy-HaCKeR
·
74Comments
narcolepticinsomniac
·
27Comments
 tkosamja
·
49Comments
tkosamja
·
49Comments