Streamlit: Altair support - Layer charts dont appear to work in streamlit
Summary
Altair appears to work just fine inside streamlit, but I have problems getting layer charts to work. Note - Concat (vert/horizontal) of altair charts works fine, but doing something like
(chart1 + chart2).resolve_scale(y='independent')
results in everything going blank and no chart canvas displayed
Steps to reproduce
What are the steps we should take to reproduce the bug:
- Build 2 altair charts inside the same streamlit script, ideally with a shared x-axis like time/date (so it makes sense to crate a compound chart)
- try to layer them using
(chart1 + chart2).resolve_scale(y='independent')
Expected behavior:
The layer chart should display with different y-axes
Actual behavior:
Nothing displays - the chart fades as if to reload but everything goes blank
Is this a regression?
this works elsewhere, e.g. in jupyterlab
Debug info
- Streamlit version: 0.60.0
- Python version: Python 3.7.4
- Using Conda
- OS version: Mac OS X Catalina
- Browser version: Brave, Version 1.10.97 Chromium: 83.0.4103.116
Additional information
If needed, add any other context about the problem here. For example, did this bug come from https://discuss.streamlit.io or another site? Link the original source here!
 niviksha
All 3 comments
Hi @niviksha, thanks for the issue. It looks like Streamlit magics does not detect the output of resolve_scale as an Altair object, but you can display the Altair layer through st.altair_chart as a workaround.
Code sample :
import altair as alt
from altair.expr import datum
from vega_datasets import data
import streamlit as st

stocks = data.stocks.url

base = alt.Chart(stocks).encode(
    x='date:T',
    y='price:Q',
    color='symbol:N'
).transform_filter(
    datum.symbol == 'GOOG'
)

(base.mark_line() + base.mark_point()).resolve_scale(y='independent') # does not work
st.write((base.mark_line() + base.mark_point()).resolve_scale(y='independent')) # works
st.altair_chart((base.mark_line() + base.mark_point()).resolve_scale(y='independent')) # works
 andfanilo
on 6 Jul 2020
andfanilo
on 6 Jul 2020
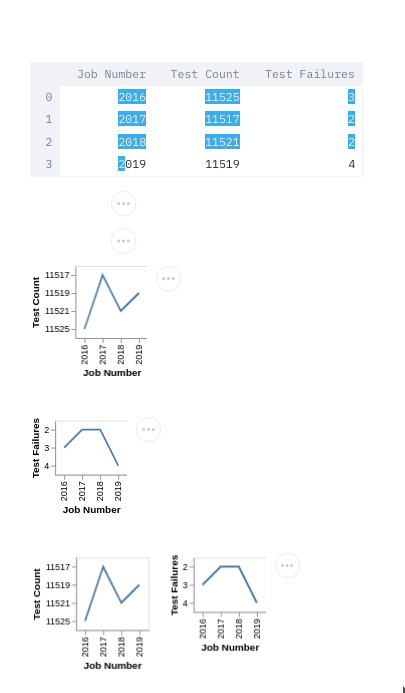
Running into this problem on 0.65 for any variation of the methods outlined above.
#!/usr/bin/env python3

# Testing if layered charts work in streamlit. Showing up blank for me.

import altair as alt
from altair.expr import datum
import pandas
import streamlit as st

results=[
    [2016, 11525, 3],
    [2017, 11517, 2],
    [2018, 11521, 2],
    [2019, 11519, 4],
]

dataframe = pandas.DataFrame(
    results,
    columns=["Job Number", "Test Count", "Test Failures"]
)
st.dataframe(dataframe)
base = alt.Chart(dataframe).encode(alt.X('Job Number:O'))
chart_test_count = base.mark_line().encode(alt.Y('Test Count:N'))
chart_test_failures = base.mark_line().encode(alt.Y('Test Failures:N'))

st.write((chart_test_count + chart_test_failures).resolve_scale(y='independent'))
st.altair_chart((chart_test_count + chart_test_failures).resolve_scale(y='independent'))

st.altair_chart(chart_test_count)
st.altair_chart(chart_test_failures)
st.altair_chart(chart_test_count | chart_test_failures)
 stonier
on 7 Oct 2020
stonier
on 7 Oct 2020
@andfanilo as you mentioned, resolve_scale isn't passing back the requisite object. I can get the preceding code to work if I then append some additional methods to it. e.g.
# Doesn't work
st.altair_chart((chart_test_count + chart_test_failures).resolve_scale(y='independent'))
# Works
st.altair_chart((chart_test_count + chart_test_failures).resolve_scale(y='independent').properties(width=650,height=400))
Related issues
 alelasantillan
·
3Comments
alelasantillan
·
3Comments
 tconkling
·
3Comments
tconkling
·
3Comments
 monchier
·
3Comments
monchier
·
3Comments
 imneonizer
·
3Comments
imneonizer
·
3Comments
 matthew-trava
·
3Comments
matthew-trava
·
3Comments
Most helpful comment
Hi @niviksha, thanks for the issue. It looks like Streamlit magics does not detect the output of
resolve_scaleas an Altair object, but you can display the Altair layer throughst.altair_chartas a workaround.Code sample :