Streamlit: Performance in Docker container degrades over time
Steps to repro
1) Clone https://github.com/MarcSkovMadsen/awesome-streamlit
2) Run the "installation" steps from here
3) Run the "build and run the application" steps from that same link
4) Connect to localhost:8501
5) Look at CPU usage of Docker container
6) Leave browser open for 30min
7) Look at CPU usage of Docker container
 tvst
tvst
All 24 comments
It's a good reproduction steps but note it's on port 80.
But an alternative for 1. to 4. would be
docker run -it -p 80:80 --entrypoint "streamlit" marcskovmadsen/awesome-streamlit:latest run app.py
You can also run the bash shell interactively if need using
docker run -it -p 80:80 --entrypoint "/bin/bash" marcskovmadsen/awesome-streamlit:latest
I'm also tracking the issue at the repo here
https://github.com/MarcSkovMadsen/awesome-streamlit/issues/6
 MarcSkovMadsen
on 11 Oct 2019
MarcSkovMadsen
on 11 Oct 2019
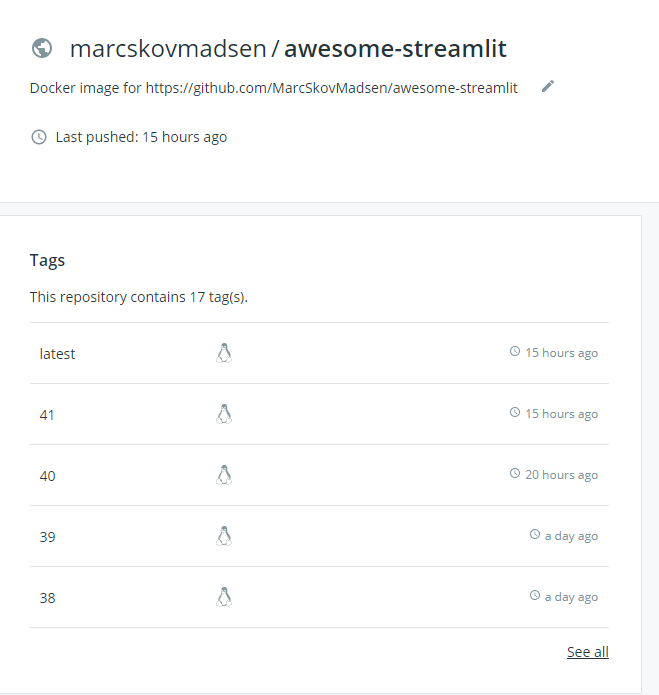
For future reference the current Docker container is tagged 41
MarcSkovMadsen
on 11 Oct 2019
Hi @tvst
One fun observation is that it seems the 100% CPU usage i was experiencing in my Docker container on Azure has stopped here. Last time the CPU was at 100% is shown below.
If I investigate my Azure builds then I find that it's when I added debugging info to the container

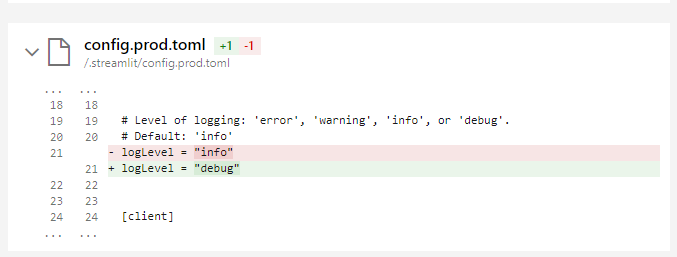
The only place i'm doing anything with logging is here

MarcSkovMadsen
on 11 Oct 2019
Hi @tvst
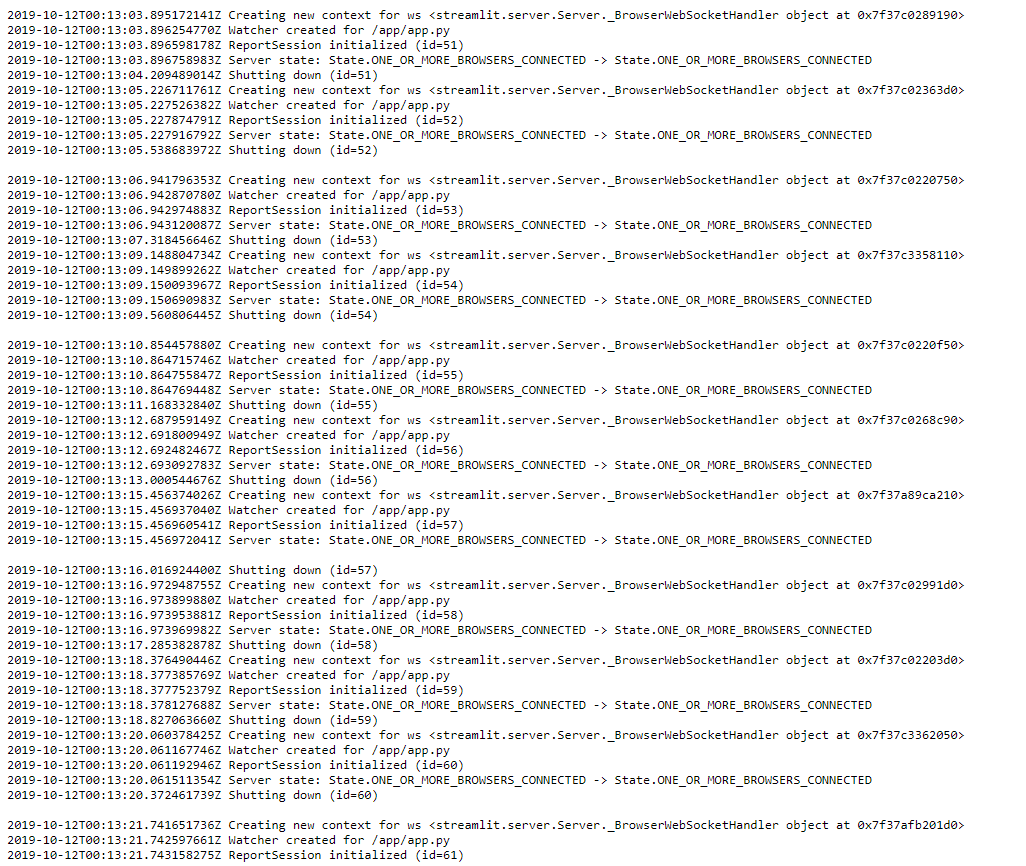
You (and others) can find a full log file here https://awesome-streamlit.scm.azurewebsites.net/api/vfs/LogFiles/2019_10_12_RD0003FF542A9C_default_docker.log
Why do I see so many "shutdown. Should it do that.
MarcSkovMadsen
on 12 Oct 2019
I've turned on "Always on"

According to https://stackoverflow.com/questions/30847090/django-fastcgi-app-on-azure-frequent-restarts/30854511#30854511 and https://lnx.azurewebsites.net/python-app-on-azure-web-apps-frequently-restarts/ the app can timeout after 20 min of idle time.
I also found this
at https://docs.microsoft.com/en-us/azure/app-service/webjobs-create.
So maybe tomorrow I will try setting up a job to ping my web app every 20 minutes or so.
MarcSkovMadsen
on 12 Oct 2019
I've had my docker container running for 6 hours locally. And it's just as responsive now as when I started it.
And the %CPUand %MEM now (see below) is the same now as when I started it.
Thus I now believe the problem is in the Azure Deployment.
MarcSkovMadsen
on 13 Oct 2019
I've created the below script to ping https://awesome-streamlit.azurewebsites.net/ on a regular basis to keep the site responsive as indicated by https://lnx.azurewebsites.net/python-app-on-azure-web-apps-frequently-restarts/
I'm running the script on my local laptop for now. Later it should be deployed to Azure Functions or similar if it helps.
- I've also done a lot of changes to the app as well.
- Sprinkling cache everywhere on my code.
- Sprinkling spinners everywhere on my code.
- My app is now so fast and responsive locally but it's not nearly as responsive yet in the azure cloud.
So i'm not there yet. But the app can now be used.
"""This job pings the awesome-streamlit site regularly to keep it alive

- https://lnx.azurewebsites.net/python-app-on-azure-web-apps-frequently-restarts/
- https://stackoverflow.com/questions/30847090/
django-fastcgi-app-on-azure-frequent-restarts/30854511#30854511
"""
import logging
import time
from typing import Optional

import requests

logging.basicConfig(format="%(asctime)s - %(message)s", level=logging.INFO)


def ping(
    url: str = "https://awesome-streamlit.azurewebsites.net/",
    sleep_secs: Optional[float] = 2,
):
    """Pings the url every sleep_secs seconds

    Awesome-streamlit uses this job to keep the web application awake. Cf

    - https://lnx.azurewebsites.net/python-app-on-azure-web-apps-frequently-restarts/
    - https://stackoverflow.com/questions/30847090/
django-fastcgi-app-on-azure-frequent-restarts/30854511#30854511

    Keyword Arguments:
        url {str} -- The site to pint (default: {"https://awesome-streamlit.azurewebsites.net/"})
        sleep_secs {float} -- If None the site will be pinged once.
If not None the site will be pinged every sleeps_seconds seconds (default: {200})

    If we setup multiple tenants later we should change the request to a specific website_instance
    ```python
    cookies = dict(ARRAffinity=website_instance_id)
    response = requests.get(url, cookies)  # type:ignore
    ```
    """
    count = 1
    while count == 1 or sleep_secs:
        logging.info("Request %s sent", count)

        response = requests.get(url)
        logging.info(
            "Response %s received, status_code=%s, elapsed=%s",
            count,
            response.status_code,
            response.elapsed,
        )
        text_len = len(response.text)
        logging.info(
            "Response text %s received, len(text)=%s, elapsed=%s",
            count,
            text_len,
            response.elapsed,
        )

        count += 1
        logging.info("Sleeping %s seconds", sleep_secs)
        if sleep_secs:
            time.sleep(sleep_secs)  # type: ignore


if __name__ == "__main__":
    ping(sleep_secs=60)
The Docker container is still loosing performance on Azure despite the pinging every 60 seconds.
But when I redeploy the container it's now almost as fast as locally.
Locally it's very performant when I start the container and after hours of running. Truly awesome.
MarcSkovMadsen
on 13 Oct 2019
FYI @tvst and @treuille
THIS IS IMPORTANT. THERE IS NOW ANOTHER EXAMPLE OF AN APPLICATION WITH INCREASING RESPOSE TIMES. AND ITS NOT DEVELOPED BY ME.
when I first tried it out some days ago it was fast and responsive. Now the response times are 20+ seconds.
You find it here
https://fullstackstation.com/streamlit-components-demo
And it's announced here https://discuss.streamlit.io/t/how-to-use-streamlit-with-nginx/378
MarcSkovMadsen
on 13 Oct 2019
Thanks for the heads up, Marc! We'll have someone take a look at these two issues tomorrow.
It turns out Streamlit has become more popular than we could imagine, so we're having to play catch-up with bug reports like these. (But don't worry: we just hired a new awesome engineer and we're interviewing even more!)
tvst
on 14 Oct 2019
Hi @tvst
Any news on this issue. Thanks in advance.
MarcSkovMadsen
on 17 Oct 2019
Just a few updates
- AlwaysOn setting discussed above was for some reason not on. I've turned it on (again?).
- I've changed my docker container such that it in addition to running the
streamlit run app.pycommand also runs a small script pinging awesome-streamlit.org every 300 seconds to keep the container alive. It looks like
MarcSkovMadsen
on 17 Oct 2019
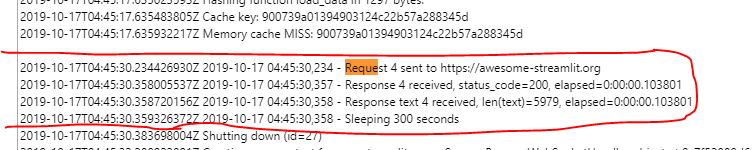
One thing I don't understand @tvst is that the ping request to awesome-streamlit.org (source code below) responds very fast (0.1 to 0.3 seconds) both locally on my laptop and in azure cloud.
But from chrome locally on my laptop to awesome-streamlit.org the response is much, much slower before I can see the rendered page. Like 4-6 seconds if the container has just been deployed.
Is that because the simple request (in code) just gets the basic things and from Chrome there is all the websocket communication and page rendering?
I'm just wondering how to get a decent performance from the cloud, when I can see that it's so fast and responsive locally. Any hints?
"""This job pings the awesome-streamlit site regularly to keep it alive
- https://lnx.azurewebsites.net/python-app-on-azure-web-apps-frequently-restarts/
- https://stackoverflow.com/questions/30847090/
django-fastcgi-app-on-azure-frequent-restarts/30854511#30854511
"""
import logging
import time
from typing import Optional

import requests

logging.basicConfig(format="%(asctime)s - %(message)s", level=logging.INFO)


def ping(url: str = "https://awesome-streamlit.org", sleep_secs: Optional[float] = 600):
    """Pings the url every sleep_secs seconds
    Awesome-streamlit uses this job to keep the web application awake. Cf
    - https://lnx.azurewebsites.net/python-app-on-azure-web-apps-frequently-restarts/
    - https://stackoverflow.com/questions/30847090/
django-fastcgi-app-on-azure-frequent-restarts/30854511#30854511
    Keyword Arguments:
        url {str} -- The site to pint (default: {"https://awesome-streamlit.azurewebsites.net/"})
        sleep_secs {float} -- If None the site will be pinged once.
If not None the site will be pinged every sleeps_seconds seconds (default: {200})
    If we setup multiple tenants later we should change the request to a specific website_instance
    ```python
    cookies = dict(ARRAffinity=website_instance_id)
    response = requests.get(url, cookies)  # type:ignore
    ```
    """
    count = 1
    while count == 1 or sleep_secs:
        logging.info("Request %s sent to %s", count, url)

        response = requests.get(url)
        logging.info(
            "Response %s received, status_code=%s, elapsed=%s",
            count,
            response.status_code,
            response.elapsed,
        )
        text_len = len(response.text)
        logging.info(
            "Response text %s received, len(text)=%s, elapsed=%s",
            count,
            text_len,
            response.elapsed,
        )

        count += 1
        logging.info("Sleeping %s seconds", sleep_secs)
        if sleep_secs:
            time.sleep(sleep_secs)  # type: ignore


if __name__ == "__main__":
    ping(sleep_secs=300)
I can see that the pinging has no effect.
In the beginning the response time is fine
But after some time the response time is very low again.
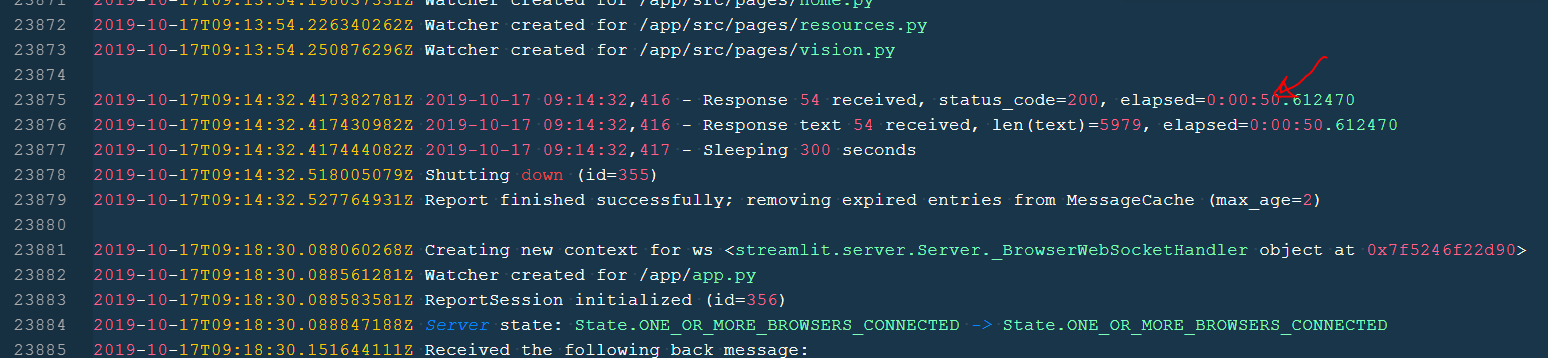
I've attached the full log including log from Streamlit. Maybe somebody can use that.
MarcSkovMadsen
on 17 Oct 2019
hi @MarcSkovMadsen
https://fullstackstation.com/streamlit-components-demo is mine.
I confirm that the response time 20+ seconds is my mistake in deployment. The streamlit application was deployed 2 processes duplicated, it's not docker.
Now, it's working well.
 virusvn
on 17 Oct 2019
virusvn
on 17 Oct 2019
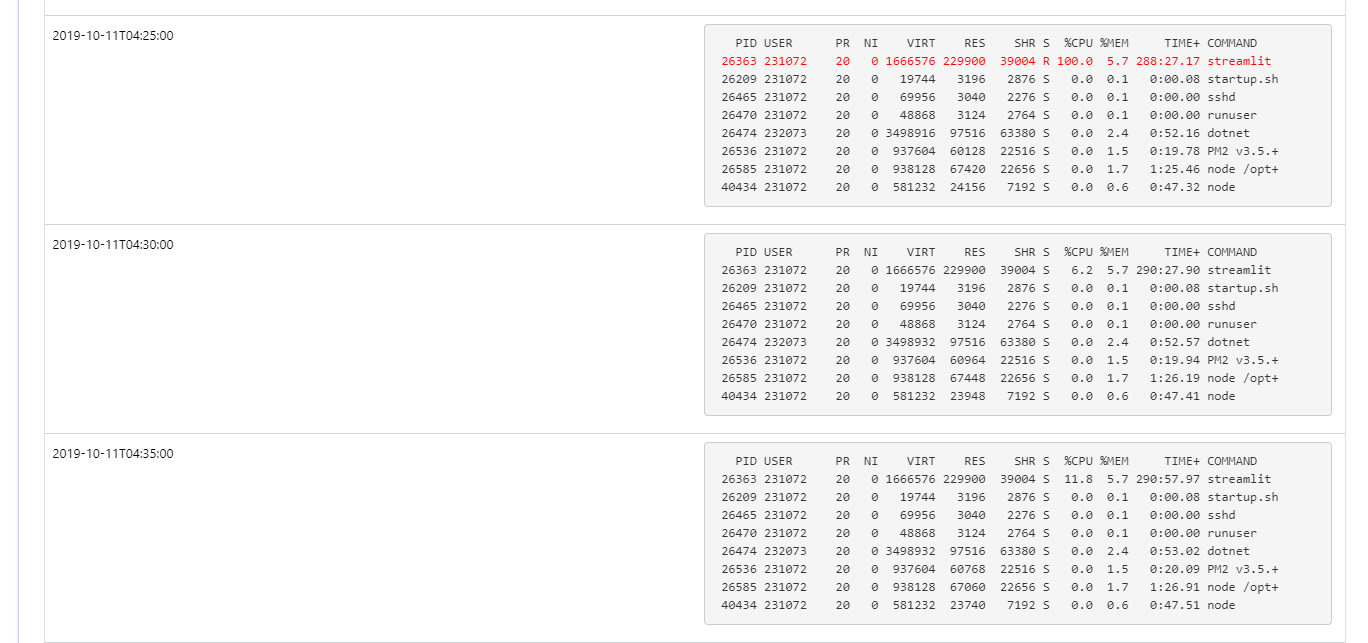
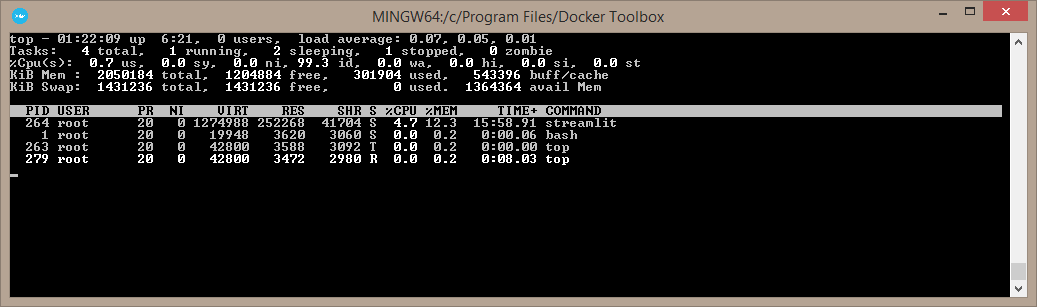
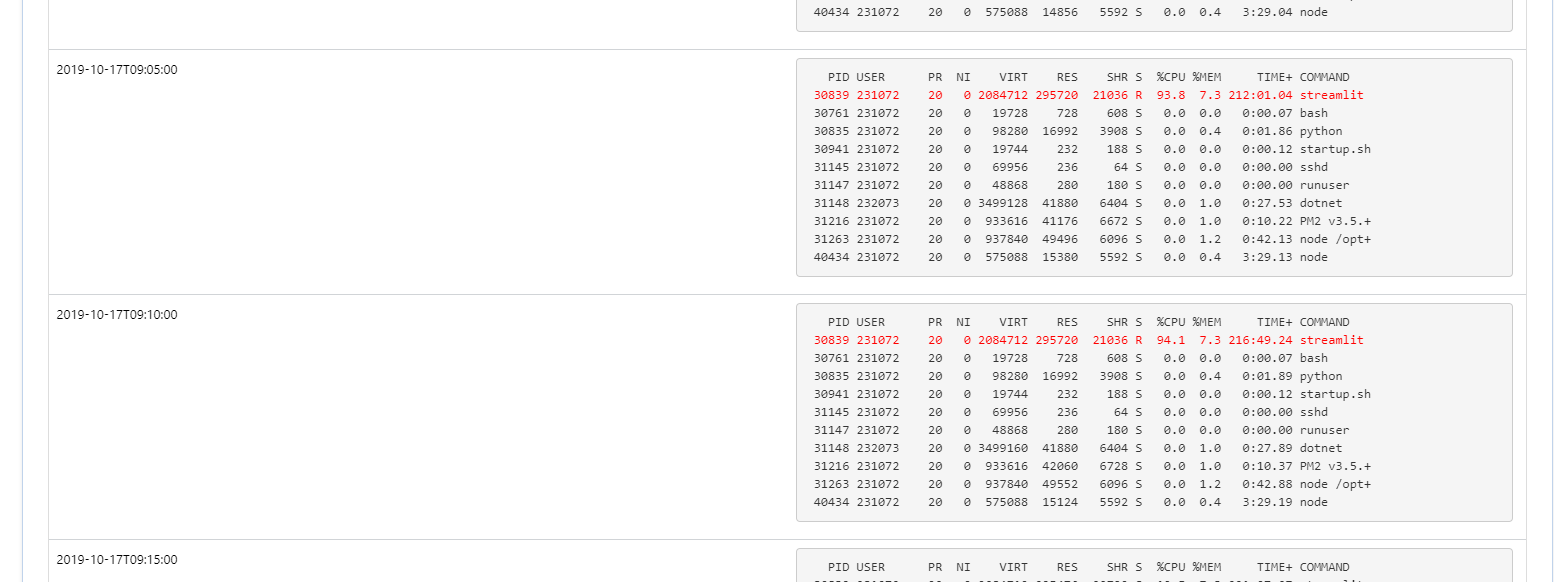
I've added a top command that shows the %CPU and %Memory usage to the script that is run inside the docker container for better traceability.
top -d 60 -b &
and the output looks something like
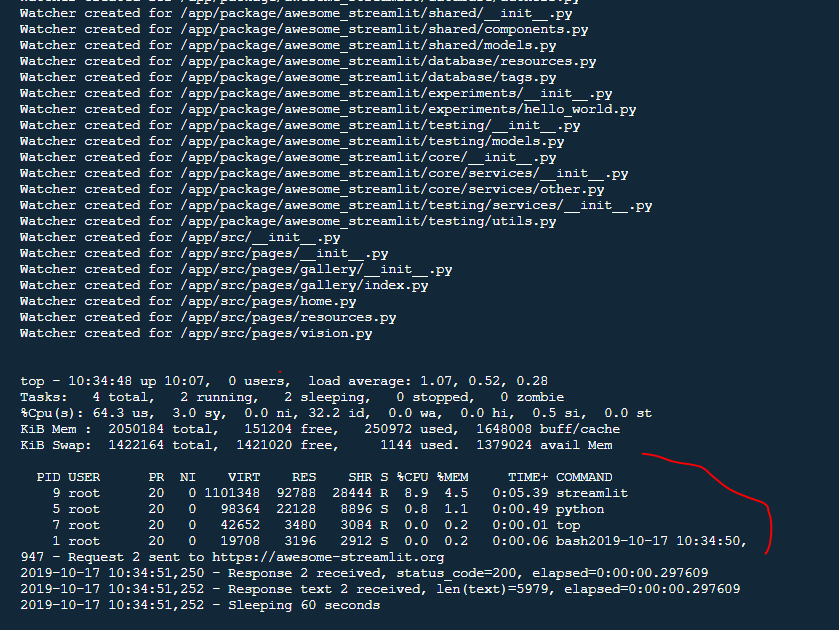
when the container is just started locally.
MarcSkovMadsen
on 17 Oct 2019
hi @MarcSkovMadsen
https://fullstackstation.com/streamlit-components-demo is mine.
I confirm that the response time 20+ seconds is my mistake in deployment. The streamlit application was deployed 2 processes duplicated, it's not docker.
Now, it's working well.
Thanks
MarcSkovMadsen
on 17 Oct 2019
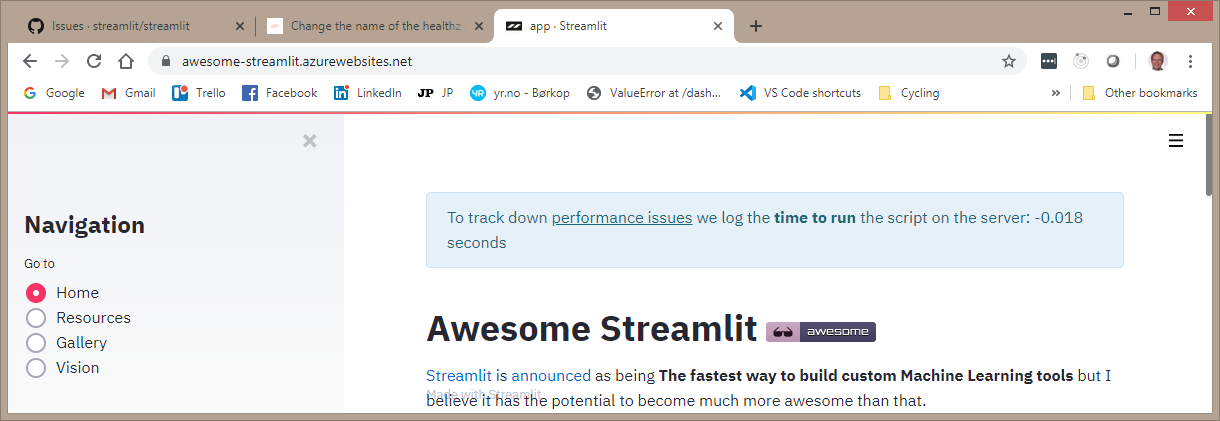
I've added a timer to record and display the execution time of the script in the backend
If i clear the cache and refresh https://awesome-streamlit.azurewebsites.net/ then is see
MarcSkovMadsen
on 17 Oct 2019
And I found another measure for the %CPU
MarcSkovMadsen
on 17 Oct 2019
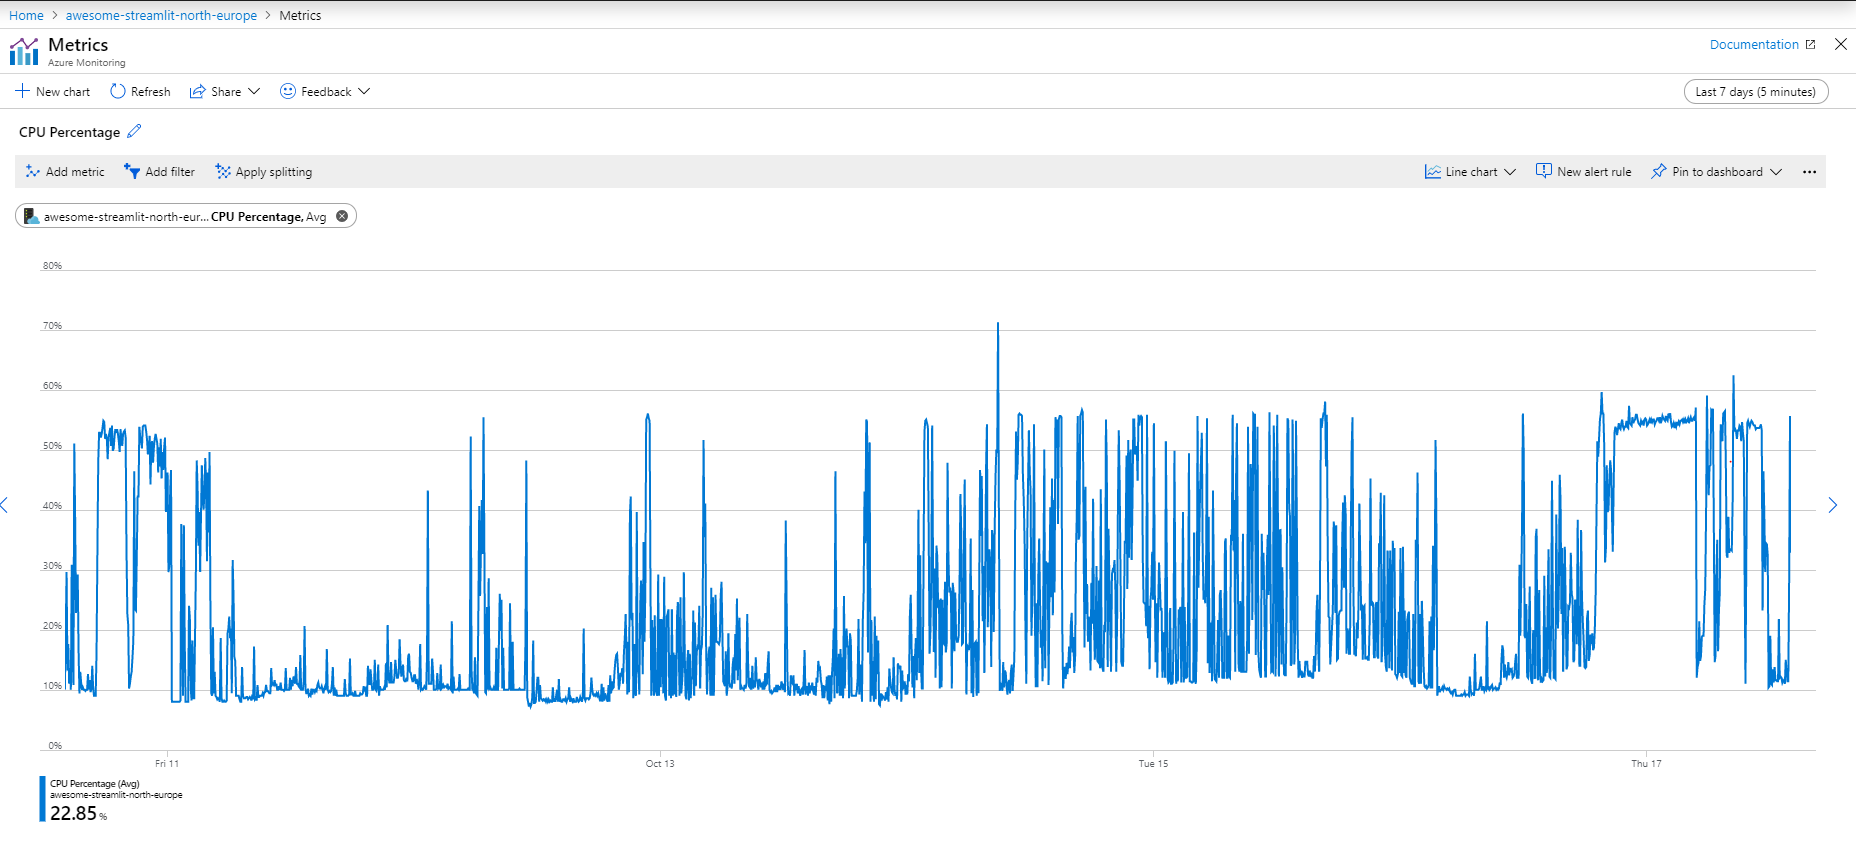
And there is still this high CPU Usage
But the funny thing if I take up the CPU usage in other reports then it is not high.
MarcSkovMadsen
on 17 Oct 2019
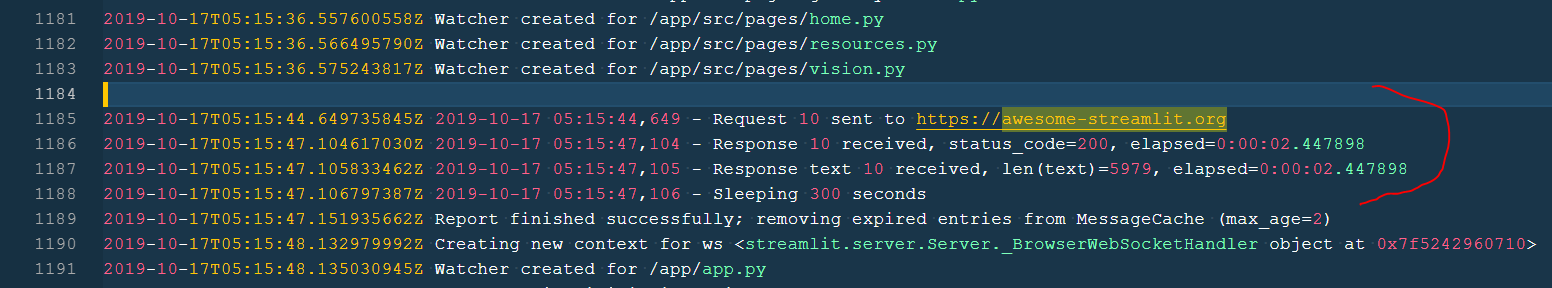
I now have better insight into the logs. One thing I notice is that File Watcher are often recreated
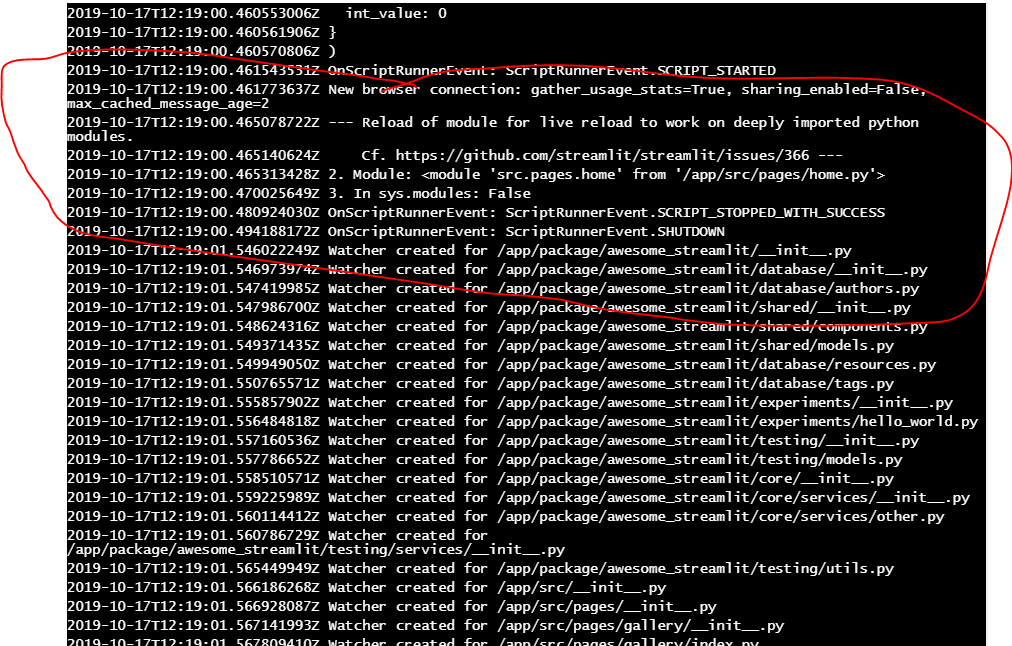
And the pattern is that it often happens after the import.reload i had to setup due to Streamlit not providing hot reloading for nested modules (cf. issue 366).
I have now removed the reloading
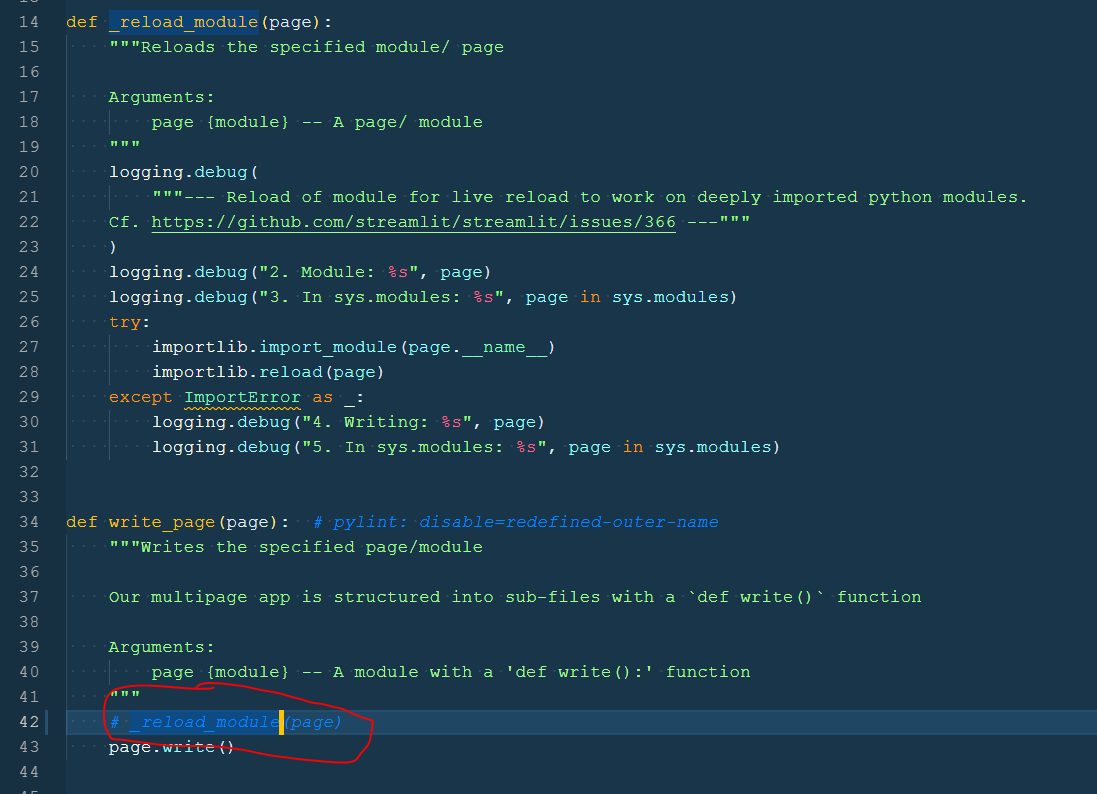
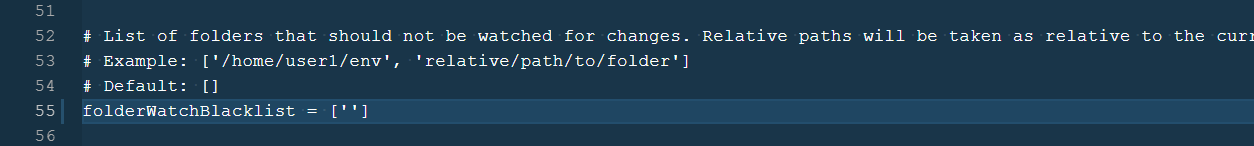
And setup that I don't need any file watchers in production.
MarcSkovMadsen
on 17 Oct 2019
Let's cross our fingers. The app has now had a truly amazing performance for 30 minutes. This is not what I have experienced until now.
It's so responsive. Almost like local !!!!!
MarcSkovMadsen
on 17 Oct 2019
FYI @tvst
The application https://awesome-streamlit.org/ has now been running with awesome performance for 12 hours.
YOU MAY CLOSE THIS ISSUE.
Thanks for the help
Marc
MarcSkovMadsen
on 18 Oct 2019
Great @MarcSkovMadsen !
From your comments in the original thread it looks like this was mostly due to the instance being brought down?
If so, that's indeed unrelated to Streamlit, so I'll close the thread.
But if you think there was something else afoot, please let us know!
tvst
on 22 Oct 2019
Related issues
 Va1da2
·
15Comments
Va1da2
·
15Comments
 robotastic
·
17Comments
robotastic
·
17Comments
 treuille
·
40Comments
treuille
·
40Comments
 andfanilo
·
23Comments
tvst
·
31Comments
andfanilo
·
23Comments
tvst
·
31Comments