Users sometimes want to lay items in a grid. For example:
image 1 | label 1 | score 1
image 2 | label 2 | score 2
image 3 | label 3 | score 3
The difference between a grid an a horizontal layout (Issue #241) is in a grid both the rows and the columns must line up.
And here's a straw-man API for this feature:
grid = st.grid()
for image_info in image_info_list:
  row = grid.row()
  # Now you can use row.foo() to do the same as st.foo(), but
  # the elements you insert will all go inside a horizontal
  # container.
  row.image(image_info.image)
  row.text(image_info.label)
  row.text(image_info.score)
...but this is just one of multiple possible APIs we could come up with here.
Everyone: what are other possible APIs?
 tvst
tvst
All 20 comments
A grid row could contain another grid, I am thinking something something that could build the following:
+-----------------+----------|----------------+
|                 | label 1  |   Score 1      |
|   Image 1       +----------|----------------+
|                 | label 2  |  Score 2       |
|                 +----------|----------------+
|                 |  label 3 |  score3        |
+-----------------+----------|----------------+
|                 | label1   |  score 1       |
|   Image 2       +----------|----------------+
|                 | label2   |  score2        |
|                 +----------|----------------+
|                 | label3   |  score3        |
+-----------------+----------|----------------+
The straw-man API would look something on the lines:
grid = st.grid()
for image, scores in images:
    row = grid.row()

    row.write(image) // aspect ratio or width as parameter
    subgrid = row.grid()
    for label, score in scores:
          row2 = subgrid.row()
          row2.write(label)
          row2.write(score)
On #241 , I suggested having a column()/col() method would help with defining aspect ratios of columns, similar to how https://github.com/pyviz/panel does. With col, the above code would look like:
grid = st.grid()
for image, scores in images:
    row = grid.row()

    row.col(width_ratio=1).write(image) // aspect ratio or width as parameter
    right_col = row.col(width_ratio=2) // meaning write col should be twice as large as left col
    for label, score in scores:
          small_row = right_col.row()
          small_row.col().write(label)
          small_row.col().write(score)
The last example doesn't break the general idea that write creates a new horizontal element, and makes the design explicit. This pattern is common across many tools (Android uses something very similar as well).
 ebonet
on 8 Oct 2019
ebonet
on 8 Oct 2019
Very interesting solution, great i 'll be tracking this issue :+1:
 imneonizer
on 17 Oct 2019
imneonizer
on 17 Oct 2019
See also this comment on app layout and grids
https://github.com/streamlit/streamlit/issues/486#issuecomment-548666166
 MarcSkovMadsen
on 1 Nov 2019
MarcSkovMadsen
on 1 Nov 2019
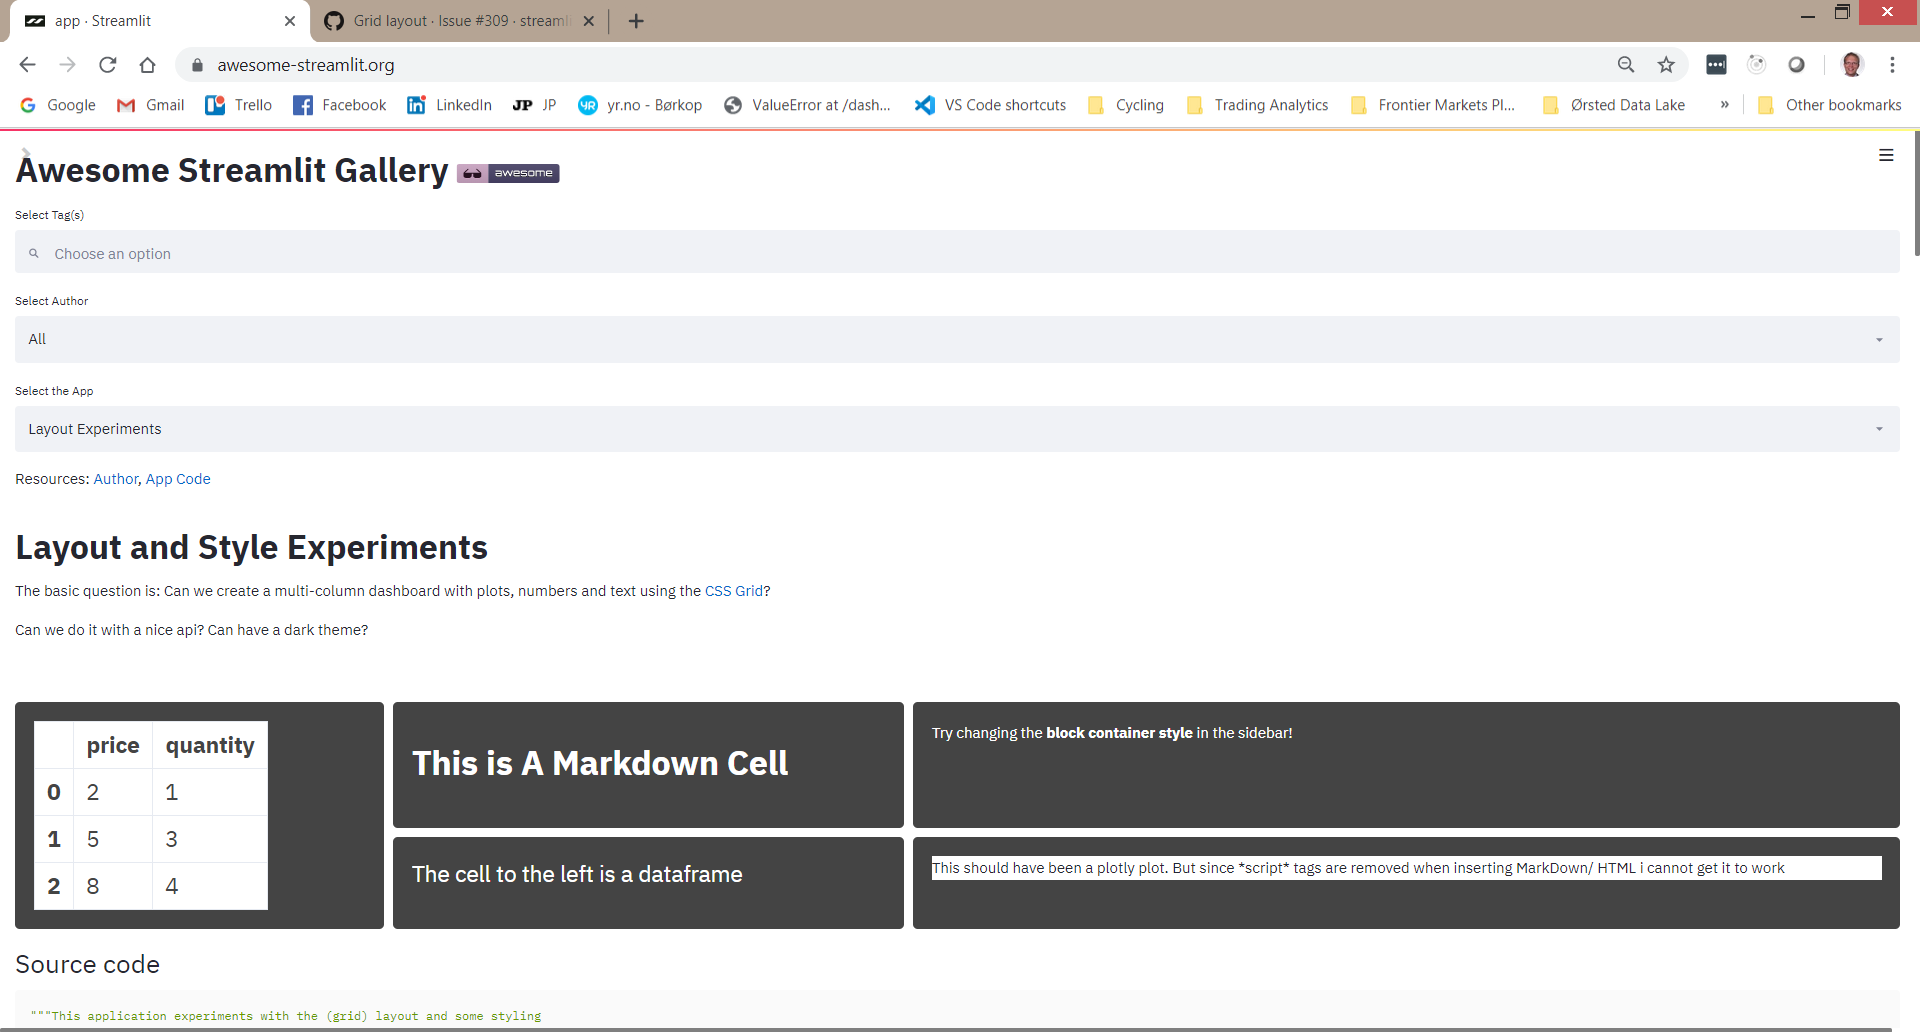
And here is my brainstorm on how a gridlayout could work. It's included in the gallery at awesome-streamlit.org.

"""This application experiments with the (grid) layout and some styling

Can we make a compact dashboard across several columns and with a dark theme?"""
from typing import List, Optional

import markdown
import pandas as pd
import streamlit as st
from plotly import express as px


def main():
    """Main function. Run this to run the app"""
    st.sidebar.title("Layout and Style Experiments")
    st.sidebar.header("Settings")
    st.markdown(
        """
# Layout and Style Experiments

The basic question is: Can we create a multi-column dashboard with plots, numbers and text using
the [CSS Grid](https://gridbyexample.com/examples)?

Can we do it with a nice api?
Can have a dark theme?
"""
    )

    select_block_container_style()
    add_resources_section()

    # My preliminary idea of an API for generating a grid
    with Grid("1 1 1") as grid:
        grid.cell(
            class_="a",
            grid_column_start=2,
            grid_column_end=3,
            grid_row_start=1,
            grid_row_end=2,
        ).markdown("# This is A Markdown Cell")
        grid.cell("b", 2, 3, 2, 3).text("The cell to the left is a dataframe")
        grid.cell("c", 3, 4, 2, 3).plotly_chart(get_plotly_fig())
        grid.cell("d", 1, 2, 1, 3).dataframe(get_dataframe())
        grid.cell("e", 3, 4, 1, 2).markdown("Try changing the **block container style** in the sidebar!")

def add_resources_section():
    """Adds a resources section to the sidebar"""
    st.sidebar.header("Add_resources_section")
    st.sidebar.markdown(
        """
- [gridbyexample.com] (https://gridbyexample.com/examples/)
"""
    )


class Cell:
    """A Cell can hold text, markdown, plots etc."""
    def __init__(
        self,
        class_: str = None,
        grid_column_start: Optional[int] = None,
        grid_column_end: Optional[int] = None,
        grid_row_start: Optional[int] = None,
        grid_row_end: Optional[int] = None,
    ):
        self.class_ = class_
        self.grid_column_start = grid_column_start
        self.grid_column_end = grid_column_end
        self.grid_row_start = grid_row_start
        self.grid_row_end = grid_row_end
        self.inner_html = ""

    def _to_style(self) -> str:
        return f"""
.{self.class_} {{
    grid-column-start: {self.grid_column_start};
    grid-column-end: {self.grid_column_end};
    grid-row-start: {self.grid_row_start};
    grid-row-end: {self.grid_row_end};
}}
"""

    def text(self, text: str = ""):
        self.inner_html = text

    def markdown(self, text):
        self.inner_html = markdown.markdown(text)

    def dataframe(self, dataframe: pd.DataFrame):
        self.inner_html = dataframe.to_html()

    def plotly_chart(self, fig):
        self.inner_html = f"""
<script src="https://cdn.plot.ly/plotly-latest.min.js"></script>
<body>
    <p>This should have been a plotly plot.
    But since *script* tags are removed when inserting MarkDown/ HTML i cannot get it to work</p>
    <div id='divPlotly'></div>
    <script>
        var plotly_data = {fig.to_json()}
        Plotly.react('divPlotly', plotly_data.data, plotly_data.layout);
    </script>
</body>
"""

    def to_html(self):
        return f"""<div class="box {self.class_}">{self.inner_html}</div>"""


class Grid:
    """A (CSS) Grid"""
    def __init__(
        self, template_columns="1 1 1", gap="10px", background_color="#fff", color="#444"
    ):
        self.template_columns = template_columns
        self.gap = gap
        self.background_color = background_color
        self.color = color
        self.cells: List[Cell] = []

    def __enter__(self):
        return self

    def __exit__(self, type, value, traceback):
        st.markdown(self._get_grid_style(), unsafe_allow_html=True)
        st.markdown(self._get_cells_style(), unsafe_allow_html=True)
        st.markdown(self._get_cells_html(), unsafe_allow_html=True)

    def _get_grid_style(self):
        return f"""
<style>
    .wrapper {{
    display: grid;
    grid-template-columns: {self.template_columns};
    grid-gap: {self.gap};
    background-color: {self.background_color};
    color: {self.color};
    }}
    .box {{
    background-color: {self.color};
    color: {self.background_color};
    border-radius: 5px;
    padding: 20px;
    font-size: 150%;
    }}
    table {{
        color: {self.color}
    }}
</style>
"""

    def _get_cells_style(self):
        return (
            "<style>" + "\n".join([cell._to_style() for cell in self.cells]) + "</style>"
        )

    def _get_cells_html(self):
        return (
            '<div class="wrapper">'
            + "\n".join([cell.to_html() for cell in self.cells])
            + "</div>"
        )

    def cell(
        self,
        class_: str = None,
        grid_column_start: Optional[int] = None,
        grid_column_end: Optional[int] = None,
        grid_row_start: Optional[int] = None,
        grid_row_end: Optional[int] = None,
    ):
        cell = Cell(
            class_=class_,
            grid_column_start=grid_column_start,
            grid_column_end=grid_column_end,
            grid_row_start=grid_row_start,
            grid_row_end=grid_row_end,
        )
        self.cells.append(cell)
        return cell

def select_block_container_style():
    """Add selection section for setting setting the max-width and padding
    of the main block container"""
    st.sidebar.header("Block Container Style")
    max_width_100_percent = st.sidebar.checkbox("Max-width: 100%?", False)
    if not max_width_100_percent:
        max_width = st.sidebar.slider("Select max-width in px", 100, 2000, 1200, 100)
    else:
        max_width = 1200
    padding_top = st.sidebar.number_input("Select padding top in rem", 0, 200, 5, 1)
    padding_right = st.sidebar.number_input("Select padding right in rem", 0, 200, 1, 1)
    padding_left = st.sidebar.number_input("Select padding left in rem", 0, 200, 1, 1)
    padding_bottom = st.sidebar.number_input(
        "Select padding bottom in rem", 0, 200, 10, 1
    )
    _set_block_container_style(
        max_width,
        max_width_100_percent,
        padding_top,
        padding_right,
        padding_left,
        padding_bottom,
    )


def _set_block_container_style(
    max_width: int = 1200,
    max_width_100_percent: bool = False,
    padding_top: int = 5,
    padding_right: int = 1,
    padding_left: int = 1,
    padding_bottom: int = 10,
):
    if max_width_100_percent:
        max_width_str = f"max-width: 100%;"
    else:
        max_width_str = f"max-width: {max_width}px;"
    st.markdown(
        f"""
<style>
    .reportview-container .main .block-container{{
        {max_width_str}
        padding-top: {padding_top}rem;
        padding-right: {padding_right}rem;
        padding-left: {padding_left}rem;
        padding-bottom: {padding_bottom}rem;
    }}
</style>
""",
        unsafe_allow_html=True,
    )

@st.cache
def get_dataframe() -> pd.DataFrame():
    """Dummy DataFrame"""
    data = [
        {"quantity": 1, "price": 2},
        {"quantity": 3, "price": 5},
        {"quantity": 4, "price": 8},
    ]
    return pd.DataFrame(data)

def get_plotly_fig():
    """Dummy Plotly Plot"""
    return px.line(
        data_frame=get_dataframe(),
        x="quantity",
        y="price"
    )

main()
I might later improve it. The improved file can be found here
https://github.com/MarcSkovMadsen/awesome-streamlit/blob/master/gallery/layout_experiments/app.py
MarcSkovMadsen
on 4 Nov 2019
@tvst . See above post.
MarcSkovMadsen
on 4 Nov 2019
And here is an image using the full screen width.
MarcSkovMadsen
on 4 Nov 2019
This looks pretty good, any updates on the plan for Streamlit to add in this feature?
 dipanjanS
on 16 Dec 2019
dipanjanS
on 16 Dec 2019
+1 Any updates?
 haossr
on 19 Dec 2019
haossr
on 19 Dec 2019
mark
 universewill
on 13 Jan 2020
universewill
on 13 Jan 2020
@MarcSkovMadsen, Great code, any thoughts on adding an image to a cell with the code you've written. Tried
<img src="path">in the markdown grid cell but that did not work.
The following function did the trick for my needs:
def image(self, image_path, width = "150px",height = "200px",caption = ""):
        data_uri = base64.b64encode(open(image_path, 'rb').read()).decode('utf-8')
        img_tag = '<br><figure ><center><img src="data:image/png;base64,{0}" width={2} height={3} ><figcaption>{1}</figcaption></center></figure>'.format((data_uri,caption,width,height))
        self.inner_html =  """<body>{0}</body>""".format(img_tag)
This feature would be very useful on streamlit, but the code kindly shared by @MarcSkovMadsen is doing the trick so far.
 rodrigoxrma
on 27 Jan 2020
rodrigoxrma
on 27 Jan 2020
Can't wait to hear more on this. I love streamlit and it would be even better with the power to play with the UI more.
 mindcodemediator
on 4 Mar 2020
mindcodemediator
on 4 Mar 2020
+1 for the easiest way to displaython the web
 david-huck
on 20 Mar 2020
david-huck
on 20 Mar 2020
I just started using Streamlit (and I really love it) and it would be great to have a simple Layout API for it!
So far I needed the only layout for the plotly plots, so for this particular case my solution was using plotly layout API, one example is here: https://stackoverflow.com/a/55501565/1376910
 galinaalperovich
on 26 May 2020
galinaalperovich
on 26 May 2020
And here is my brainstorm on how a gridlayout could work. It's included in the gallery at awesome-streamlit.org.
Fantastic suggestions Marc, as always! :)
 CharlyWargnier
on 24 Jun 2020
CharlyWargnier
on 24 Jun 2020
Great work! I hope to see this advance further.
The layout limitation and lack of some sort of session state is holding streamlit up from being adopted as a serious dashboarding contender.
 sabualkaz
on 15 Jul 2020
sabualkaz
on 15 Jul 2020
I tried to build a calculator with buttons and a output field, but it also requires a grid layout. Might be a good test-case as well for this feature request.
 mattijn
on 26 Jul 2020
mattijn
on 26 Jul 2020
Great code! I only miss the option to include widgets to a cell. I didn't find a way to get the widget Html code. Any thoughts on a way to add a widget to a cell?
 WilberDelbrison
on 31 Jul 2020
WilberDelbrison
on 31 Jul 2020
@WilberDelbrison I think a grid API like the ones discussed at the top would have to be implemented directly in streamlit to be able to include streamlit widgets in grid cells. I think the
working grid code above only works within an st.markdown() call
 benlindsay
on 1 Aug 2020
benlindsay
on 1 Aug 2020
@MarcSkovMadsen, Great code, any thoughts on adding an image to a cell with the code you've written. Tried
<img src="path">in the markdown grid cell but that did not work.The following function did the trick for my needs:
def image(self, image_path, width = "150px",height = "200px",caption = ""):
        data_uri = base64.b64encode(open(image_path, 'rb').read()).decode('utf-8')
        img_tag = '<br><figure ><center><img src="data:image/png;base64,{0}" width={2} height={3} ><figcaption>{1}</figcaption></center></figure>'.format((data_uri,caption,width,height))
        self.inner_html =  """<body>{0}</body>""".format(img_tag)
This feature would be very useful on streamlit, but the code kindly shared by @MarcSkovMadsen is doing the trick so far.
@rodrigoxrma what to pass in self (of this image() function)?
 soumya997
on 13 Nov 2020
soumya997
on 13 Nov 2020
@MarcSkovMadsen, Great code, any thoughts on adding an image to a cell with the code you've written. Tried
<img src="path">in the markdown grid cell but that did not work.The following function did the trick for my needs:
def image(self, image_path, width = "150px",height = "200px",caption = ""):
        data_uri = base64.b64encode(open(image_path, 'rb').read()).decode('utf-8')
        img_tag = '<br><figure ><center><img src="data:image/png;base64,{0}" width={2} height={3} ><figcaption>{1}</figcaption></center></figure>'.format((data_uri,caption,width,height))
        self.inner_html =  """<body>{0}</body>""".format(img_tag)
This feature would be very useful on streamlit, but the code kindly shared by @MarcSkovMadsen is doing the trick so far.
@rodrigoxrma what to pass in
self(of this image() function)?
The method I suggested goes inside the Cell class, so self refers to its instance in the code. It enables this method to update the value of the attribute inner_html of the class.
rodrigoxrma
on 14 Nov 2020
Related issues
 Code4SAFrankie
·
31Comments
Code4SAFrankie
·
31Comments
 DylanModesitt
·
16Comments
DylanModesitt
·
16Comments
 blester125
·
34Comments
tvst
·
24Comments
tvst
·
21Comments
blester125
·
34Comments
tvst
·
24Comments
tvst
·
21Comments
Most helpful comment
This looks pretty good, any updates on the plan for Streamlit to add in this feature?