Stars: Error in CPL_read_gdal(x, options, driver, read_data, NA_value) : negative length vectors are not allowed
I am getting the error in the title when trying to open a 450MB NetCDF file which was created with gdal_translate. What is causing it?
Here is the description of the file:
read_stars_meta
read_stars_meta("DEM20.nc")
$filename
[1] "/home/afantini/places/clima-archive/flood/DEM/PCN_IT_DEM/DEM20.nc"

$driver
[1] "netCDF"                     "Network Common Data Format"

$cols
[1]     1 52281

$rows
[1]     1 67098

$bands
[1] 1 1

$proj_wkt
[1] "PROJCS[\"UTM Zone 32, Northern Hemisphere\",GEOGCS[\"WGS 84\",DATUM[\"WGS_1984\",SPHEROID[\"WGS 84\",6378137,298.257223563,AUTHORITY[\"EPSG\",\"7030\"]],AUTHORITY[\"EPSG\",\"6326\"]],PRIMEM[\"Greenwich\",0,AUTHORITY[\"EPSG\",\"8901\"]],UNIT[\"degree\",0.0174532925199433,AUTHORITY[\"EPSG\",\"9122\"]],AUTHORITY[\"EPSG\",\"4326\"]],PROJECTION[\"Transverse_Mercator\"],PARAMETER[\"latitude_of_origin\",0],PARAMETER[\"central_meridian\",9],PARAMETER[\"scale_factor\",0.9996],PARAMETER[\"false_easting\",500000],PARAMETER[\"false_northing\",0],UNIT[\"METERS\",1]]"

$proj4string
[1] "+proj=utm +zone=32 +datum=WGS84 +units=m +no_defs "

$geotransform
[1]  309908.1      20.0       0.0 5271300.4       0.0     -20.0

$datatype
[1] "Int16"

$sub
[1] NA

$meta
 [1] "Band1#grid_mapping=transverse_mercator"
 [2] "Band1#long_name=GDAL Band Number 1"
 [3] "Band1#_FillValue=-32768"
 [4] "NC_GLOBAL#Conventions=CF-1.5"
 [5] "NC_GLOBAL#GDAL=GDAL 2.1.0, released 2016/04/25"
 [6] "NC_GLOBAL#history=Fri May 05 11:47:09 2017: GDAL CreateCopy( /home/netapp-clima-users1/afantini/DEM20.nc, ... )"
 [7] "transverse_mercator#false_easting=500000"
 [8] "transverse_mercator#false_northing=0"
 [9] "transverse_mercator#GeoTransform=309908.1464839161 20 0 5271300.41447363 0 -20 "
[10] "transverse_mercator#grid_mapping_name=transverse_mercator"
[11] "transverse_mercator#inverse_flattening=298.257223563"
[12] "transverse_mercator#latitude_of_projection_origin=0"
[13] "transverse_mercator#longitude_of_central_meridian=9"
[14] "transverse_mercator#longitude_of_prime_meridian=0"
[15] "transverse_mercator#long_name=CRS definition"
[16] "transverse_mercator#scale_factor_at_central_meridian=0.9996"
[17] "transverse_mercator#semi_major_axis=6378137"
[18] "transverse_mercator#spatial_ref=PROJCS[\"UTM Zone 32, Northern Hemisphere\",GEOGCS[\"WGS 84\",DATUM[\"WGS_1984\",SPHEROID[\"WGS 84\",6378137,298.257223563,AUTHORITY[\"EPSG\",\"7030\"]],AUTHORITY[\"EPSG\",\"6326\"]],PRIMEM[\"Greenwich\",0,AUTHORITY[\"EPSG\",\"8901\"]],UNIT[\"degree\",0.0174532925199433,AUTHORITY[\"EPSG\",\"9122\"]],AUTHORITY[\"EPSG\",\"4326\"]],PROJECTION[\"Transverse_Mercator\"],PARAMETER[\"latitude_of_origin\",0],PARAMETER[\"central_meridian\",9],PARAMETER[\"scale_factor\",0.9996],PARAMETER[\"false_easting\",500000],PARAMETER[\"false_northing\",0],UNIT[\"METERS\",1]]"
[19] "x#long_name=x coordinate of projection"
[20] "x#standard_name=projection_x_coordinate"
[21] "x#units=m"
[22] "y#long_name=y coordinate of projection"
[23] "y#standard_name=projection_y_coordinate"
[24] "y#units=m"

$band_meta
$band_meta[[1]]
[1] "grid_mapping=transverse_mercator" "long_name=GDAL Band Number 1"
[3] "NETCDF_VARNAME=Band1"             "_FillValue=-32768"


$units
[1] NA

$point
[1] NA

attr(,"dims")
    x     y bands
52281 67098     1
attr(,"file_names")
[1] "/home/afantini/places/clima-archive/flood/DEM/PCN_IT_DEM/DEM20.nc"
attr(,"dimensions")
      from    to   offset delta                       refsys point values
x        1 52281 309908.1    20 +proj=utm +zone=32 +datum...    NA   NULL
y        1 67098  5271300   -20 +proj=utm +zone=32 +datum...    NA   NULL
bands    1     1       NA    NA                           NA    NA   NULL
attr(,"class")
[1] "stars_meta"
gdalinfo
gdalinfo DEM20.nc
Driver: netCDF/Network Common Data Format
Files: DEM20.nc
Size is 52281, 67098
Coordinate System is:
PROJCS["UTM Zone 32, Northern Hemisphere",
    GEOGCS["WGS 84",
        DATUM["WGS_1984",
            SPHEROID["WGS 84",6378137,298.257223563,
                AUTHORITY["EPSG","7030"]],
            AUTHORITY["EPSG","6326"]],
        PRIMEM["Greenwich",0,
            AUTHORITY["EPSG","8901"]],
        UNIT["degree",0.0174532925199433,
            AUTHORITY["EPSG","9122"]],
        AUTHORITY["EPSG","4326"]],
    PROJECTION["Transverse_Mercator"],
    PARAMETER["latitude_of_origin",0],
    PARAMETER["central_meridian",9],
    PARAMETER["scale_factor",0.9996],
    PARAMETER["false_easting",500000],
    PARAMETER["false_northing",0],
    UNIT["METERS",1]]
Origin = (309908.146483916090801,5271300.414473630487919)
Pixel Size = (20.000000000000000,-20.000000000000000)
Metadata:
  Band1#grid_mapping=transverse_mercator
  Band1#long_name=GDAL Band Number 1
  Band1#_FillValue=-32768
  NC_GLOBAL#Conventions=CF-1.5
  NC_GLOBAL#GDAL=GDAL 2.1.0, released 2016/04/25
  NC_GLOBAL#history=Fri May 05 11:47:09 2017: GDAL CreateCopy( /home/netapp-clima-users1/afantini/DEM20.nc, ... )
  transverse_mercator#false_easting=500000
  transverse_mercator#false_northing=0
  transverse_mercator#GeoTransform=309908.1464839161 20 0 5271300.41447363 0 -20
  transverse_mercator#grid_mapping_name=transverse_mercator
  transverse_mercator#inverse_flattening=298.257223563
  transverse_mercator#latitude_of_projection_origin=0
  transverse_mercator#longitude_of_central_meridian=9
  transverse_mercator#longitude_of_prime_meridian=0
  transverse_mercator#long_name=CRS definition
  transverse_mercator#scale_factor_at_central_meridian=0.9996
  transverse_mercator#semi_major_axis=6378137
  transverse_mercator#spatial_ref=PROJCS["UTM Zone 32, Northern Hemisphere",GEOGCS["WGS 84",DATUM["WGS_1984",SPHEROID["WGS 84",6378137,298.257223563,AUTHORITY["EPSG","7030"]],AUTHORITY["EPSG","6326"]],PRIMEM["Greenwich",0,AUTHORITY["EPSG","8901"]],UNIT["degree",0.0174532925199433,AUTHORITY["EPSG","9122"]],AUTHORITY["EPSG","4326"]],PROJECTION["Transverse_Mercator"],PARAMETER["latitude_of_origin",0],PARAMETER["central_meridian",9],PARAMETER["scale_factor",0.9996],PARAMETER["false_easting",500000],PARAMETER["false_northing",0],UNIT["METERS",1]]
  x#long_name=x coordinate of projection
  x#standard_name=projection_x_coordinate
  x#units=m
  y#long_name=y coordinate of projection
  y#standard_name=projection_y_coordinate
  y#units=m
Corner Coordinates:
Upper Left  (  309908.146, 5271300.414) (  6d28'21.68"E, 47d34' 2.15"N)
Lower Left  (  309908.146, 3929340.414) (  6d54'15.98"E, 35d29'21.97"N)
Upper Right ( 1355528.146, 5271300.414) ( 20d15'59.73"E, 47d 2'15.85"N)
Lower Right ( 1355528.146, 3929340.414) ( 18d22'39.42"E, 35d 8'32.39"N)
Center      (  832718.146, 4600320.414) ( 12d59' 6.49"E, 41d29' 7.62"N)
Band 1 Block=52281x1 Type=Int16, ColorInterp=Undefined
  NoData Value=-32768
  Metadata:
    grid_mapping=transverse_mercator
    long_name=GDAL Band Number 1
    NETCDF_VARNAME=Band1
    _FillValue=-32768
ncdump
ncdump -h DEM20.nc
netcdf DEM20 {
dimensions:
        x = 52281 ;
        y = 67098 ;
variables:
        char transverse_mercator ;
                transverse_mercator:grid_mapping_name = "transverse_mercator" ;
                transverse_mercator:longitude_of_central_meridian = 9. ;
                transverse_mercator:false_easting = 500000. ;
                transverse_mercator:false_northing = 0. ;
                transverse_mercator:latitude_of_projection_origin = 0. ;
                transverse_mercator:scale_factor_at_central_meridian = 0.9996 ;
                transverse_mercator:long_name = "CRS definition" ;
                transverse_mercator:longitude_of_prime_meridian = 0. ;
                transverse_mercator:semi_major_axis = 6378137. ;
                transverse_mercator:inverse_flattening = 298.257223563 ;
                transverse_mercator:spatial_ref = "PROJCS[\"UTM Zone 32, Northern Hemisphere\",GEOGCS[\"WGS 84\",DATUM[\"WGS_1984\",SPHEROID[\"WGS 84\",6378137,298.257223563,AUTHORITY[\"EPSG\",\"7030\"]],AUTHORITY[\"EPSG\",\"6326\"]],PRIMEM[\"Greenwich\",0,AUTHORITY[\"EPSG\",\"8901\"]],UNIT[\"degree\",0.0174532925199433,AUTHORITY[\"EPSG\",\"9122\"]],AUTHORITY[\"EPSG\",\"4326\"]],PROJECTION[\"Transverse_Mercator\"],PARAMETER[\"latitude_of_origin\",0],PARAMETER[\"central_meridian\",9],PARAMETER[\"scale_factor\",0.9996],PARAMETER[\"false_easting\",500000],PARAMETER[\"false_northing\",0],UNIT[\"METERS\",1]]" ;
                transverse_mercator:GeoTransform = "309908.1464839161 20 0 5271300.41447363 0 -20 " ;
        double x(x) ;
                x:standard_name = "projection_x_coordinate" ;
                x:long_name = "x coordinate of projection" ;
                x:units = "m" ;
        double y(y) ;
                y:standard_name = "projection_y_coordinate" ;
                y:long_name = "y coordinate of projection" ;
                y:units = "m" ;
        short Band1(y, x) ;
                Band1:long_name = "GDAL Band Number 1" ;
                Band1:_FillValue = -32768s ;
                Band1:grid_mapping = "transverse_mercator" ;

// global attributes:
                :Conventions = "CF-1.5" ;
                :GDAL = "GDAL 2.1.0, released 2016/04/25" ;
                :history = "Fri May 05 11:47:09 2017: GDAL CreateCopy( /home/netapp-clima-users1/afantini/DEM20.nc, ... )" ;
}
 adrfantini
All 26 comments
Unfortunately I cannot provide the example file due to its size. If I crop it with NCO's ncks to a small size then I can read it without problems.
adrfantini
on 25 Aug 2018
Not having tried, I suspect this is because
> 52281 * 67098 > .Machine$integer.max
[1] TRUE
although matrices can have this size:
> m = matrix(1.0, 52281, 67098)
> object.size(m)
28063604520 bytes
I tried creating a test file with the same property with
> library(raster)
Loading required package: sp
> r = raster(nrows = 2^15+1, ncols = 2^16)
> values(r) = 1
but
> writeRaster(r, "r.tif")
Error in var(if (is.vector(x) || is.factor(x)) x else as.double(x), na.rm = na.rm) :
  long vectors not supported yet: ../../../include/Rinlinedfuns.h:519
so if you could point me to a very large raster that'd be helpful.
Would it help you if you could read portions of it, or the same file at lower resolution?
 edzer
on 25 Aug 2018
edzer
on 25 Aug 2018
I got the file from here:
http://www.sinanet.isprambiente.it/it/sia-ispra/download-mais/dem20/at_download/file
Then trasformed to NetCDF like so:
gdal_translate -of NETCDF dtm_20m_32/w001001.adf DEM20.nc
I can upload it somewhere if you want.
EDIT: uploading, will take a while, my network here is not the best.
adrfantini
on 26 Aug 2018
It's here:
https://drive.google.com/file/d/1ey7x66OCPWp0BG0EJlihmHuc674waebF/view?usp=sharing
Would you let me know when you downloaded it, so I can delete it? Thanks.
adrfantini
on 26 Aug 2018
Thanks, got it!
edzer
on 26 Aug 2018
Note that
library(stars)
r = read_stars("dem20/dtm_20m_32/w001001.adf")
takes seconds, whereas reading the NetCDF files takes ages. We observed this before: I'm not sure whether this is due to the NetCDF gdal driver, or to the way stars uses it.
edzer
on 26 Aug 2018
I still get the same error when reading both versions, despite updating; I am at SHA1 bcb11661 which according to devtools is the last version.
adrfantini
on 26 Aug 2018
Oh I have to update sf, not stars! Will do so.
EDIT: well I guess I'll need to find a machine with 32GB of RAM:
Error: cannot allocate vector of size 26.1 Gb
adrfantini
on 26 Aug 2018
32 will be enough to read, but not to print a summary, or plot.
Does it help you to read this DEM at a lower resolution, or only a section of it?
edzer
on 26 Aug 2018
Reading smaller chunks, yes, it would help. That's something stars is going to need sooner or later, the ability to NOT read all the dataset at once (I feel like raster nails this).
In the case of NetCDF, this is enabled by chunking. The dataset in question, for example, has ChunkSizes = 1637, 1276 so reading smaller chunks should be very fast and convenient. I do not know how GDAL does this, if it's transparent or handled automatically or whatever.
As for resampling/resizing the dataset, that's also a nice idea. I would not have much use for it personally, but I can see it can have its uses.
adrfantini
on 26 Aug 2018
Could this a use-case for mapedit, where a very low res plot could be displayed and the user can draw a bbox to be read?
 tim-salabim
on 26 Aug 2018
tim-salabim
on 26 Aug 2018
It could! But I would see that more as an addon than as standard feature, tbh, for the following reasons:
- I think the raster approach to only read data on-demand is the right one.
- How would you propose to read the low-res plot? For NetCDF at least, there are no standards or limitations on the chunking (which by the way is not even supported in NetCDF3, only 4), and it's not uncommon to have datasets that are chunked in slices (that is, one single chunk). In this case reading time is the same if you are reading low-res (say one value each 10) or high-res (all values). So there is no single best strategy to adopt in this case
- Showing data on EPSG:3857 would necessarily need reprojecting which can be time consuming (or warping polygons which is even more time consuming).
adrfantini
on 26 Aug 2018
This was a bit more work than expected, but we can now e.g. do
library(stars)
# Loading required package: abind
# Loading required package: sf
# Linking to GEOS 3.6.2, GDAL 2.2.3, proj.4 4.9.3
pars = list(nXOff = 10000, nYOff = 10000, nXSize = 10000, nYSize = 10000)
(r = read_stars("dem20/dtm_20m_32/w001001.adf", RasterIO = pars))
# stars object with 2 dimensions and 1 attribute
# attribute(s), summary of first 1e+05 cells:
#   w001001.adf
#  Min.   :  65.0
#  1st Qu.: 350.0
#  Median : 651.0
#  Mean   : 746.7
#  3rd Qu.:1122.0
#  Max.   :1850.0
# dimension(s):
#    from    to  offset delta                       refsys point values
# x 10000 19999  309908    20 +proj=utm +zone=32 +datum...    NA   NULL
# y 10000 19999 5271300   -20 +proj=utm +zone=32 +datum...    NA   NULL
st_bbox(r)
#      xmin      ymin      xmax      ymax
#  509888.1 4871320.4  709888.1 5071320.4
png("/tmp/x1.png")
plot(r, axes = TRUE)

pars = list(nXOff = 10000, nYOff = 10000, nXSize = 10000, nYSize = 10000, nBufXSize = 100, nBufYSize = 100)
(r = read_stars("dem20/dtm_20m_32/w001001.adf", RasterIO = pars))
# stars object with 2 dimensions and 1 attribute
# attribute(s):
#   w001001.adf
#  Min.   :   0
#  1st Qu.:  38
#  Median : 130
#  Mean   : 320
#  3rd Qu.: 526
#  Max.   :2113
#  NA's   :225
# dimension(s):
#   from  to  offset delta                       refsys point values
# x  100 199  309908  2000 +proj=utm +zone=32 +datum...    NA   NULL
# y  100 199 5271300 -2000 +proj=utm +zone=32 +datum...    NA   NULL

st_bbox(r)
#      xmin      ymin      xmax      ymax
#  507908.1 4873300.4  707908.1 5073300.4
png("/tmp/x2.png")
plot(r, axes = TRUE)
Giving
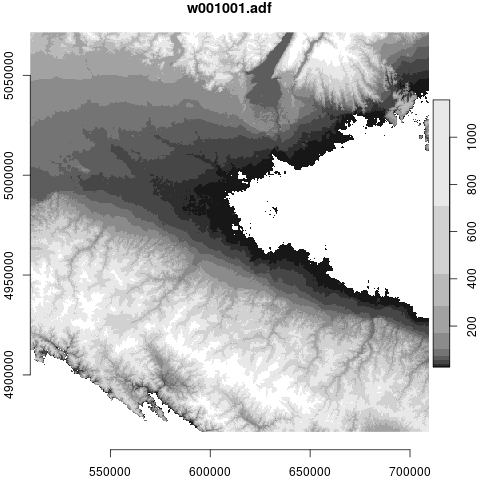
and
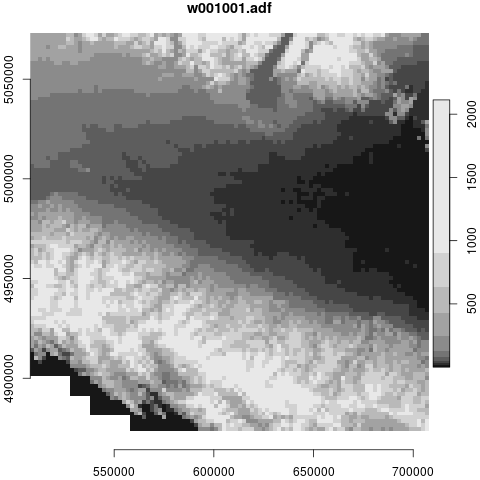
As the docs say: I'm not 100% sure the geotransform is correct after using nBufXSize/nBufYSize, as the GDAL source code seems the documentation here. @mdsumner
There's also something odd with the maximum value (how can it be larger when resampling?) and the absence of missing values in the Adriatic Sea.
edzer
on 27 Aug 2018
The interface seems very useful, but a bit complicated. I personally would very much prefer an interface in which I can first load a dataset (without reading data), see its dimensions, resolution etc, then crop / resize / whatever as needed (which is basically the raster approach). Why did you choose not to go this way, @edzer ? I can see it being quite a bit more complicated, but is there any design reason?
By the way, why is the whole eastern part of the Po Plain NA in the first picture? You are not reaching the Adriatic Sea there, it's still Plain. See https://upload.wikimedia.org/wikipedia/commons/f/f8/Italy_topographic_map-blank.svg
adrfantini
on 27 Aug 2018
It looks right to me, from some simple tests on the window and down (and up) sampling. I'll do some more careful comparisons.
@adrfantini the design is exactly matched to the underlying library interface, so it's perfect for putting R-level wrappers around. (rgdal enables it too, raster wrapped the crop part of that, though not the resizing part).
 mdsumner
on 27 Aug 2018
mdsumner
on 27 Aug 2018
Thanks, @mdsumner - in particular advice on how the geotransform is currently recalculated (offset, cellsize) based on nBuf?Size would be very helpful, see here.
@adrfantini indeed, this way we have 1:1 mapping to GDAL to help understanding what is going on, which is step one. Working out a stars_proxy, evolving from stars_meta would be next. And thanks for correcting my misunderstanding of the Po Plain!
edzer
on 27 Aug 2018
I see, thanks for the explanation! Are you still considering moving away from GDAL, at least for NetCDF?
Do you have any idea on why the values in the lower plain in that first picture seem to be NA?
adrfantini
on 27 Aug 2018
I see, thanks for the explanation! Are you still considering moving away from GDAL, at least for NetCDF?
not entirely moving away, since a lot of raster data doesn't come as NetCDF, but augmenting stars with direct NetCDF reading (w/o GDAL) is on the list.
Do you have any idea on why the values in the lower plain in that first picture seem to be NA?
No, tbd!
edzer
on 27 Aug 2018
I made a start on a more NetCDF-focussed approach and got further than I expected:
https://github.com/mdsumner/stars/blob/ncdf4/R/ncdf4.R
It'll be interesting to find a way to approach these together I think, GDAL is very different thinking from NetCDF. I haven't dealt with singleton dimension delta.
There are some quirky things about how I use ncmeta because I know what works for dimension order from battling with tidync - and I settled on habits rather than an in-built tool. It seems to be reliable, but it still confuses me.
mdsumner
on 27 Aug 2018
Yes, I did not mean to move away from GDAL entirely, but for NetCDF only.
NetCDF is tricky. It has so many possibilities. Some of them are extremely useful (such as chunking, compression, unlimited dimensions, strides), some are less (e.g. groups), and different versions and interfaces support different features.
Someone at Google EarthEngine once told me that they were late in supporting NetCDF because of how wide the possibilities are.
I guess limiting support to CF-compliant (or semi-compliant) files could be possible, maybe a good place to start from.
adrfantini
on 27 Aug 2018
Nice, @mdsumner ! It even reads @adrfantini netcdf file of #44 . It ignores the assumption that the x and y coordinates of rasters are called "x" and "y" (so plot won't work) but that is a good lesson ;-)
edzer
on 28 Aug 2018
I can't fault the geotransform subset/resampling logic, I've tried a bunch of different tests on real data and it's solid. (It needs out of bounds checkson the RasterIO params, and that's a bit complicated given when it has to happen).
I also don't see why you worry that it's approximate? (as per note in ?read_stars) The offset and size provides an exact extent from native geotransform, and then the pixel height and width is modified if the buffer output is different. (It's not going to be exact given some floating point issues in height/width values, but not enough to really change the extent in a noticeable way ever afaict).
mdsumner
on 11 Sep 2018
Thanks, that is encouraging!
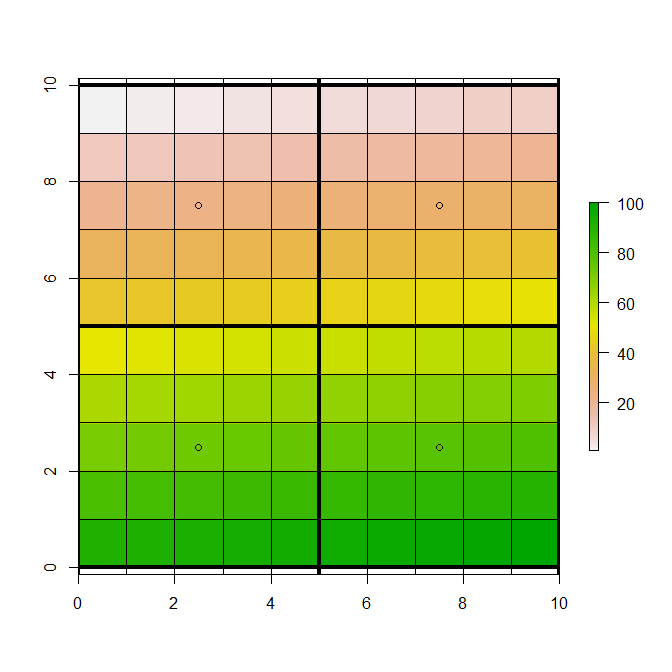
I am just not sure because there is a thing that's not documented, not provided by the API, and that I couldn't infer from reading the sources. It is this: If I have a 10 x 10 raster, and I want to read the whole raster in a 2 x 2 buffer, do I end up with cells (1,1), (1,6), (6,1), (6,6) or with cells (1,1), (1,10), (10,1), (10,10)? In the first case the cellsize is multiplied by (oldsize / newsize) = 5, in the second case by 9. I need to set up an simple test file to check it does the first (that's what stars now hard codes).
edzer
on 11 Sep 2018
I think about it as the location of the resampling points as derived from the target grid, here using raster for a test object and the NearestNeighbour method.
r <- raster(extent(0, 10, 0, 10), nrows = 10, ncols = 10)
r[] <- seq_len(ncell(r))
writeRaster(r, "out.tif")
st <- read_stars("out.tif", RasterIO = list(nXOff = 1, nYOff = 1, nXsize = 10, nYSize = 10, nBufXSize = 2, nBufYSize = 2))
st[[1]]
#      [,1] [,2]
# [1,]   23   73
# [2,]   28   78
plot(r)
abline(v = seq(0, 10, by = 1), h = seq(0, 10, by  = 1))
abline(v = seq(0, 10, by = 5), h = seq(0, 10, by = 5), lwd = 4)
points(xyFromCell(r, st[[1]]))
mdsumner
on 11 Sep 2018
Excellent, thanks! That was the example I needed; I will adapt the documentation.
> st
stars object with 2 dimensions and 1 attribute
attribute(s):
    out.tif
 Min.   :23.00
 1st Qu.:26.75
 Median :50.50
 Mean   :50.50
 3rd Qu.:74.25
 Max.   :78.00
dimension(s):
  from to offset delta refsys point values
x    1  2      0     5     NA    NA   NULL [x]
y    1  2     10    -5     NA    NA   NULL [y]
> st_as_sf(st)
Error in st_as_sfc.dimensions(st_dimensions(x)[r$dimensions], ..., as_points = as_points,  :
  as_points should be set to TRUE (`points') or FALSE (`polygons')
> st_as_sf(st, as_points=TRUE)
Simple feature collection with 4 features and 1 field
geometry type:  POINT
dimension:      XY
bbox:           xmin: 2.5 ymin: 2.5 xmax: 7.5 ymax: 7.5
epsg (SRID):    NA
proj4string:    NA
  out.tif        geometry
1      23 POINT (2.5 7.5)
2      28 POINT (7.5 7.5)
3      73 POINT (2.5 2.5)
4      78 POINT (7.5 2.5)
> st_as_sf(st, as_points=FALSE)
Simple feature collection with 4 features and 1 field
geometry type:  POLYGON
dimension:      XY
bbox:           xmin: 0 ymin: 0 xmax: 10 ymax: 10
epsg (SRID):    NA
proj4string:    NA
  out.tif                       geometry
1      23 POLYGON ((0 10, 5 10, 5 5, ...
2      28 POLYGON ((5 10, 10 10, 10 5...
3      73 POLYGON ((0 5, 5 5, 5 0, 0 ...
4      78 POLYGON ((5 5, 10 5, 10 0, ...
The examples in the docs (which deploy again!) are found here - I removed the Raster bits to avoid dependency on rgdal.
edzer
on 14 Sep 2018
Related issues
 courtiol
·
15Comments
courtiol
·
15Comments
 dblodgett-usgs
·
13Comments
dblodgett-usgs
·
13Comments
 noamross
·
10Comments
noamross
·
10Comments
 michaeldorman
·
4Comments
michaeldorman
·
11Comments
michaeldorman
·
4Comments
michaeldorman
·
11Comments