Sktime: [BUG] plot_series inconsistent date/time index
Describe the bug
To Reproduce
y = load_airline()
y = y[:48]
fh=np.arange(1, 13)

y_train, y_test = temporal_train_test_split(y, test_size=len(fh))
plot_series(y_train, y_test, labels=["y_train", "y_test"]);
print(y.shape, y_train.shape[0], y_test.shape[0])
print(y.index)
(48,) 36 12
PeriodIndex(['1949-01', '1949-02', '1949-03', '1949-04', '1949-05', '1949-06',
'1949-07', '1949-08', '1949-09', '1949-10', '1949-11', '1949-12',
'1950-01', '1950-02', '1950-03', '1950-04', '1950-05', '1950-06',
'1950-07', '1950-08', '1950-09', '1950-10', '1950-11', '1950-12',
'1951-01', '1951-02', '1951-03', '1951-04', '1951-05', '1951-06',
'1951-07', '1951-08', '1951-09', '1951-10', '1951-11', '1951-12',
'1952-01', '1952-02', '1952-03', '1952-04', '1952-05', '1952-06',
'1952-07', '1952-08', '1952-09', '1952-10', '1952-11', '1952-12'],
dtype='period[M]', name='Period', freq='M')
Expected behavior
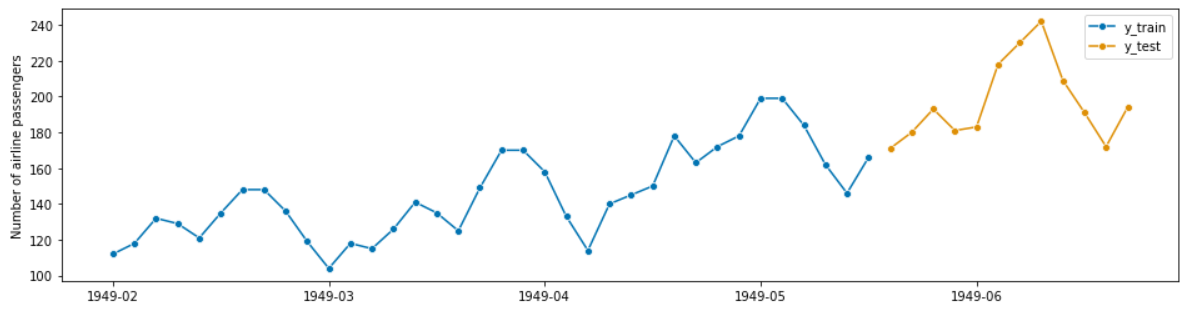
The X-axis should go till end of 1952. The X-axis on the plot does not reflect the indices correctly. It should go till 1952, but shows values only till 1949
Versions
System:
python: 3.6.12 |Anaconda, Inc.| (default, Sep 9 2020, 00:29:25) [MSC v.1916 64 bit (AMD64)]
executable: C:\Users\xxxx\AppData\Local\Continuum\anaconda3envs\sktime\python.exe
machine: Windows-10-10.0.18362-SP0
Python dependencies:
pip: 20.3
setuptools: 49.6.0
sklearn: 0.23.2
numpy: 1.19.2
scipy: 1.5.2
Cython: 0.29.17
pandas: 1.1.3
matplotlib: 3.3.2
joblib: 0.17.0
numba: None
pmdarima: 1.7.1
tsfresh: None
 ngupta23
All 8 comments
Thanks for raising the issue @ngupta23 - looks like internally something goes wrong when merging the indices from y_train and y_test.
 mloning
on 2 Dec 2020
mloning
on 2 Dec 2020
I can try to fix this!
 gracewgao
on 11 Dec 2020
gracewgao
on 11 Dec 2020
@gracewgao that would be awesome! I noticed that integer indices also seem a bit off. Let me know if you need any help.
mloning
on 11 Dec 2020
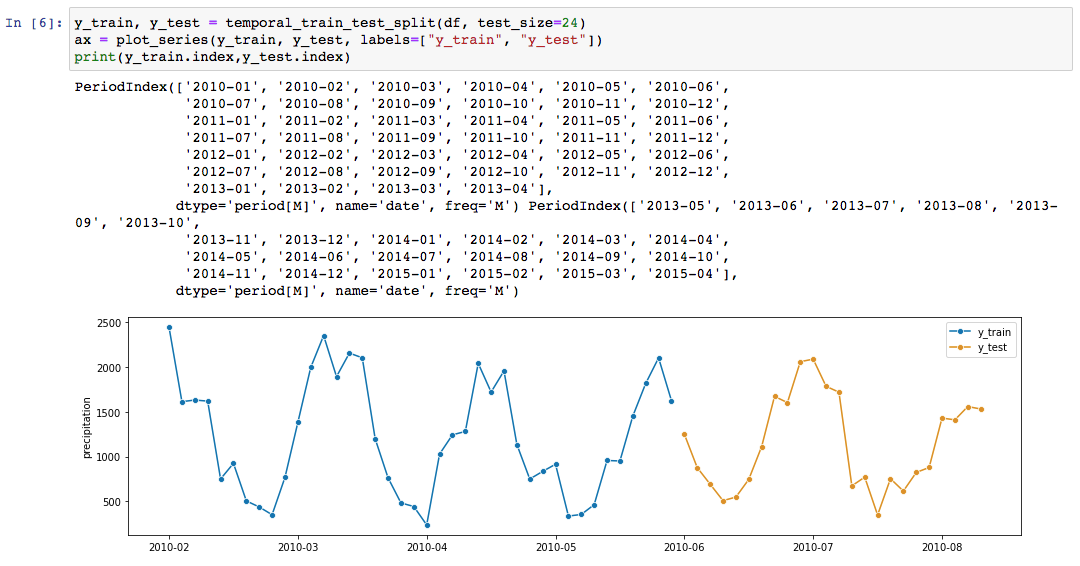
I have a similar issue appearing in 0.5.2.
Python 3.8
Mac OS
import sktime
sktime.__version__

# returns '0.5.2'
 wolfiex
on 15 Jan 2021
wolfiex
on 15 Jan 2021
thanks @wolfiex for posting it here
mloning
on 15 Jan 2021
If you're interested in looking into this, I'd appreciate a PR!
mloning
on 15 Jan 2021
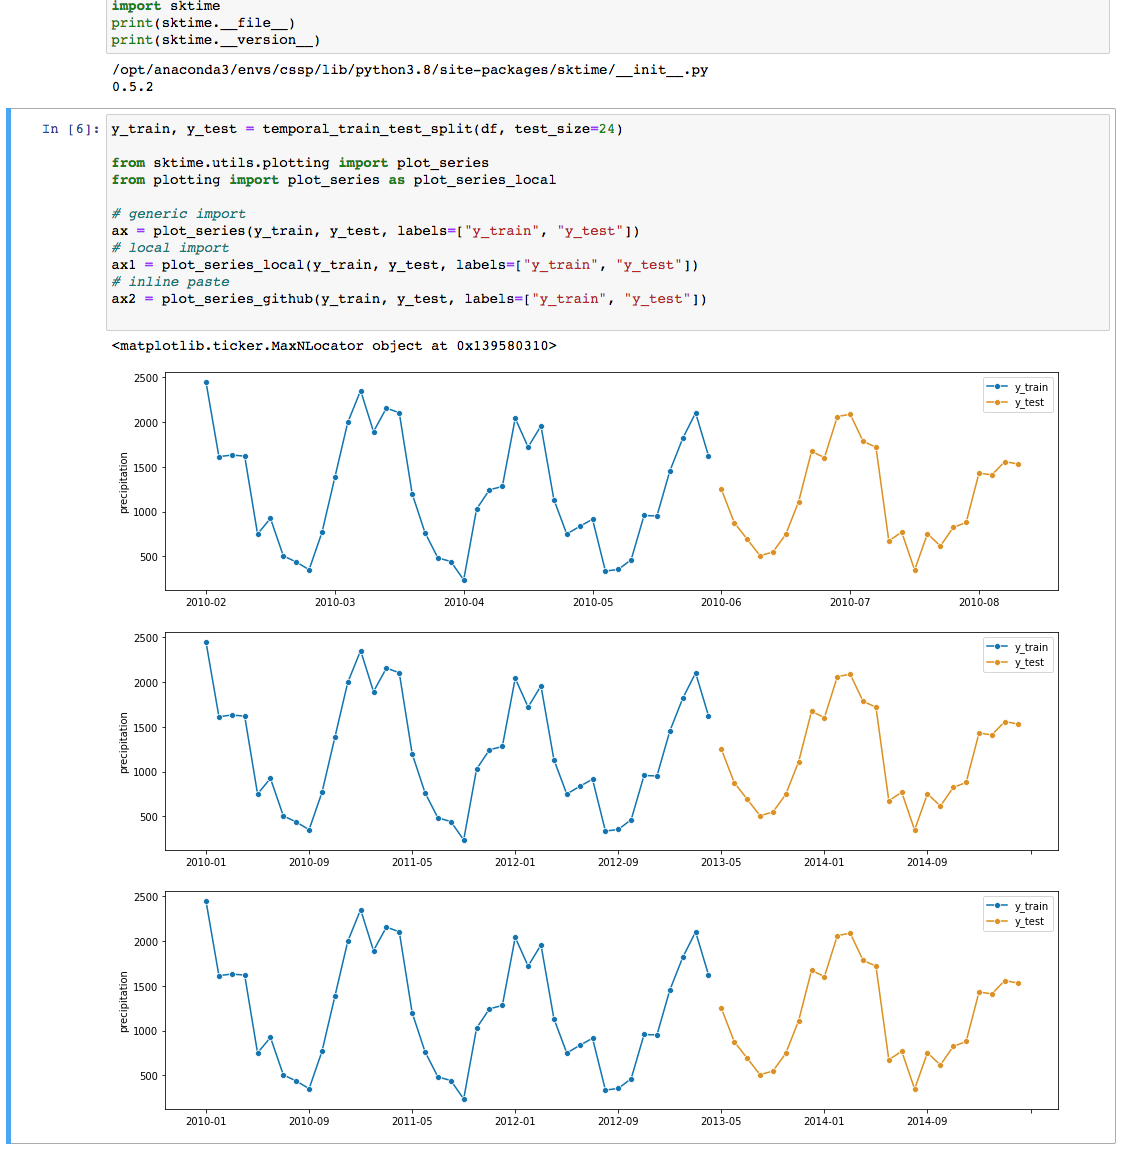
@mloning I just checked the files, and apart from two lines of whitespace (likely my editor), the two files are identical! It seems that something is going wrong when importing the function from the conda install. This does not appear to be the case with a local import of the file or an inline paste of the code.
The first is imported as from sktime.utils.plotting import plot_series whereas the second (plot_series_local) is a local copy of the plotting.py file within the utils folder which has been placed within my project folder. The third (plot_series_github) is an inline paste of the same fine). All files are identical per verbatim.
- very peculiar.
wolfiex
on 15 Jan 2021
@wolfiex very strange, so only the conda version is broken?
mloning
on 18 Jan 2021
Related issues
ngupta23
·
7Comments
mloning
·
9Comments
 isma3ilsamir
·
7Comments
isma3ilsamir
·
7Comments
 azev77
·
8Comments
azev77
·
8Comments
 big-o
·
6Comments
big-o
·
6Comments