Shap: Census Income Classification with LightGBM not reproducible - "TypeError: list indices must be integers or slices, not tuple" error
First, thanks Scott for this valuable library and your active feedback. I am trying to learn how to apply shap library in binary classifiers. I have tried to follow step by step the notebook that appears in the documentation [https://slundberg.github.io/shap/notebooks/Census%20income%20classification%20with%20LightGBM.html called "_Census Income Classification with LightGBM_" but have found an error after simply executing the jupyter notebook line-by-line

. It prints:
"TypeError: list indices must be integers or slices, not tuple".
A screenshot of my notebook and a copy of it https://drive.google.com/file/d/1PwOts0RVjEjZfzRYIJ_HBRdrccnu6H8j/view?usp=sharing is attached in this issue.
I believe this issue is related with and the fact that before LightGBM outputted a 1D object and now it is 2D. I wonder if you guys could help me in how to modify the call to these lines in order to obtain the plots in the documentation of the library:
explainer = shap.TreeExplainer(model)
shap_values = explainer.shap_values(X)
shap.force_plot(explainer.expected_value, shap_values[0,:], X_display.iloc[0,:])
Or simply updating the notebook so that it could be 100% reproducible to other users of your library. Thanks in advance for all the resources. P.D. I would kindly provide a .ipynb fixed notebook if I knew how to obtain the mentioned outputs and am looking forward to help contributing to this tool.
 quantumds
All 5 comments
Thanks for pointing this out! It was fixed in the ipynb version but not the HTML version. I have now updated the html version as well (which shows how it should be run with two outputs now).
 slundberg
on 9 Oct 2019
slundberg
on 9 Oct 2019
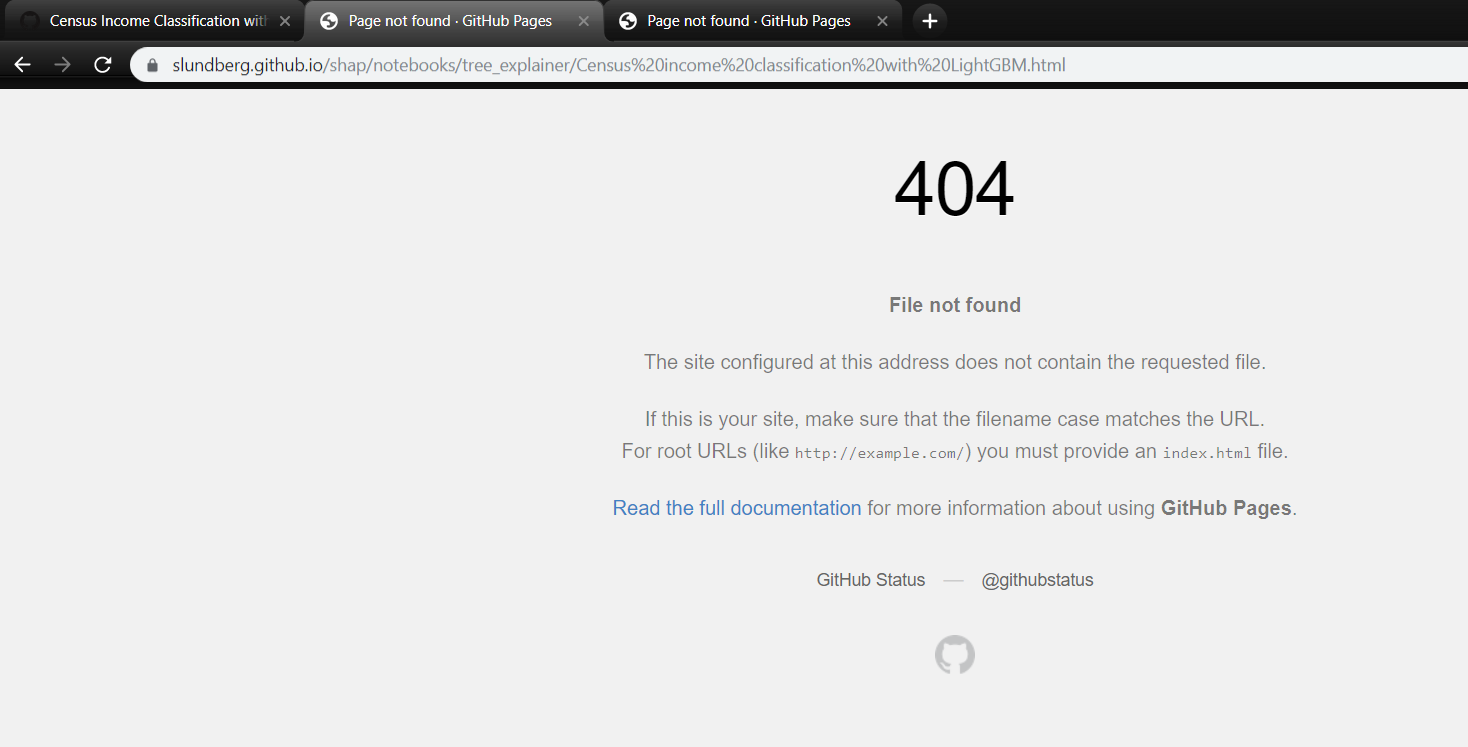
Hi Scott, I have just tried the link that appears in the shap library website with the jupyter notebook: [https://slundberg.github.io/shap/notebooks/tree_explainer/Census%20income%20classification%20with%20LightGBM.html] and it is broken. It gives the following mistake: "_404. File not found_". Thanks for your answer and appreciate a lot if you can make accessible the notebook with the correct outputs! Thanks!

quantumds
on 10 Oct 2019
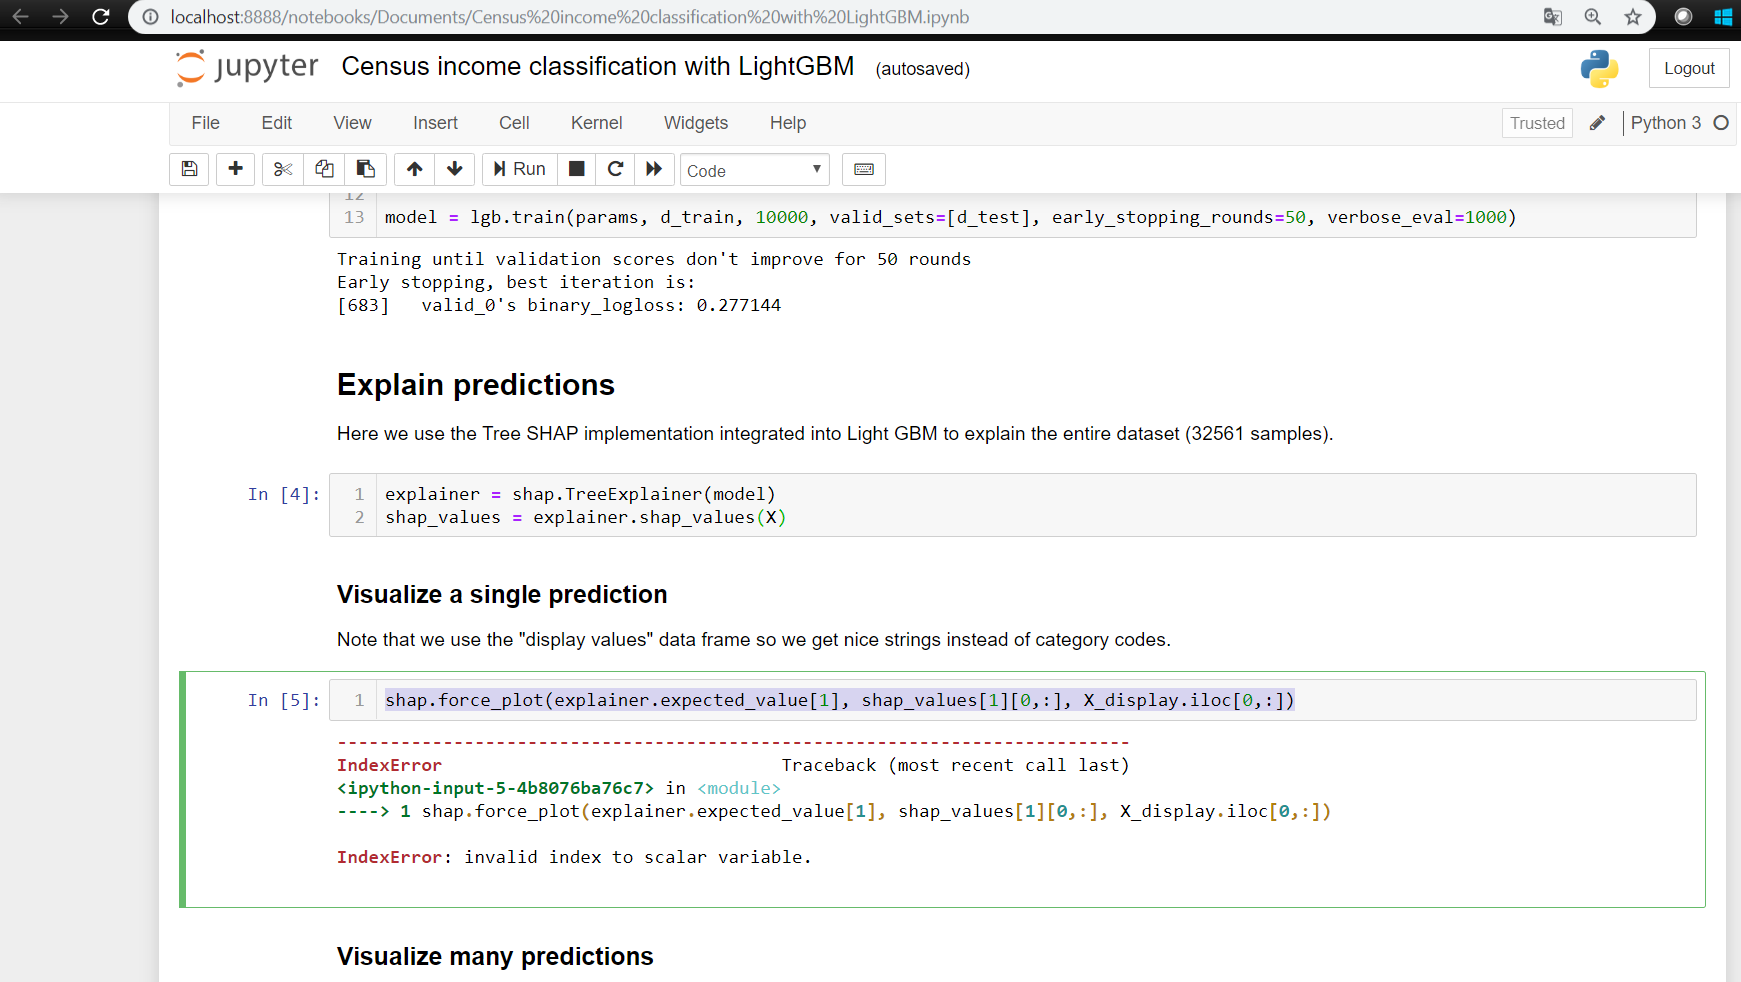
Hi Scott, one more thing. I have gone to your GitHub repo and selected the jupyter notebook that you updated. It runs perfectly well until the line of the force_plot: shap.force_plot(explainer.expected_value[1], shap_values[1][0,:], X_display.iloc[0,:])
From there it crashes in following lines. I am attaching an image of the message that I receive in the new jupyter notebook that I have downloaded from your shap repo.
Thanks for all your help and support Scott.
quantumds
on 10 Oct 2019
Thanks! I fixed the broken link. As for the error you get though, I can't reproduce it. Do you have the most recent version of shap?
slundberg
on 23 Oct 2019
Epic Scott! Everything solved. Thanks a lot for your feedback and work!
quantumds
on 23 Oct 2019
Related issues
 Nithanaroy
·
4Comments
Nithanaroy
·
4Comments
 resdntalien
·
3Comments
resdntalien
·
3Comments
 shoaibkhanz
·
4Comments
Nithanaroy
·
4Comments
shoaibkhanz
·
4Comments
Nithanaroy
·
4Comments
 nickkimer
·
4Comments
nickkimer
·
4Comments