import shap

def critical_factors(data_for_prediction):
    shap.initjs()
    background = X_train.iloc[0:100,:].values.astype('float')
    explainer = shap.DeepExplainer(model, background)
    shap_values = explainer.shap_values(data_for_prediction)
    shap.force_plot(explainer.expected_value[0], shap_values[0], data_for_prediction)

critical_factors( X_test.iloc[0:1,:].values.astype('float') )
Just shows a hexagon with JS symbol in it. No plot is visible in the Jupyter Notebook. Do I need to initialize something else?
 Nithanaroy
All 4 comments
Looks like defining a function was the problem. The below works fine. It would be useful to mention this in the README or documentation.
shap.initjs()
data_for_prediction = X_test.iloc[0:1,:].values.astype('float')
background = X_train.iloc[0:100,:].values.astype('float')
explainer = shap.DeepExplainer(model, background)
shap_values = explainer.shap_values(data_for_prediction)
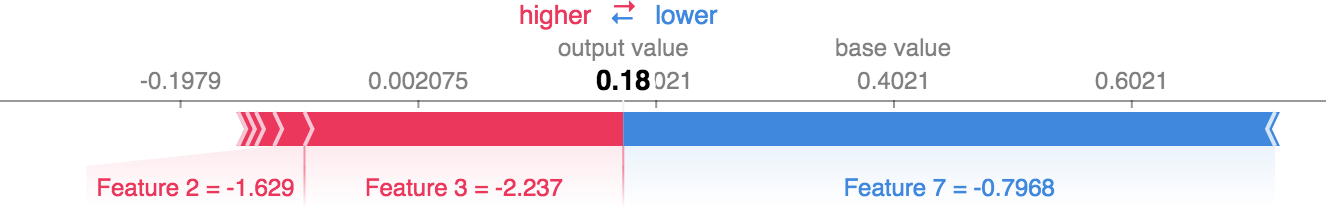
shap.force_plot(explainer.expected_value[0], shap_values[0], data_for_prediction)
However, the plot looses names of the features due to values() of Pandas. How to achieve the same using a DataFrame so that feature names are also visible in the plot?
Nithanaroy
on 1 Oct 2018
The Jupyter notebook only displays the HTML object returned by force_plot because it is the final return value of the last statement in the block. So if you add return to the last statement in the function it should work.
 slundberg
on 2 Oct 2018
slundberg
on 2 Oct 2018
@slundberg Could you please answer my second comment. Thank you.
Nithanaroy
on 2 Oct 2018
Ah, missed that one. You can just use the feature_names keyword argument to force_plot. It accepts a list of feature names (of the same length as shap_values.shape[1]).
slundberg
on 2 Oct 2018
Related issues
 SSMK-wq
·
4Comments
SSMK-wq
·
4Comments
 nickkimer
·
4Comments
Nithanaroy
·
4Comments
nickkimer
·
4Comments
Nithanaroy
·
4Comments
 cbeauhilton
·
3Comments
cbeauhilton
·
3Comments
 1vecera
·
3Comments
1vecera
·
3Comments
Most helpful comment
The Jupyter notebook only displays the HTML object returned by
force_plotbecause it is the final return value of the last statement in the block. So if you addreturnto the last statement in the function it should work.