Shap: SHAP values for single feature are all of one sign
Hello! Thanks for the great tool!
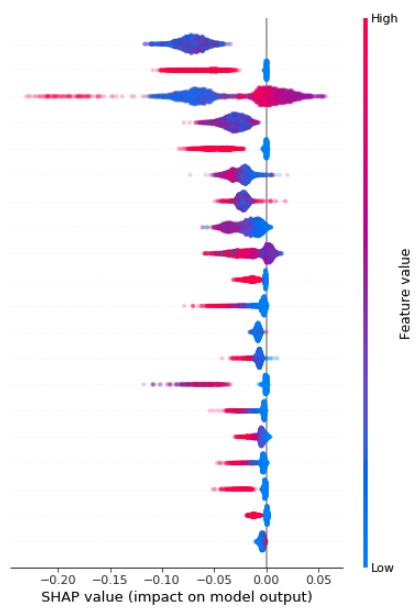
I have a question about the distribution of SHAP values for a single feature. The plot below shows that for the top feature, all SHAP values are of one sign (negative, in this case).
Some questions:
(a) Does a set of uniformly positive/negative values for a single feature even make sense, or is there some issue here in the way the baseline is being calculated? (E.g. we are calculating SHAP values for only a subset of our test set, as mentioned below.)
(b) If it does make sense, is the interpretation then that adding this feature to the model always reduces the model output — i.e. probability of positive class — regardless of the value of the feature?
I'm using a random forest model, and the values plotted here are for a holdout set of data. The explainer was instantiated just with the background data inferred from the RF model.
 vdrao
vdrao
All 9 comments
Sorry for the slow reply. That is odd to see only negative values for the top feature. It likely implies that the dataset you are explaining has a very different distribution for that feature than was in the training dataset. I would check and make sure that it indeed the case.
 slundberg
on 23 Apr 2019
slundberg
on 23 Apr 2019
Hi Slundberg,
We have created a decision tree model and calculated shap values of features. We understand that shap_values return a list of matrix of shapely values for each output. We wanted to understand in depth that how these values are being calculated/assigned to different features & observations. Is there any documentation on the same?
Thanks in advance
Ankit Bhatia
 ankit481991
on 23 Apr 2019
ankit481991
on 23 Apr 2019
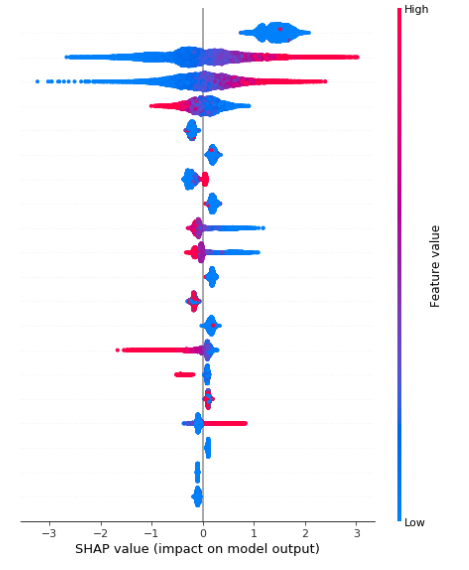
Hi @vdrao and @slundberg -- I'm seeing the exact same issue as described by @vdrao above, see the summary plot screenshot below. I am using a 10% sample of my training data (around 15k observations) to visualize the shap values for a binary prediction problem.
I did verify that the distribution for the problematic feature is identical to that of the larger training dataset. Any additional insight into why this might be happening?
A bit more info:
Let y be the target variable and z be the feature in question. z is a binary variable with low prevalence P(z = 1) = 0.018. However,
- P(y = 1 | z = 1) = 0.96
- P(y = 1 | z = 0) = 0.37
- P(y = 1 ) = 0.38
Thanks in advance for any help!
screenshot of summary plot:
 jhwetstone
on 25 Jul 2019
jhwetstone
on 25 Jul 2019
@jhwetstone is it possible to share an example notebook? If the feature is almost always 0 then observing 0 should have little impact.
slundberg
on 27 Jul 2019
@slundberg Unfortunately, this model is trained on a private dataset that I can't share -- what would you be looking for in the notebook? Is there any additional info that I can give you that would help you diagnose?
jhwetstone
on 29 Jul 2019
btw @slundberg just thought I should pop in, say hey, and mention that the dataset @jhwetstone is looking at is an Upstart dataset -- as unlikely as it seems based on our phone conversation, I'll shamelessly plug that we're still hiring if you decide to leave Seattle :)
 grantschneider
on 31 Jul 2019
grantschneider
on 31 Jul 2019
Likely reason why on this plot some features have only positive or only negative shap values is that dataset contains missing values or xgboost replaces zeroes to missing value.
 Onuchin-Artem
on 2 Oct 2019
Onuchin-Artem
on 2 Oct 2019
I had the same problem, then figured out that I had scaled my features before training and was plotting the graph on un-scaled features.
 courentin
on 2 Oct 2019
courentin
on 2 Oct 2019
Thanks so much @Onuchin-Artem -- that was 100% it. The model was trained on a sparse version of the training data, so the binary feature I was describing above had 0's replaced with missing values, and likely all tree splits were based on whether or not the feature was present. But I ran shap on a dense sample of the training data, so the values were 0/1 again, explaining the bizarre behavior!
Just re-trained the model on a dense version of the training data, and problems are resolved :)
 jesswetstone
on 2 Oct 2019
jesswetstone
on 2 Oct 2019
Related issues
 artemmavrin
·
4Comments
artemmavrin
·
4Comments
 cbeauhilton
·
3Comments
cbeauhilton
·
3Comments
 Nithanaroy
·
4Comments
Nithanaroy
·
4Comments
Nithanaroy
·
4Comments
Nithanaroy
·
4Comments
 gabrielcs
·
3Comments
gabrielcs
·
3Comments
Most helpful comment
Thanks so much @Onuchin-Artem -- that was 100% it. The model was trained on a sparse version of the training data, so the binary feature I was describing above had 0's replaced with missing values, and likely all tree splits were based on whether or not the feature was present. But I ran shap on a dense sample of the training data, so the values were 0/1 again, explaining the bizarre behavior!
Just re-trained the model on a dense version of the training data, and problems are resolved :)