Shap: Understanding XGBClassifier Results from Force_plot
So I have been working on understanding how this library works and interpretating results is somewhat confusing for me. You can look at the picture attached here. I first fitted a XGBClassifier with objective = "multi:softprob" and as you can see from the force_plot that I get a logit value of -0.69 indicating that the likelihood of the occurrence of class [0] is less and for the class [1] I get a logit value of 1.69 indicating a higher chance of its occurrence.
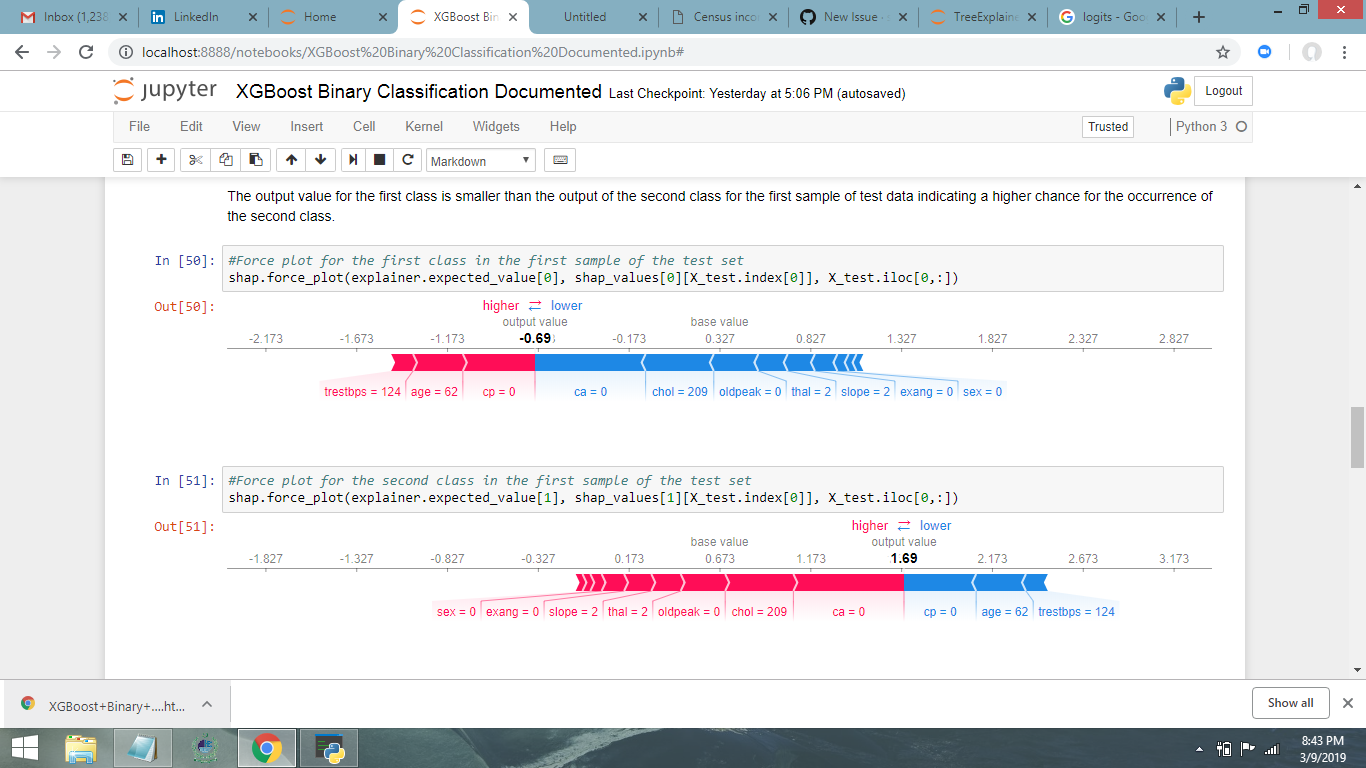
I am confused because as this is a binary classification problem I assumed that the logit value for the class[1] would be 0.69 instead of 1.69. If anyone can enlighten me about this it would be very helpful.
EDIT: Also when I use XGBClassifier(objective ="binary:logistic") and calculate the shap_values and expected values I only get the shap_values for the second class and the expected value for that as well. So how am I supposed to plot the force_plot for the first class for my classification task as I cant change the indexing of the first two arguments of the force_plot.
Thanks
Saad
 SaadAhmed96
All 8 comments
The softmax operator normalizes everything, so there is no need for things to be centered at 0. (note this observation doesn't really involve SHAP values since both those numbers are just the raw output from XGB)
 slundberg
on 11 Mar 2019
slundberg
on 11 Mar 2019
@slundberg thanks for the insight! One thing I noticed when I plotted force plot different examples in my test set is that when I sum the two classes output value is always equal to 1 which I can't understand. Is there any particular reason why their sum is always centered towards 1?
SaadAhmed96
on 12 Mar 2019
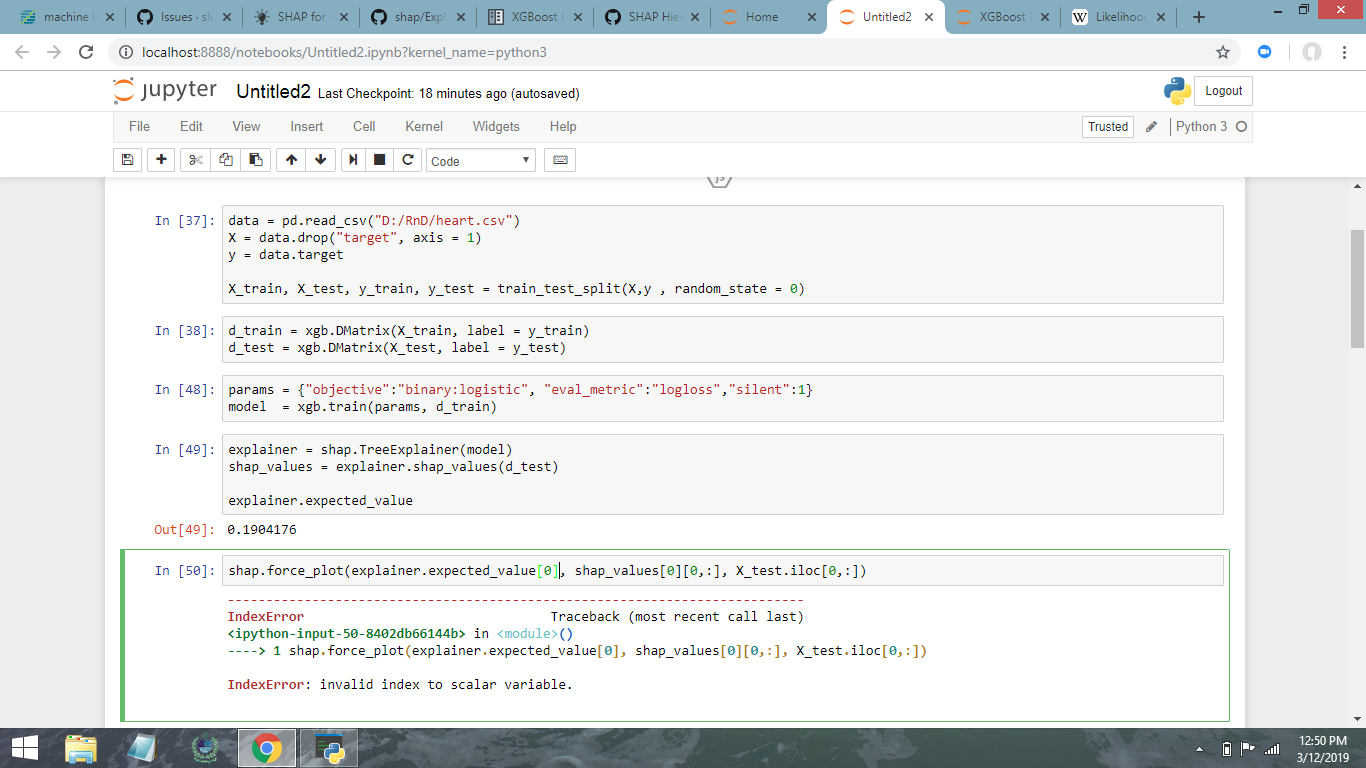
Also please look at the pic attached and let me know why I am only getting expected value for just one class and how am I supposed to know that this expected value is for the first class or the second. I know I am asking too many questions but kindly bear with me as I have recently started towards working on interpreting m.l models.
I also thought that I should be getting a list of size 2 with each element having size of (samples, features) but instead its just a single vector of size (samples, features).
Thanks
SaadAhmed96
on 12 Mar 2019
I also have the same issue as stated above using xgboost binary classifier, I only get a single list that seems to correspond to the first class (classes are 0,1)
 digivi13
on 1 Apr 2019
digivi13
on 1 Apr 2019
@SaadAhmed96 (sorry for the slow reply) and @digivi13 this is an artifact of how XGBoost deals with binary classifiers. Since XGBoost only outputs a single vector of numbers (for the "1" class"), so also SHAP only explains a single output. The probability for one class (or log odds) is determined by the probability of the other class. So that means a positive contribution towards class 0 is just as easily interpreted as a negative contribution towards class 1.
slundberg
on 2 Apr 2019
@slundberg I kind of figured that may be the case. It was also good to find out that the output is in log odds by default for xgboost models. Using link="logit" helped me get force plots with the proper probabilities. If this could also be done for summary and dependance plots, that would be awesome.
digivi13
on 2 Apr 2019
@digivi13 the reason we can use a link function for the force plot is because we have all the features together and so they add up to the actual output. In a dependence or summary plot we have taken just the impact of a feature all by itself, and this can't be transformed after-the-fact by just a scale change. If you want probabilities for everything then I would suggest using the model_output="probability" option of TreeExplainer.
slundberg
on 2 Apr 2019
That makes sense, thanks for the support on this library! I think this could be closed now based on your responses.
digivi13
on 2 Apr 2019
Related issues
 nickkimer
·
4Comments
nickkimer
·
4Comments
 gabrielcs
·
3Comments
gabrielcs
·
3Comments
 DiliSR
·
4Comments
DiliSR
·
4Comments
 GitAnalyst
·
3Comments
GitAnalyst
·
3Comments
 Nithanaroy
·
4Comments
Nithanaroy
·
4Comments
Most helpful comment
That makes sense, thanks for the support on this library! I think this could be closed now based on your responses.