I am a begginer and I am just starting to use sf package and I need to plot three layers: two polygons and one points.
All of them are class "sf" "data.frame" and all with the same coordination system: 4326.
When I try:
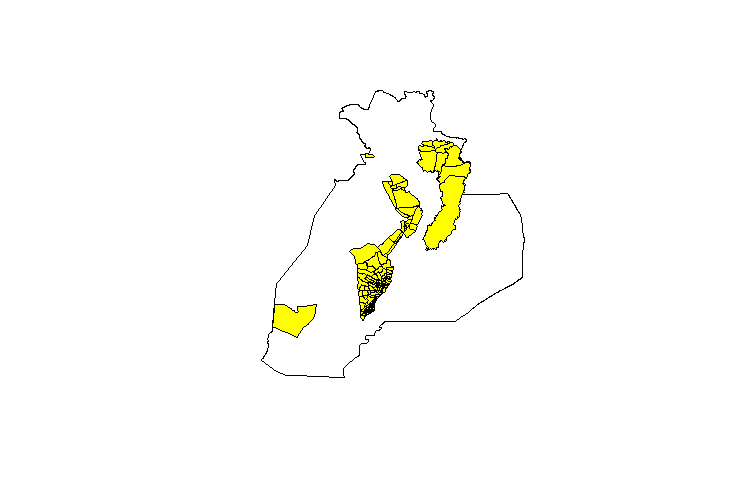
plot(district[0], fill = NULL, reset = FALSE)
plot(old[0], add = TRUE, col = "yellow")
plot(water["latrinebin"], add = TRUE)
Only the first and second one are plotted together, while the third one doesn't come out.
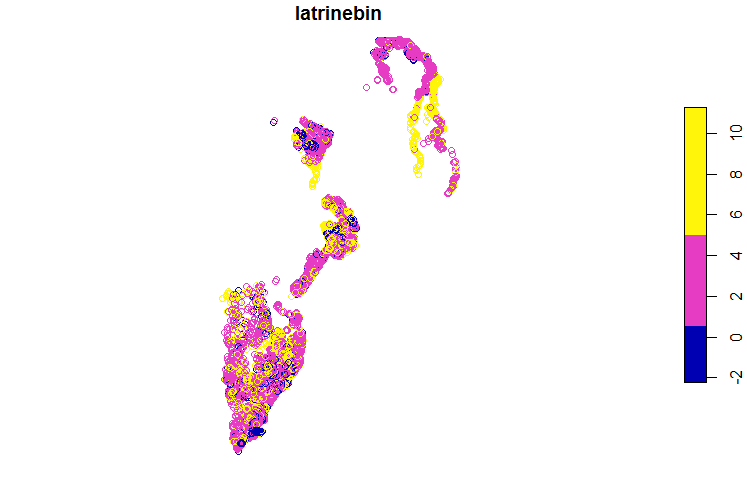
However, I can plot the third one alone with the same code:
plot(water["latrinebin"])
I also tried to use ggplot2 with geom_sf:
qqplot() +
   geom_sf(data = old)
And I am getting this error
_Error in sort(x) : argument "x" is missing, with no default_
Thanks for the help!
 bertagrau
All 6 comments
Have you tried setting reset = FALSE in the second plot call also?
 tim-salabim
on 7 Sep 2018
tim-salabim
on 7 Sep 2018
Thanks tim, for being so quick, it doesn't work either
bertagrau
on 7 Sep 2018
@tim-salabim could be the difference on +datum and +ellps the reason?
> st_crs(water)
Coordinate Reference System:
EPSG: 4326
proj4string: "+proj=longlat +ellps=WGS84 +no_defs"
> st_crs(old)
Coordinate Reference System:
EPSG: 4326
proj4string: "+proj=longlat +datum=WGS84 +no_defs"
> st_crs(district)
Coordinate Reference System:
EPSG: 4326
proj4string: "+proj=longlat +datum=WGS84 +no_defs"
bertagrau
on 7 Sep 2018
very likely yes!
This works:
library(sf)
library(mapview)

plot(st_geometry(franconia), fill = NULL, reset = FALSE)
plot(st_geometry(st_transform(trails, 4326)), add = TRUE, col = "yellow")
plot(breweries["founded"], add = TRUE)
Here, I transform trails to fit wtih the crs of the other two layers.
tim-salabim
on 7 Sep 2018
I did some tests on the different projections and plotting with plot() and geom_sf()
library(sf)
#> Linking to GEOS 3.6.1, GDAL 2.2.3, proj.4 4.9.3
library(mapview)
library(ggplot2)


# retrieve crs of objects
st_crs(franconia)
#> Coordinate Reference System:
#>   EPSG: 4326
#>   proj4string: "+proj=longlat +datum=WGS84 +no_defs"
st_crs(trails)
#> Coordinate Reference System:
#>   EPSG: 32632
#>   proj4string: "+proj=utm +zone=32 +datum=WGS84 +units=m +no_defs"
st_crs(breweries)
#> Coordinate Reference System:
#>   EPSG: 4326
#>   proj4string: "+proj=longlat +datum=WGS84 +no_defs"

# transform breweries to
breweries_t = st_transform(breweries,
                        crs = "+proj=longlat +ellps=WGS84 +no_defs")

st_crs(breweries_t)
#> Coordinate Reference System:
#>   EPSG: 4326
#>   proj4string: "+proj=longlat +ellps=WGS84 +no_defs"

# use base plot
plot(franconia[0], reset = FALSE)

plot(trails[0],
     col = "blue",
     add = TRUE)
# nothing added (trails in projected crs)

plot(st_transform(trails[0], crs = st_crs(franconia)),
     col = "orange",
     add = TRUE)

plot(breweries[0], add = TRUE)
plot(breweries_t[0], pch = 2, add = TRUE)

# missing datum information does not seem to break plot
# (possibly it assumes to be the "standard" datum +datum=WGS84)


# use ggplot2
gg_f = ggplot() +
  geom_sf(data = franconia, aes(fill = NUTS_ID), show.legend = FALSE)
gg_ft = gg_f +
  geom_sf(data = trails, colour = "orange")
gg_ftb = gg_ft +
  geom_sf(data = breweries_t,
          aes(colour = founded),
          show.legend = FALSE) +
  scale_colour_viridis_c(na.value = "black")

gg_ftb

# looks like geom_sf can transform projections on the fly (for trails) and
# can deal with the crs from breweries_t missing the datum information.

# if you want to plot the data in the projected crs of trails
gg_ftb +
  coord_sf(datum = st_crs(trails))

Created on 2018-09-07 by the reprex package (v0.2.0).
I'm definitely no expert on projections, but I found that quite understandable in terms of the ellps and datum:
Overview of Coordinate Reference Systems (CRS) in R
The datum always specifies the ellipsoid that is used,
but the ellipsoid does not specify the datum!
Datums are based on specific ellipsoids and sometimes
have the same name as the ellipsoid
 cstepper
on 7 Sep 2018
cstepper
on 7 Sep 2018
Thanks so much for the help.
Finally @tim-salabim realized that I had to specify +south in CRS:
crs(w) <- CRS("+proj=utm +zone=36 +south")
My points were +north by default, so they were somewhere in northern Europe instead of Africa.
He find it out using:
options(viewer = NULL)
mapview(district) + old + water
bertagrau
on 12 Sep 2018
Related issues
 rundel
·
44Comments
rundel
·
44Comments
 buxinator
·
25Comments
buxinator
·
25Comments
 wwesting
·
33Comments
wwesting
·
33Comments
 adrfantini
·
34Comments
adrfantini
·
34Comments
 rsbivand
·
24Comments
rsbivand
·
24Comments
Most helpful comment
very likely yes!
This works:
Here, I transform trails to fit wtih the crs of the other two layers.