In what area(s)?
/area autoscale
/area networking
Describe the feature
Per https://github.com/knative/serving/issues/1625#issuecomment-511930023, maximum RPS of single Activator pods is around 350, which doesn't sound good. We need to improve this.
 yanweiguo
All 9 comments
To clarify, this issue only focus on Activator. The istio-ingressgate and istio-proxy sidecar are not in scope.
The data from https://github.com/knative/serving/issues/1625#issuecomment-511930023 is not accurate. As @JRBANCEL pointed out(thanks @JRBANCEL), the bottleneck was somewhere else. It could be:
istio-ingressgateistio-proxy- The backend, i.e. revision pods
- The client tool,
hey,vegeta, etc. - The client machine profiles.
To exclude the influences of the first three components of Knative, the load tests in this issue is executed in a GKE cluster with following settings:
- The cluster was created by following this instruction
- Change activator service type from
ClusterIPtoLoadBalancerso that we can hit the activator external IP directly bypassing theistio-ingressgate. - Change
sidecar.istio.io/injectannotation in activator and autoscaler deployment tofalseso that theistio-proxysidecar is disabled. - Set up a revision with minimum 40 pods so the backend won't be the bottleneck.
yanweiguo
on 23 Jul 2019
To test single activator pod, do the following:
- Set
target-burst-capacityinconfig-autoscalerConfigMap to -1 to make the activator always in the request path. - Set
maxReplicasof activator HPA to 1. - Remove the CPU and Memory resources limits in activator deployment.
With #4886 checked in, I did the following load tests.
Hey
Run the following command to send traffic
hey -z 2m -c ${concurrency} -t 60 -H "Knative-Serving-Revision:<rev-name>" -H "Knative-Serving-Namespace: <ns-name>" http://<activator-service-external-ip>
After each batch traffic ends, run the following command to get CPU and memory usage for the activator pod:
kubectl top -n knative-serving pod --containers=true
Results
Concurrency | RPS | P95 latency(s) | P99 latency(s) | Activator CPU(m) | Activator Memory(Mi)
-- | -- | -- | -- | -- | --
10 | 232.72 | 0.0499 | 0.0642 | 231 | 13
20 | 462.2497 | 0.0513 | 0.0641 | 399 | 13
30 | 685.5865 | 0.0534 | 0.0681 | 523 | 13
40 | 885.5814 | 0.0589 | 0.0791 | 640 | 13
50 | 1070.9211 | 0.0654 | 0.0836 | 736 | 13
60 | 1273.5078 | 0.066 | 0.0837 | 881 | 13
70 | 1396.0826 | 0.0752 | 0.0982 | 922 | 13
80 | 1548.6492 | 0.079 | 0.098 | 1009 | 13
90 | 1602.1574 | 0.0874 | 0.1087 | 1028 | 13
100 | 1632.1684 | 0.0945 | 0.1163 | 1036 | 13
110 | 1627.6681 | 0.1058 | 0.1338 | 1194 | 13
120 | 1682.8088 | 0.1128 | 0.147 | 1277 | 13
All requests succeeded (with 200 response code).
We can see when concurrency increases over 100, RPS doesn't increase as well. This is probably due to MaxIdleConnsPerHost is set to 100. To verified my thought, I changed MaxIdleConnsPerHost to 1000 then reran the hey command with 120 concurrency. The RPS was 1958.5116.
Vegeta
Run the following command to send traffic
echo 'GET http://<activator-service-external-ip>' | vegeta attack -rate ${RPS} -duration 2m -header "Knative-Serving-Revision: <rev-name>" -header "Knative-Serving-Namespace: <ns-name>"
Results
RPS/Rate | P95 latency(ms) | P99 latency(ms) | Activator CPU(m) | Activator Memory(Mi)
-- | -- | -- | -- | --
500.01 | 49.430131 | 65.132332 | 445 | 12
600.01 | 50.077775 | 65.613856 | 499 | 13
700.01 | 53.385561 | 76.419904 | 563 | 13
800.01 | 52.485872 | 70.922042 | 628 | 13
900.01 | 56.051949 | 76.84169 | 689 | 13
1000.01 | 60.156093 | 86.807291 | 740 | 13
1100.01 | 61.842309 | 83.141761 | 786 | 13
1200.01 | 64.137743 | 86.481878 | 842 | 13
1300.01 | 69.413319 | 97.256206 | 915 | 13
1399.97 | 84.91068 | 129.50776 | 928 | 20
All requests succeeded (with 200 response code).
Summary
I'm happy to see a single activator pod can handle ~1500 RPS with reasonable client latencies. We may want to increase CPU limit of activator to 1000 based on the data above.
cc @vagababov @mattmoor
yanweiguo
on 23 Jul 2019
The tests in previous comment were executed on my local machine. We can send traffic from the same cluster to get lower latency and no need to expose activator service via an external IP.
Some vegeta results when running on the same cluster:
RPS | P95 latency(ms) | P99 latency(ms)
-- | -- | --
1800 | 22.747926 | 45.076279
2000 | 23.983688 | 42.507629
2200 | 39.899067 | 89.203038
2400 | 47.515445 | 85.878069
If you keep the the traffic at high rate (say ~2500) for long time, the memory of activator will increase to hundreds of Mi. It will finally returns errors.
yanweiguo
on 24 Jul 2019
Do we have a memory leak of sorts or is it buffering? I.e. what does
concurrency metric on the activator itself show?
On Tue, Jul 23, 2019 at 4:26 PM Yanwei Guo notifications@github.com wrote:
The tests in previous comment were executed on my local machine. We can
send traffic from the same cluster to get lower latency and no need to
expose activator service via an external IP.Some vegeta results when running on the same cluster:
RPS P95 latency(ms) P99 latency(ms)
1800 22.747926 45.076279
2000 23.983688 42.507629
2200 39.899067 89.203038
2400 47.515445 85.878069If you keep the the traffic at high rate (say ~2500) for long time, the
memory of activator will increase to hundreds of Mi. It will finally
returns errors.—
You are receiving this because you were mentioned.
Reply to this email directly, view it on GitHub
https://github.com/knative/serving/issues/4773?email_source=notifications&email_token=AAF2WXZTITFGALE76LLH2MDQA6HT5A5CNFSM4IEG4YMKYY3PNVWWK3TUL52HS4DFVREXG43VMVBW63LNMVXHJKTDN5WW2ZLOORPWSZGOD2UWXRI#issuecomment-514419653,
or mute the thread
https://github.com/notifications/unsubscribe-auth/AAF2WX7IB3V7UNB3P4XJDL3QA6HT5ANCNFSM4IEG4YMA
.
 vagababov
on 24 Jul 2019
vagababov
on 24 Jul 2019
Do we have a memory leak of sorts or is it buffering? I.e. what does concurrency metric on the activator itself show?
With the dashboard added in https://github.com/knative/serving/pull/4931, I saw ~4k concurrency. So probably the high memory was due to buffering during heavy load.
yanweiguo
on 27 Jul 2019
Added latency metric around each handler layer in activator. The following is a sample output for P95 latency:
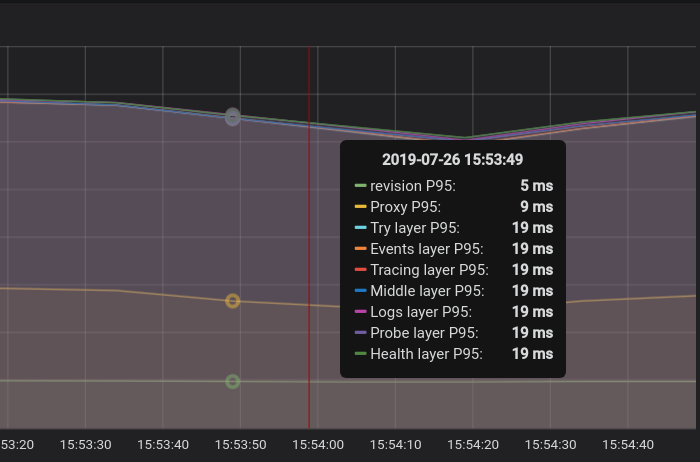
The Proxy layer is the latency around where we call ServeHttp of the reverse proxy.
We need to improve the innermost handler(the Try layer) where we do throttling and buffering (if my implementation for the latency metrics is correct).
yanweiguo
on 27 Jul 2019
The probing revision service doubles the latency. The following is a sample output for P95 latency without probing:
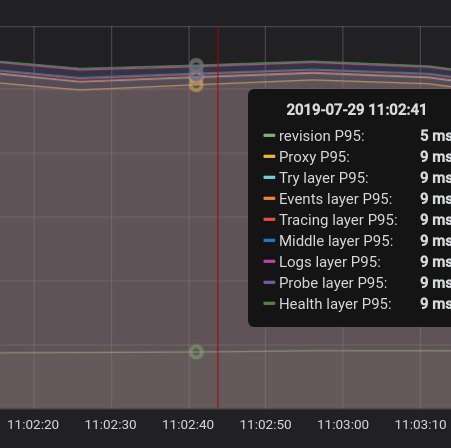
The cache of probing was reverted in #4797.
yanweiguo
on 29 Jul 2019
Probing is indeed one of the biggest contributors to our serving path. So
hopefully when per-backend stuff with caching is in, we'll be fine.
On Mon, Jul 29, 2019 at 11:07 AM Yanwei Guo notifications@github.com
wrote:
The probing revision service doubles the latency. The following is a
sample output for P95 latency without probing:[image: no_probe]
https://user-images.githubusercontent.com/26175014/62071238-f3ad5080-b1f0-11e9-9d84-a38d5994730d.pngThe cache of probing was reverted in #4797
https://github.com/knative/serving/pull/4797.—
You are receiving this because you were mentioned.
Reply to this email directly, view it on GitHub
https://github.com/knative/serving/issues/4773?email_source=notifications&email_token=AAF2WX2PIQG5PKTOWUPLSDDQB4WV7A5CNFSM4IEG4YMKYY3PNVWWK3TUL52HS4DFVREXG43VMVBW63LNMVXHJKTDN5WW2ZLOORPWSZGOD3BRIWA#issuecomment-516101208,
or mute the thread
https://github.com/notifications/unsubscribe-auth/AAF2WXY77GEPZJYJRG4WF7LQB4WV7ANCNFSM4IEG4YMA
.
vagababov
on 29 Jul 2019
The probe cache is back.
Currently I don't see action items left. Closing this.
yanweiguo
on 6 Aug 2019
Related issues
 mattmoor
·
5Comments
mattmoor
·
5Comments
 maxiloEmmmm
·
4Comments
maxiloEmmmm
·
4Comments
 tcnghia
·
3Comments
tcnghia
·
3Comments
 josephburnett
·
6Comments
josephburnett
·
6Comments
 arisu1000
·
6Comments
arisu1000
·
6Comments
Most helpful comment
To test single activator pod, do the following:
target-burst-capacityinconfig-autoscalerConfigMap to -1 to make the activator always in the request path.maxReplicasof activator HPA to 1.With #4886 checked in, I did the following load tests.
Hey
Run the following command to send traffic
After each batch traffic ends, run the following command to get CPU and memory usage for the activator pod:
Results
Concurrency | RPS | P95 latency(s) | P99 latency(s) | Activator CPU(m) | Activator Memory(Mi)
-- | -- | -- | -- | -- | --
10 | 232.72 | 0.0499 | 0.0642 | 231 | 13
20 | 462.2497 | 0.0513 | 0.0641 | 399 | 13
30 | 685.5865 | 0.0534 | 0.0681 | 523 | 13
40 | 885.5814 | 0.0589 | 0.0791 | 640 | 13
50 | 1070.9211 | 0.0654 | 0.0836 | 736 | 13
60 | 1273.5078 | 0.066 | 0.0837 | 881 | 13
70 | 1396.0826 | 0.0752 | 0.0982 | 922 | 13
80 | 1548.6492 | 0.079 | 0.098 | 1009 | 13
90 | 1602.1574 | 0.0874 | 0.1087 | 1028 | 13
100 | 1632.1684 | 0.0945 | 0.1163 | 1036 | 13
110 | 1627.6681 | 0.1058 | 0.1338 | 1194 | 13
120 | 1682.8088 | 0.1128 | 0.147 | 1277 | 13
All requests succeeded (with 200 response code).
We can see when concurrency increases over 100, RPS doesn't increase as well. This is probably due to
MaxIdleConnsPerHostis set to 100. To verified my thought, I changedMaxIdleConnsPerHostto 1000 then reran theheycommand with 120 concurrency. The RPS was 1958.5116.Vegeta
Run the following command to send traffic
Results
RPS/Rate | P95 latency(ms) | P99 latency(ms) | Activator CPU(m) | Activator Memory(Mi)
-- | -- | -- | -- | --
500.01 | 49.430131 | 65.132332 | 445 | 12
600.01 | 50.077775 | 65.613856 | 499 | 13
700.01 | 53.385561 | 76.419904 | 563 | 13
800.01 | 52.485872 | 70.922042 | 628 | 13
900.01 | 56.051949 | 76.84169 | 689 | 13
1000.01 | 60.156093 | 86.807291 | 740 | 13
1100.01 | 61.842309 | 83.141761 | 786 | 13
1200.01 | 64.137743 | 86.481878 | 842 | 13
1300.01 | 69.413319 | 97.256206 | 915 | 13
1399.97 | 84.91068 | 129.50776 | 928 | 20
All requests succeeded (with 200 response code).
Summary
I'm happy to see a single activator pod can handle ~1500 RPS with reasonable client latencies. We may want to increase CPU limit of activator to 1000 based on the data above.
cc @vagababov @mattmoor