Serving: Sharp increase in memory usage -> server is killed
Every so often I have found my tensorflow server killing itself due to memory usage hitting capacity. I can't quite figure out how or why this happening because it only happens occasionally and my process to use the server to infer files sequentially is identical between multiple servers and runtimes.
My guess is the issue is related to the files itself (the only non-constant), has anybody run into similar problems? For the sake of context, I am using my tf server to translate text in these files.
 echan00
All 53 comments
How much memory does tf serving use? how many models do you load to tf serving? How much memory does your machine have?
 Arnold1
on 18 Dec 2018
Arnold1
on 18 Dec 2018
If you have a bug, please fill out the template. Otherwise, please go to Stack Overflow for help and support:
https://stackoverflow.com/questions/tagged/tensorflow-serving
If you open a GitHub issue, it must be a bug, a feature request, or a
significant problem with documentation (for small docs fixes please send
a PR instead).
Thanks!
 gautamvasudevan
on 18 Dec 2018
gautamvasudevan
on 18 Dec 2018
System information
- Ubuntu 16.04
- TensorFlow Serving compiled from binary
- TensorFlow Serving version 1.12
Describe the problem
When sending my translation model (Chinese to English) gibberish text for inference, memory increases sharply and TF serving is killed
Example gibberish text:
https://gist.github.com/echan00/acde1d7e460cd9e467dfd612ea14ab66
@Arnold1 I only loaded one model. My machine has 16GB of memory, so memory consumption prior to feeding it model gibberish isn't the problem. The model itself takes up 500MB+
echan00
on 19 Dec 2018
@gautamvasudevan can you reopen the bug now?
echan00
on 19 Dec 2018
Unfortunately this isn't sufficient for us to know what the issue is or reproduce it.
gautamvasudevan
on 19 Dec 2018
Hi @gautamvasudevan, @echan00
I've also noticed a memory leak problem on server side thats loading an inception model (similar to object detection).
The memory leak problem on inception model can be traced back to the client making synchronous vs asynchronous gRPC requests to the model server (i.e. parallel vs sequential prediction requests to inception graph hosted on tensorflow serving).
Async requests (using stub.Predict.future(request, 30.0)) to model server:
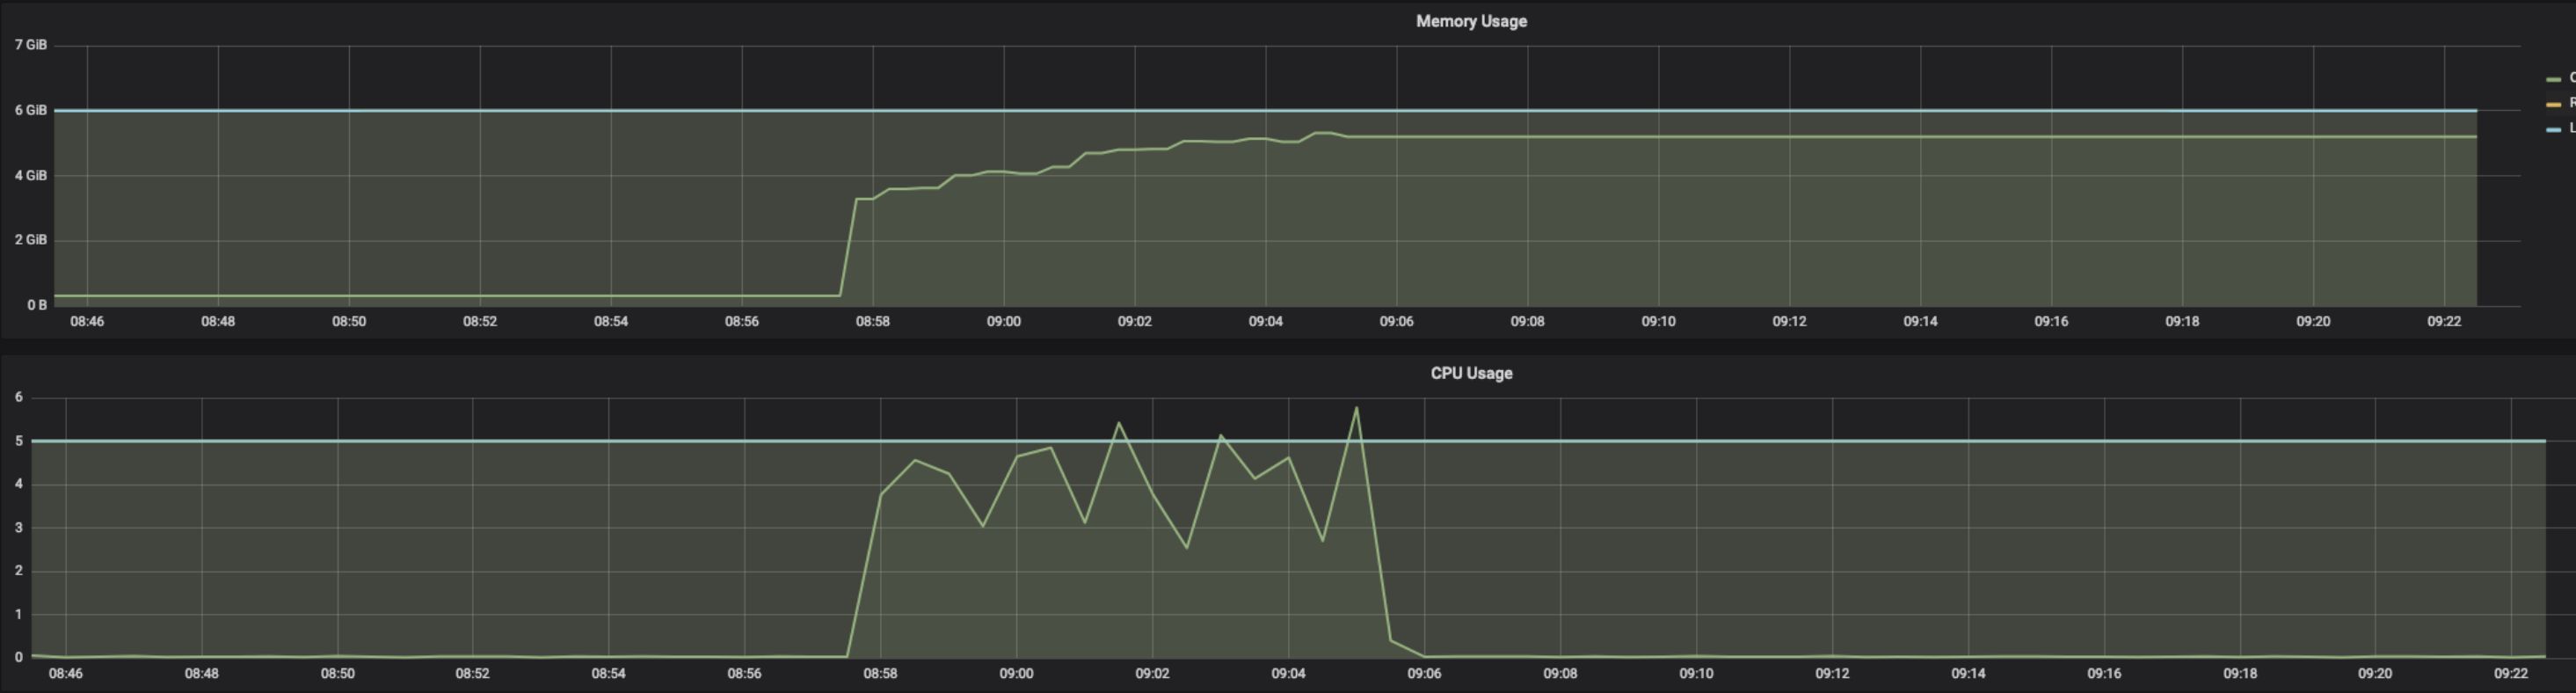
Sync request (stub.Predict(request, 30.0)) to model server:
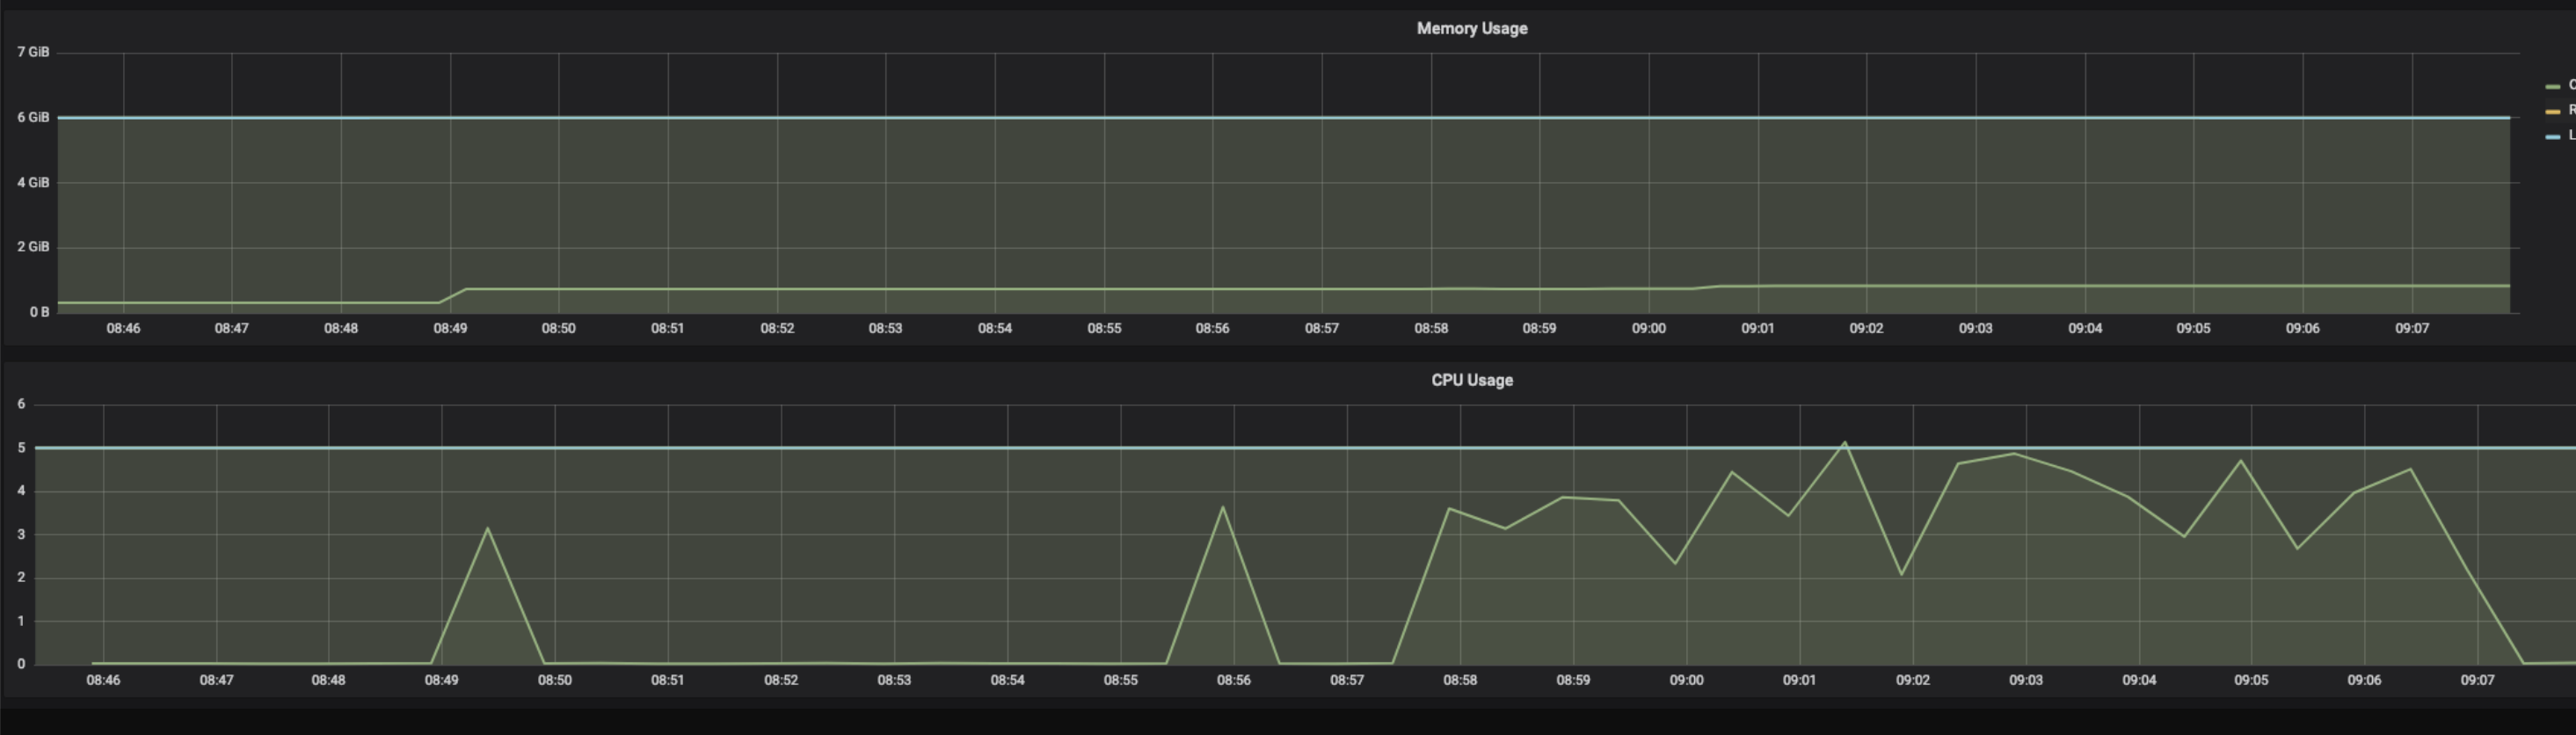
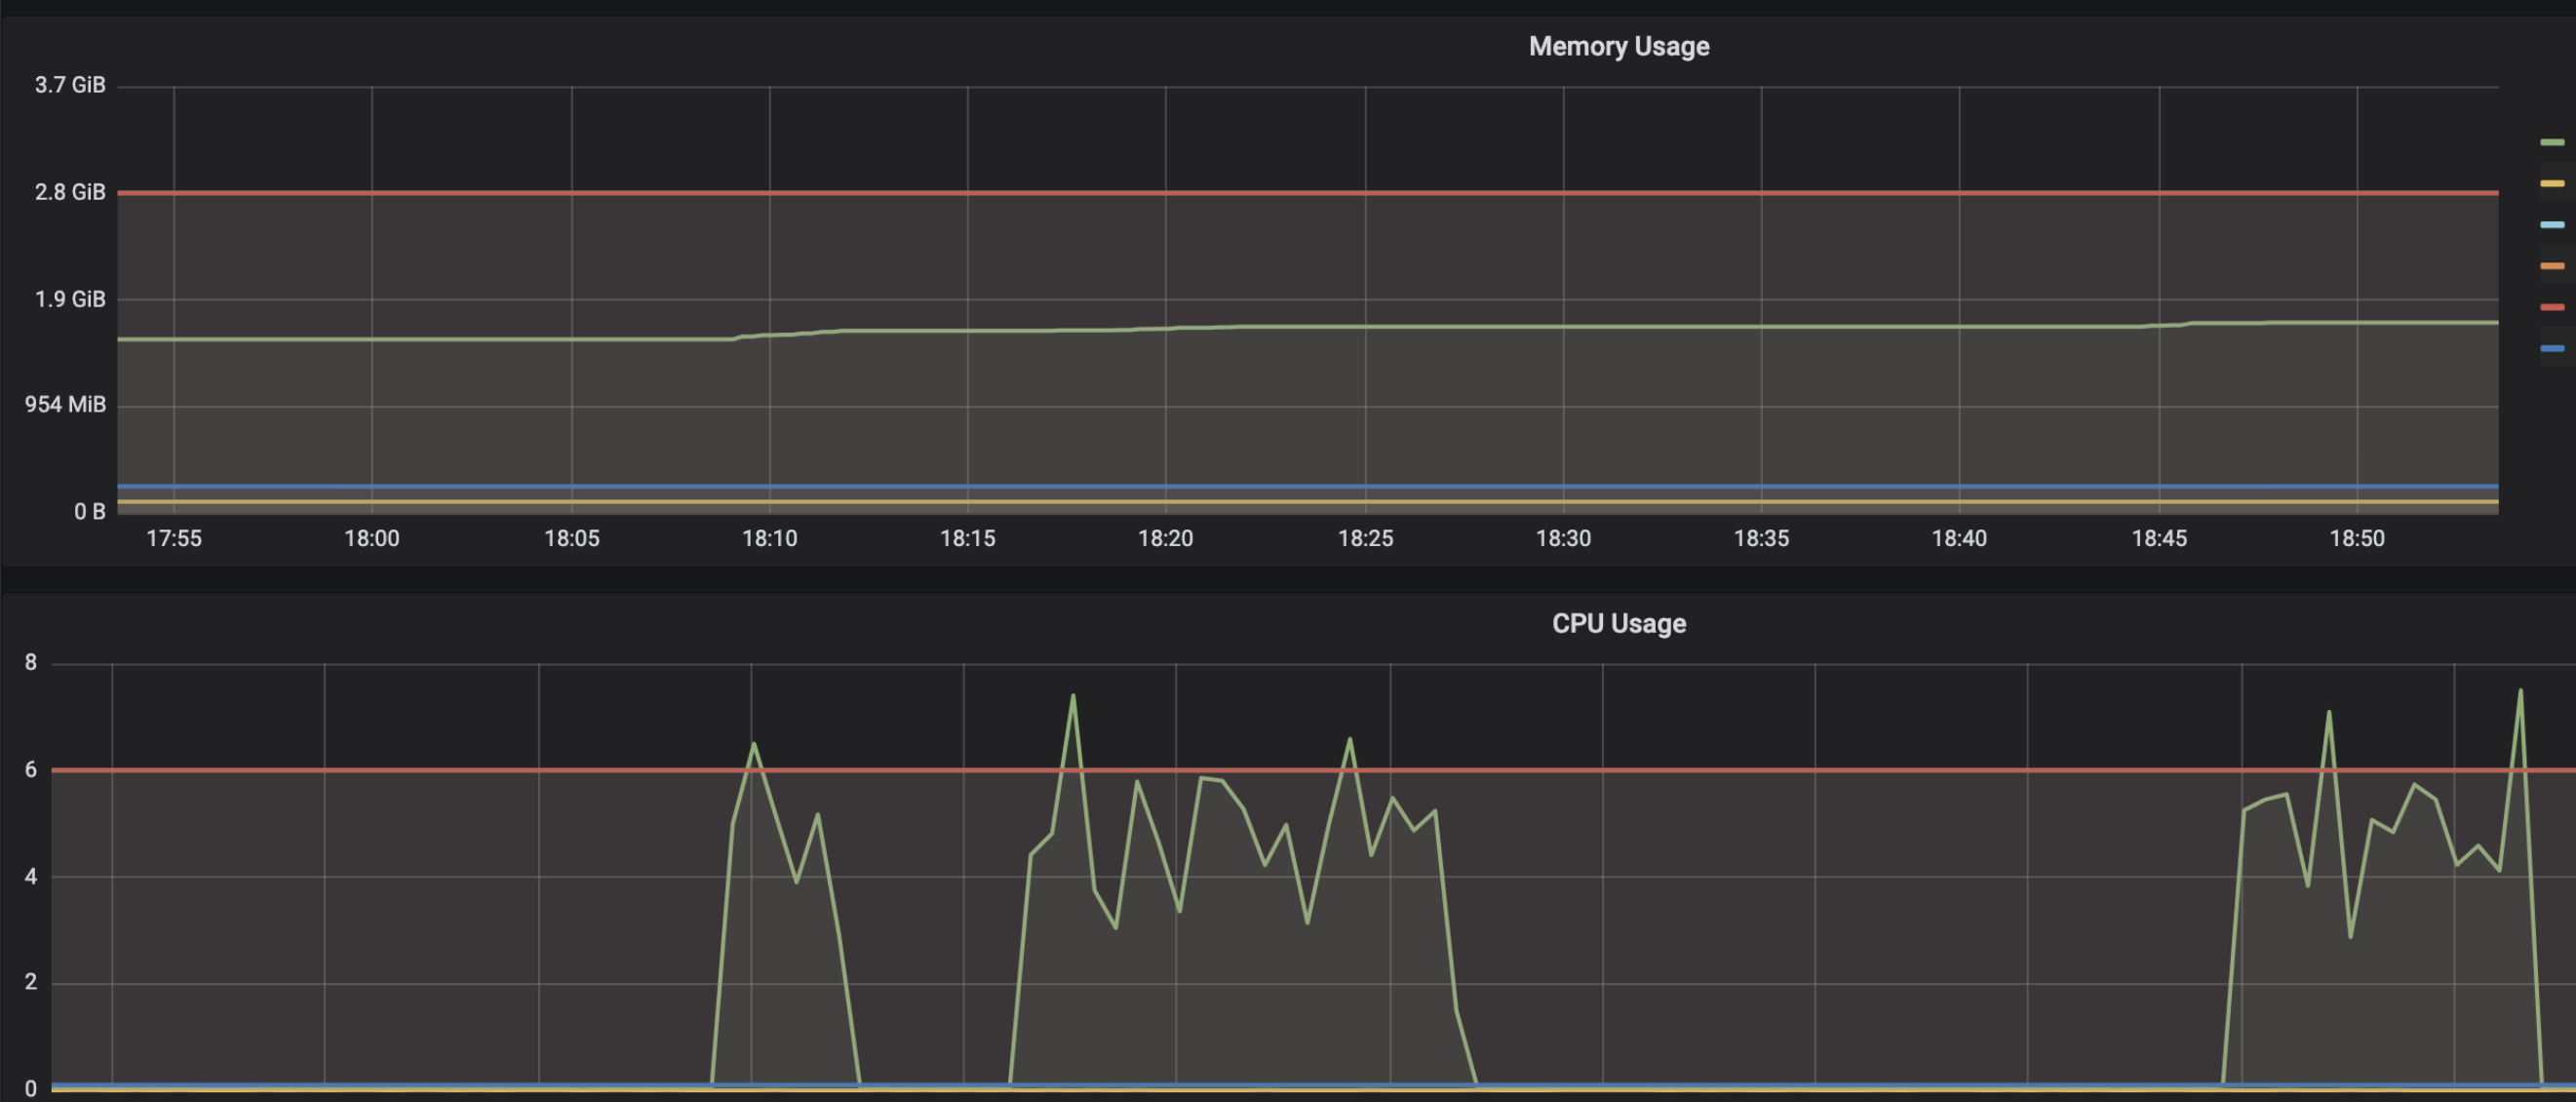
Sync requests grouped/distributed among threads from a threadpool (of size 8):
This issue has been reported sparsely in github issues and some SO posts, but this is a big concern as a common inception client example (like mnist) with async requests will lead to server memory leak. IMO this issue should be re-opened for further discussion.
@gautamvasudevan let me know if you need more information/data, i've managed to reproduce this issue using faster_rcnn_inception_resnet_v2_atrous_oid from model zoo (https://github.com/tensorflow/models/blob/master/research/object_detection/g3doc/detection_model_zoo.md). I can provide sample scripts and more examples.
 masroorhasan
on 19 Dec 2018
masroorhasan
on 19 Dec 2018
@masroorhasan That's very helpful! Thank you!
If you have a sample script/instructions that easily reproduce it, that would be amazing and help us narrow down what's going on.
gautamvasudevan
on 19 Dec 2018
Closing this at it is in "awaiting response" status for more than a week. Feel free to add comments(if any), we will reopen the issue. Thanks !
 Harshini-Gadige
on 11 Feb 2019
Harshini-Gadige
on 11 Feb 2019
Hi @masroorhasan
I would like to ask which tool you are using to measure the memory usage and GPU usage, as shown in your three screenshots. Thanks!
 sugartom
on 14 Mar 2019
sugartom
on 14 Mar 2019
Hi @gautamvasudevan,
I have also observed a memory leak on the server side. I am making concurrent requests to the model server for prediction. The model used is a simple mnist model, and I have also observed the issue with other models I use.
The client prediction code runs in a server, which makes gRPC calls to Tensorflow Serving for prediction. Client code:
import os
import json
from flask import Flask, Response, request
from timeit import default_timer as timer

import grpc
import numpy as np

import tensorflow as tf
from tensorflow_serving.apis import predict_pb2, prediction_service_pb2_grpc

app = Flask(__name__)


@app.route("/")
def predict():

    model = request.args.get('model', default="model_1", type=str)
    batch_size = request.args.get('batch_size', default=10, type=int)

    channel = grpc.insecure_channel("localhost:9640", options=[('grpc.max_send_message_length', 200 * 1024 * 1024), (
        'grpc.max_receive_message_length', 200 * 1024 * 1024)])
    stub = prediction_service_pb2_grpc.PredictionServiceStub(channel)

    start_pred = timer()
    pred_request = predict_pb2.PredictRequest()
    pred_request.model_spec.name = model
    pred_request.model_spec.signature_name = "serving_default"

    pred_request.inputs['pixels'].CopyFrom(tf.make_tensor_proto(
        np.random.rand(batch_size, 28, 28, 1), shape=[batch_size, 28, 28, 1], dtype=tf.float32))

    result = stub.Predict(pred_request, 600)
    end_pred = timer()

    channel.close()

    print("Completed pred for images(s) in {:0.2f}s".format(
        end_pred - start_pred))

    return "success"
The server started up using this code is then hit with multiple concurrent requests repeatedly. I am sending it 20 concurrent requests containing 1000 images (random numpy data here) in each.
Over time, I observe a memory build up in the server. Tensorflow Serving is running in a Docker container with the latest release(tensorflow/serving:1.13.0). Only 1 model is loaded at startup using the models.config file.
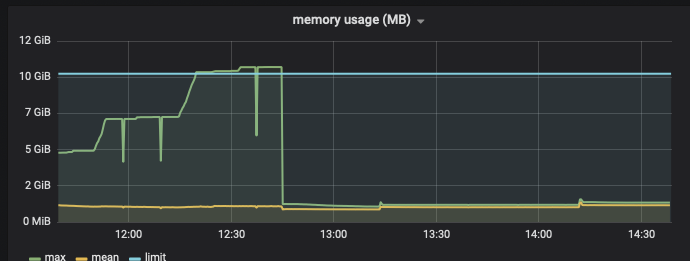
Memory stats of the Docker container (tracked using cadvisor and Prometheus):
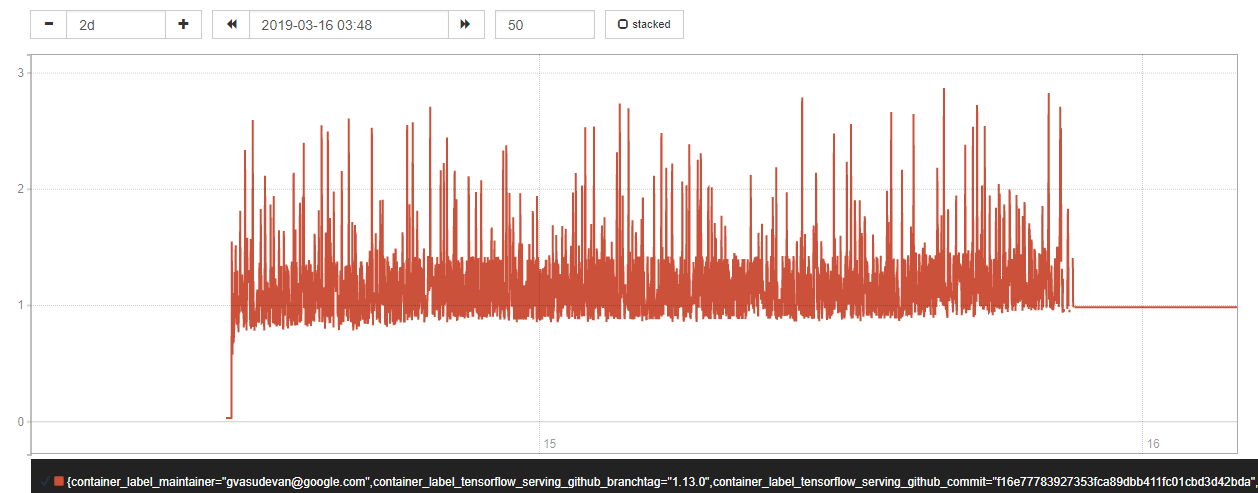
The base memory consumption of the server seems to gradually grow over time. This is an issue for us as we plan to deploy Tensorflow Serving in a production scenario and currently the server crashes after a while (2-3 days) due to the memory build up. The primary cause for that is the sharp peaks seen in the graph growing higher and higher (probably due to increase in base memory usage), leading to Out of Memory errors.
The best way to reproduce this issue at the moment is to send concurrent requests to the model server using any simple client code, repeatedly. Over time the memory build up becomes more visible. From my observations, building a binary from the devel image makes the memory leak more pronounced.
Please reopen this issue and let me know if you need any more details.
 prabalakanti
on 18 Mar 2019
prabalakanti
on 18 Mar 2019
I am facing the same issue. Any updates on this ?
 golisandeep3
on 13 Apr 2019
golisandeep3
on 13 Apr 2019
Hi golisandeep3,
Unfortunately, without detailed information of the problem you are facing, I wouldn't be able to know or reproduce the issue.
Hi prabalakanti,
Sorry for the delayed reply. I have a few questions to follow up
- Would it be possible to share which model you used to serve?
- How big is each of your images? If are you sending 1000 big images concurrently, I would expect the memory go up due to the large input size.
 nrobeR
on 16 Apr 2019
nrobeR
on 16 Apr 2019
- Would it be possible to share which model you used to serve?
Yes, the model is attached. It's a simple MNIST model.
model.zip
- How big is each of your images? If are you sending 1000 big images concurrently, I would expect the memory go up due to the large input size.
The "images" are simulated using random numpy arrays in the client code (attached in the earlier comment). I understand that if I am sending a lot of big images concurrently the memory usage will be high, it is expected. But over time, the average/peak memory usage goes up. This should not be happening in my opinion because the request sizes are the same over time.
The run goes something like this: send a bunch of large concurrent requests, wait for Tensorflow Serving to predict and send the response, then it repeats again.
Another observation: When I do the same run but with a single large request at a time, there's no memory build up over time. Everything runs smoothly and as expected.
prabalakanti
on 22 Apr 2019
@nrobeR Also the memory usage goes up when we reload the model configuration. Like deleting and adding new model versions.
golisandeep3
on 27 Apr 2019
@golisandeep3 When we reload the model configuration, the new version gets loaded first followed by the unload of previous version. That might be causing the high memory usage.
prabalakanti
on 30 Apr 2019
@prabalakanti The memory keeps growing ,it doesn't release the memory when it unloads the previous version.
golisandeep3
on 30 Apr 2019
@prabalakanti The memory keeps growing ,it doesn't release the memory when it unloads the previous version.
I am facing the same issue, when the new version is added to the model path, the memory usage increases, and the memory won't be released even the old version model is deleted.
 carter54
on 14 May 2019
carter54
on 14 May 2019
- Would it be possible to share which model you used to serve?
Yes, the model is attached. It's a simple MNIST model.
model.zip
- How big is each of your images? If are you sending 1000 big images concurrently, I would expect the memory go up due to the large input size.
The "images" are simulated using random numpy arrays in the client code (attached in the earlier comment). I understand that if I am sending a lot of big images concurrently the memory usage will be high, it is expected. But over time, the average/peak memory usage goes up. This should not be happening in my opinion because the request sizes are the same over time.
The run goes something like this: send a bunch of large concurrent requests, wait for Tensorflow Serving to predict and send the response, then it repeats again.
Another observation: When I do the same run but with a single large request at a time, there's no memory build up over time. Everything runs smoothly and as expected.
Thanks. I tried reproducing this problem with latest tensorflow_serving running in docker using the mnist model and cannot see RAM usage increase after load testing on it for a day now.
For your case, do you have any stack trace that we can look into? Also what is the cpu usage on your model server? I wonder if it's because the requests are queued up in the server gradually because some resource issues that bound the throughput.
nrobeR
on 18 May 2019
@prabalakanti The memory keeps growing ,it doesn't release the memory when it unloads the previous version.
Unfortunately, without more details and concrete steps of how to reproduce this, I won't be able to debug on this further. I tried loading new version of a model and didn't see RAM increase issues as you described.
nrobeR
on 18 May 2019
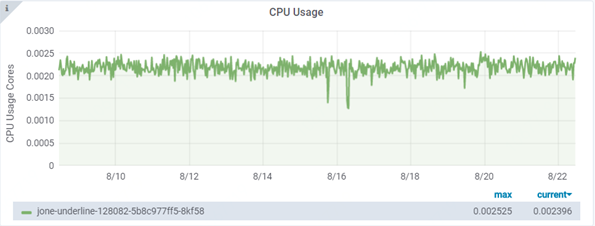
For your case, do you have any stack trace that we can look into? Also what is the cpu usage on your model server? I wonder if it's because the requests are queued up in the server gradually because some resource issues that bound the throughput.
I don't have a stack trace for it.
The CPU usage hits the peak of 100%. I don't think queuing up of requests should be an issue, because I am sending the next batch of requests only after the first batch has finished processing.
Also, a question about the load testing, did you run it with concurrent requests?
This memory build up is worrying for me if in a production scenario (where multiple users will be sending requests) over a period of time the build up becomes significant, the server crashes as observed in load and endurance testing.
prabalakanti
on 21 May 2019
I was having the same issue and appending the following thing while running my program worked for me:
$ sudo apt-get install google-perftools4
$ LD_PRELOAD=/usr/lib/libtcmalloc.so.4 python script.py
Initially, after every request (where I was sending a batch of around 50 images), my RAM would keep increasing by around 2GB and it would never be released.
But after trying the above environment variable, the memory would increase by only 20mb after every request.
I found the above thing over here https://riptutorial.com/tensorflow/example/13427/use-the-tcmalloc-allocator
It says the tcmalloc() implmentation suffers less from fragmentation when allocating and deallocating large objects (such as many tensors) than the default malloc()
My system:
Python 3.5
Tensorflow v1.8
Keras v2.1.6
 hrishi121
on 12 Jun 2019
hrishi121
on 12 Jun 2019
@hrishi121 hmm did that work with TF Serving?
 misterpeddy
on 13 Jun 2019
misterpeddy
on 13 Jun 2019
I also encountered the memory leak on tf-serving。
My tf-serving docker image: tensorflow/serving:1.13.0
From the service starting to now, the machine's free memory keeps downing, and the tf-service's memory keeps growing.

 wangzhilong
on 18 Jun 2019
wangzhilong
on 18 Jun 2019
@wangzhilong can you provide more info on the model, average request size and QPS? What happens when you try smoothening the QPS? What's the minimal QPS that causes the RAM growth?
 christisg
on 20 Jun 2019
christisg
on 20 Jun 2019
I was having the same issue and appending the following thing while running my program worked for me:
$ sudo apt-get install google-perftools4
$ LD_PRELOAD=/usr/lib/libtcmalloc.so.4 python script.pyInitially, after every request (where I was sending a batch of around 50 images), my RAM would keep increasing by around 2GB and it would never be released.
But after trying the above environment variable, the memory would increase by only 20mb after every request.
I found the above thing over here https://riptutorial.com/tensorflow/example/13427/use-the-tcmalloc-allocator
It says the
tcmalloc()implmentation suffers less from fragmentation when allocating and deallocating large objects (such as many tensors) than the defaultmalloc()My system:
Python 3.5
Tensorflow v1.8
Keras v2.1.6
Hi, @hrishi121 I want to know what functions are time-intensive.
How can I monitor the tensorflow serving with google-perltools? As far as I know, the objective service must exit normally while using google-perltools, but tensorflow serving is a permanent one.
 PayneJoe
on 27 Jun 2019
PayneJoe
on 27 Jun 2019
@echan00 @prabalakanti
hi, did you resolve the problem?
wangzhilong
on 29 Jul 2019
@echan00 @prabalakanti
hi, did you resolve the problem?
No. As a workaround I am restarting Tensorflow Serving on crash and retrying requests, if and when it crashes due to memory build up.
prabalakanti
on 29 Jul 2019
Hello,
I'm having the exact same issue.
I've deployed Tensorflow Serving on Kubernetes with GPU nodes and he always ends OOMKilled because of memory leak.
Tensorflow Serving version : 1.14.0-gpu
GPU nodes : 8 vCPUs, 30 GB memory, K80 GPU
Use-case : I'm loading new generated models every 3 hours. I'm unloading the old ones but it looks like we have memory leak and tensorflow serving is not totally releasing the memory.
stackoverflow post : https://stackoverflow.com/questions/57180479/tensorflow-serving-oomkilled-or-evicted-pod-with-kubernetes
I can give you informations/logs if you need.
Thanks
 vDMG
on 30 Jul 2019
vDMG
on 30 Jul 2019
does someone have resolved it ? have the same issue, tensorflow serving used all of memory until it is killed . my tensorflow serving version is r1.13
 gao8954
on 16 Aug 2019
gao8954
on 16 Aug 2019
Has anyone paid attention on this issue ? tried @hrishi121 's method ,It seems that it is useless.
gao8954
on 16 Aug 2019
As this comment asks, if someone can provide the model, and a script that can recreate this failure mode, we can try debugging it but at this point we haven't been able to reproduce this.
misterpeddy
on 16 Aug 2019
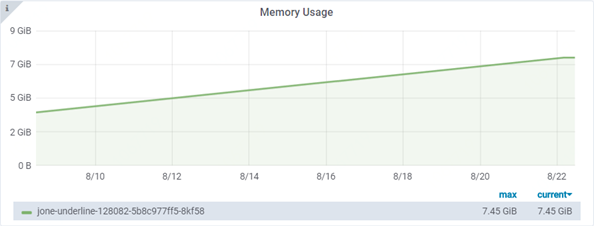
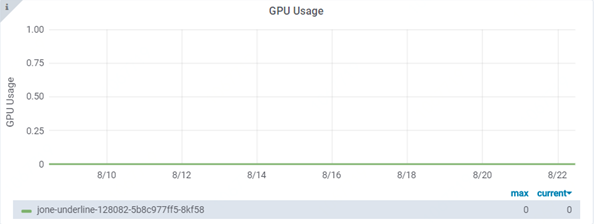
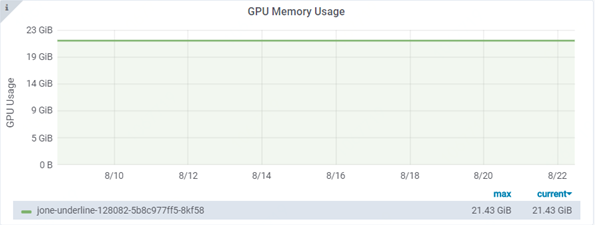
@unclepeddy
Hi. I have deployed a pre-trained inception model on kubernetes for about 2 weeks. During this period, I didn't do any version load/unload, didn't send any requests to do prediction. But the memory keeps growing.
tf-serving version: 1.12 gpu
deployment resources: 4CPUs, 8G and 1 P40 GPU
 elvys-zhang
on 22 Aug 2019
elvys-zhang
on 22 Aug 2019
I also encountered the memory leak on tf-serving。
My tf-serving docker image: tensorflow/serving:1.13.0
From the service starting to now, the machine's free memory keeps downing, and the tf-service's memory keeps growing.
======

If i run docker with paramas enable_batching=true, the memory keeps stable, as shown in the figure。I don't know why.
wangzhilong
on 19 Sep 2019
Could someone please try with the latest tf serving version (1.14.0) and see if the issue still reproduces? Thanks!
nrobeR
on 23 Sep 2019
Hi all, if someone could please provide
- the model
- sample requests or preferably a script to reproduce the issue
we are happy to help on debugging this. Without this, we cannot to reproduce the issue. Thanks.
nrobeR
on 31 Oct 2019
I met same problem when continue loads new version model in CPU tf serving 1.13.0.
Those models are same size, but different version.
You can try any model and use a tf serving docker.
- first load verion-1
- then replace verion-1 with version-2 without stopping tf serving, wait for model loaded, then memory increased.
- then replace version-2 with version-3 without stopping tf serving, then memory increased more
again.
@nrobeR I think it may caused by memeory Fragmentation. After tracing the TF serving with gprof.
I find SbrkSysAllocator memory keep growth, but TF serving in use actully not.
profile.0020.heap.pdf
profile.0021.heap.pdf
In profile.0021, tensorflow memory in use goes back to original size, but SbrkSysAllocator keep growing.
 zhjunqin
on 18 Nov 2019
zhjunqin
on 18 Nov 2019
One more question, I saw such log in TF serving, but in TF, seems the function is a no-op?
2019-11-19 03:25:27.645587: I ./tensorflow_serving/core/simple_loader.h:294] Calling MallocExtension_ReleaseToSystem() after servable unload with 5833348764
// Tries to release num_bytes of free memory back to the operating
// system for reuse.  Use this routine with caution -- to get this
// memory back may require faulting pages back in by the OS, and
// that may be slow.
//
// Currently, if a malloc implementation does not support this
// routine, this routine is a no-op.
void MallocExtension_ReleaseToSystem(std::size_t num_bytes);


md5-9022904f3fad95244e07bdfb5baaeaea


  // If we have a main-memory footprint estimate, release that amount of memory
  // to the OS.
  const uint64 memory_estimate =
      resource_util_->GetQuantity(ram_resource_, resource_estimate);
  if (memory_estimate > 0) {
    LOG(INFO) << "Calling MallocExtension_ReleaseToSystem() after servable "
                 "unload with "
              << memory_estimate;
    ::tensorflow::port::MallocExtension_ReleaseToSystem(memory_estimate);
  }
hi, i run tfserving in kubernetes.
i there a way to figure out the memory usage of tfserving within the pod?
here some stats from metrics-server
$ kubectl top pods
NAME                                  CPU(cores)   MEMORY(bytes)
tf-bla-model-6bc566bcfb-2rqz2   5m           3831Mi
where can i see the 3831Mi from within the pod?
bash into the running pod:
$ kubectl exec -it tf-bla-model-6bc566bcfb-2rqz2 -- /bin/bash

top - 21:10:23 up 9 min,  0 users,  load average: 5.68, 19.99, 14.09
Tasks:   4 total,   1 running,   3 sleeping,   0 stopped,   0 zombie
%Cpu(s):  7.7 us,  3.2 sy,  0.0 ni, 89.1 id,  0.0 wa,  0.0 hi,  0.0 si,  0.0 st
KiB Mem : 72041200 total, 64320080 free,  5686752 used,  2034372 buff/cache
KiB Swap:        0 total,        0 free,        0 used. 65655576 avail Mem

  PID USER      PR  NI    VIRT    RES    SHR S  %CPU %MEM     TIME+ COMMAND
    1 root      20   0   18372   3020   2764 S   0.0  0.0   0:00.00 tf_serving_entr
    8 root      20   0 20.801g 3.044g  31676 S   0.0  4.4   4:30.71 tensorflow_mode
35104 root      20   0   18504   3436   3012 S   0.0  0.0   0:00.00 bash
35118 root      20   0   36612   3272   2796 R   0.0  0.0   0:00.00 top
 geraldstanje
on 9 Dec 2019
geraldstanje
on 9 Dec 2019
@nrobeR
I am also seeing a similar problem. CPU memory keeps increasing after I keep removing latest model versions. The next latest version gets loaded before the older one gets unloaded.There are no inference calls made.
As you can see below RES keeps increasing after each step.
Below is the details of my experiment.
Setup:
Ubuntu 16.04
TensorFlow ModelServer: 2.0.0+dev.sha.b5a11f1
TensorFlow Library: 2.0.0
model: https://tfhub.dev/google/tf2-preview/inception_v3/classification/4
command: ./tensorflow_model_server --model_base_path=/home/ubuntu/inception/
Directory structure:
model
|------ 1/
|------ 2/
|------ 3/
Each numbered sub-folder contains the exact same saved model files
Step 1: Started a TFS using a saved model
Step 2: Remove folder 3/ from the directory structure
Step 3: Remove folder 2/ from the directory structure
CPU Memory usage after each step:
### After step 1:
  PID USER      PR  NI    VIRT    RES    SHR S  %CPU %MEM     TIME+ COMMAND
 5111 ubuntu    20   0 6656252 251844  75456 S   0.0  0.2   0:03.96 tensorflow_mode

### After step 2:
  PID USER      PR  NI    VIRT    RES    SHR S  %CPU %MEM     TIME+ COMMAND
 4586 ubuntu    20   0 6673504 326808  75580 S   0.0  0.2   0:06.34 tensorflow_mode

### After step 3:
   PID USER      PR  NI    VIRT    RES    SHR S  %CPU %MEM     TIME+ COMMAND
 4586 ubuntu    20   0 6784460 438752  75580 S  12.3  0.3   0:08.53 tensorflow_mode
 ```


### Logs after step 1:
2020-02-02 01:04:03.396360: I tensorflow_serving/core/loader_harness.cc:74] Loading servable version {name: default version: 3}
2020-02-02 01:04:03.396404: I external/org_tensorflow/tensorflow/cc/saved_model/reader.cc:31] Reading SavedModel from: /home/ubuntu/inception/3
2020-02-02 01:04:03.440444: I external/org_tensorflow/tensorflow/cc/saved_model/reader.cc:54] Reading meta graph with tags { serve }
2020-02-02 01:04:03.483071: I external/org_tensorflow/tensorflow/core/platform/cpu_feature_guard.cc:142] Your CPU supports instructions that this TensorFlow binary was not compiled to use: SSE4.1 SSE4.2 AVX AVX2 AVX512F FMA
2020-02-02 01:04:03.672714: I external/org_tensorflow/tensorflow/cc/saved_model/loader.cc:202] Restoring SavedModel bundle.
2020-02-02 01:04:05.299291: I external/org_tensorflow/tensorflow/cc/saved_model/loader.cc:151] Running initialization op on SavedModel bundle at path: /home/ubuntu/inception/3
2020-02-02 01:04:05.488078: I external/org_tensorflow/tensorflow/cc/saved_model/loader.cc:311] SavedModel load for tags { serve }; Status: success. Took 2091659 microseconds.
2020-02-02 01:04:05.498856: I tensorflow_serving/servables/tensorflow/saved_model_warmup.cc:105] No warmup data file found at /home/ubuntu/inception/3/assets.extra/tf_serving_warmup_requests
2020-02-02 01:04:05.503133: I tensorflow_serving/core/loader_harness.cc:87] Successfully loaded servable version {name: default version: 3}
2020-02-02 01:04:05.676221: I tensorflow_serving/model_servers/server.cc:353] Running gRPC ModelServer at 0.0.0.0:8500 ...
### Logs after step 2:
2020-02-02 01:06:45.391856: I tensorflow_serving/core/basic_manager.cc:739] Successfully reserved resources to load servable {name: default version: 2}
2020-02-02 01:06:45.391891: I tensorflow_serving/core/loader_harness.cc:66] Approving load for servable version {name: default version: 2}
2020-02-02 01:06:45.391906: I tensorflow_serving/core/loader_harness.cc:74] Loading servable version {name: default version: 2}
2020-02-02 01:06:45.391963: I external/org_tensorflow/tensorflow/cc/saved_model/reader.cc:31] Reading SavedModel from: /home/ubuntu/inception/2
2020-02-02 01:06:45.436948: I external/org_tensorflow/tensorflow/cc/saved_model/reader.cc:54] Reading meta graph with tags { serve }
2020-02-02 01:06:45.605977: I external/org_tensorflow/tensorflow/cc/saved_model/loader.cc:202] Restoring SavedModel bundle.
2020-02-02 01:06:47.237043: I external/org_tensorflow/tensorflow/cc/saved_model/loader.cc:151] Running initialization op on SavedModel bundle at path: /home/ubuntu/inception/2
2020-02-02 01:06:47.426547: I external/org_tensorflow/tensorflow/cc/saved_model/loader.cc:311] SavedModel load for tags { serve }; Status: success. Took 2034573 microseconds.
2020-02-02 01:06:47.437273: I tensorflow_serving/servables/tensorflow/saved_model_warmup.cc:105] No warmup data file found at /home/ubuntu/inception/2/assets.extra/tf_serving_warmup_requests
2020-02-02 01:06:47.442069: I tensorflow_serving/core/loader_harness.cc:87] Successfully loaded servable version {name: default version: 2}
2020-02-02 01:06:47.442191: I tensorflow_serving/core/loader_harness.cc:138] Quiescing servable version {name: default version: 3}
2020-02-02 01:06:47.442212: I tensorflow_serving/core/loader_harness.cc:145] Done quiescing servable version {name: default version: 3}
2020-02-02 01:06:47.442219: I tensorflow_serving/core/loader_harness.cc:120] Unloading servable version {name: default version: 3}
2020-02-02 01:06:47.515165: I ./tensorflow_serving/core/simple_loader.h:363] Calling MallocExtension_ReleaseToSystem() after servable unload with 116935270
2020-02-02 01:06:47.515213: I tensorflow_serving/core/loader_harness.cc:128] Done unloading servable version {name: default version: 3}
### Logs after step 3:
2020-02-02 01:07:35.370743: I tensorflow_serving/core/basic_manager.cc:739] Successfully reserved resources to load servable {name: default version: 1}
2020-02-02 01:07:35.370770: I tensorflow_serving/core/loader_harness.cc:66] Approving load for servable version {name: default version: 1}
2020-02-02 01:07:35.370784: I tensorflow_serving/core/loader_harness.cc:74] Loading servable version {name: default version: 1}
2020-02-02 01:07:35.370840: I external/org_tensorflow/tensorflow/cc/saved_model/reader.cc:31] Reading SavedModel from: /home/ubuntu/inception/1
2020-02-02 01:07:35.416868: I external/org_tensorflow/tensorflow/cc/saved_model/reader.cc:54] Reading meta graph with tags { serve }
2020-02-02 01:07:35.595666: I external/org_tensorflow/tensorflow/cc/saved_model/loader.cc:202] Restoring SavedModel bundle.
2020-02-02 01:07:37.243779: I external/org_tensorflow/tensorflow/cc/saved_model/loader.cc:151] Running initialization op on SavedModel bundle at path: /home/ubuntu/inception/1
2020-02-02 01:07:37.438753: I external/org_tensorflow/tensorflow/cc/saved_model/loader.cc:311] SavedModel load for tags { serve }; Status: success. Took 2067906 microseconds.
2020-02-02 01:07:37.450198: I tensorflow_serving/servables/tensorflow/saved_model_warmup.cc:105] No warmup data file found at /home/ubuntu/inception/1/assets.extra/tf_serving_warmup_requests
2020-02-02 01:07:37.454880: I tensorflow_serving/core/loader_harness.cc:87] Successfully loaded servable version {name: default version: 1}
2020-02-02 01:07:37.455021: I tensorflow_serving/core/loader_harness.cc:138] Quiescing servable version {name: default version: 2}
2020-02-02 01:07:37.455042: I tensorflow_serving/core/loader_harness.cc:145] Done quiescing servable version {name: default version: 2}
2020-02-02 01:07:37.455050: I tensorflow_serving/core/loader_harness.cc:120] Unloading servable version {name: default version: 2}
2020-02-02 01:07:37.517537: I ./tensorflow_serving/core/simple_loader.h:363] Calling MallocExtension_ReleaseToSystem() after servable unload with 116935270
2020-02-02 01:07:37.517569: I tensorflow_serving/core/loader_harness.cc:128] Done unloading servable version {name: default version: 2}
```
 spidyDev
on 1 Feb 2020
spidyDev
on 1 Feb 2020
@nrobeR
I am also seeing a similar problem. CPU memory keeps increasing after I keep removing latest model versions. The next latest version gets loaded before the older one gets unloaded.There are no inference calls made.
As you can see below RES keeps increasing after each step.
Below is the details of my experiment.Setup:
Ubuntu 16.04
TensorFlow ModelServer: 2.0.0+dev.sha.b5a11f1
TensorFlow Library: 2.0.0
model: https://tfhub.dev/google/tf2-preview/inception_v3/classification/4
command: ./tensorflow_model_server --model_base_path=/home/ubuntu/inception/Directory structure:
model
|------ 1/
|------ 2/
|------ 3/Each numbered sub-folder contains the exact same saved model files
Step 1: Started a TFS using a saved model
Step 2: Remove folder 3/ from the directory structure
Step 3: Remove folder 2/ from the directory structureCPU Memory usage after each step:
### After step 1:
  PID USER      PR  NI    VIRT    RES    SHR S  %CPU %MEM     TIME+ COMMAND
 5111 ubuntu    20   0 6656252 251844  75456 S   0.0  0.2   0:03.96 tensorflow_mode

### After step 2:
  PID USER      PR  NI    VIRT    RES    SHR S  %CPU %MEM     TIME+ COMMAND
 4586 ubuntu    20   0 6673504 326808  75580 S   0.0  0.2   0:06.34 tensorflow_mode

### After step 3:
   PID USER      PR  NI    VIRT    RES    SHR S  %CPU %MEM     TIME+ COMMAND
 4586 ubuntu    20   0 6784460 438752  75580 S  12.3  0.3   0:08.53 tensorflow_mode
Logs after step 1:
2020-02-02 01:04:03.396360: I tensorflow_serving/core/loader_harness.cc:74] Loading servable version {name: default version: 3}
2020-02-02 01:04:03.396404: I external/org_tensorflow/tensorflow/cc/saved_model/reader.cc:31] Reading SavedModel from: /home/ubuntu/inception/3
2020-02-02 01:04:03.440444: I external/org_tensorflow/tensorflow/cc/saved_model/reader.cc:54] Reading meta graph with tags { serve }
2020-02-02 01:04:03.483071: I external/org_tensorflow/tensorflow/core/platform/cpu_feature_guard.cc:142] Your CPU supports instructions that this TensorFlow binary was not compiled to use: SSE4.1 SSE4.2 AVX AVX2 AVX512F FMA
2020-02-02 01:04:03.672714: I external/org_tensorflow/tensorflow/cc/saved_model/loader.cc:202] Restoring SavedModel bundle.
2020-02-02 01:04:05.299291: I external/org_tensorflow/tensorflow/cc/saved_model/loader.cc:151] Running initialization op on SavedModel bundle at path: /home/ubuntu/inception/3
2020-02-02 01:04:05.488078: I external/org_tensorflow/tensorflow/cc/saved_model/loader.cc:311] SavedModel load for tags { serve }; Status: success. Took 2091659 microseconds.
2020-02-02 01:04:05.498856: I tensorflow_serving/servables/tensorflow/saved_model_warmup.cc:105] No warmup data file found at /home/ubuntu/inception/3/assets.extra/tf_serving_warmup_requests
2020-02-02 01:04:05.503133: I tensorflow_serving/core/loader_harness.cc:87] Successfully loaded servable version {name: default version: 3}
2020-02-02 01:04:05.676221: I tensorflow_serving/model_servers/server.cc:353] Running gRPC ModelServer at 0.0.0.0:8500 ...
Logs after step 2:
2020-02-02 01:06:45.391856: I tensorflow_serving/core/basic_manager.cc:739] Successfully reserved resources to load servable {name: default version: 2}
2020-02-02 01:06:45.391891: I tensorflow_serving/core/loader_harness.cc:66] Approving load for servable version {name: default version: 2}
2020-02-02 01:06:45.391906: I tensorflow_serving/core/loader_harness.cc:74] Loading servable version {name: default version: 2}
2020-02-02 01:06:45.391963: I external/org_tensorflow/tensorflow/cc/saved_model/reader.cc:31] Reading SavedModel from: /home/ubuntu/inception/2
2020-02-02 01:06:45.436948: I external/org_tensorflow/tensorflow/cc/saved_model/reader.cc:54] Reading meta graph with tags { serve }
2020-02-02 01:06:45.605977: I external/org_tensorflow/tensorflow/cc/saved_model/loader.cc:202] Restoring SavedModel bundle.
2020-02-02 01:06:47.237043: I external/org_tensorflow/tensorflow/cc/saved_model/loader.cc:151] Running initialization op on SavedModel bundle at path: /home/ubuntu/inception/2
2020-02-02 01:06:47.426547: I external/org_tensorflow/tensorflow/cc/saved_model/loader.cc:311] SavedModel load for tags { serve }; Status: success. Took 2034573 microseconds.
2020-02-02 01:06:47.437273: I tensorflow_serving/servables/tensorflow/saved_model_warmup.cc:105] No warmup data file found at /home/ubuntu/inception/2/assets.extra/tf_serving_warmup_requests
2020-02-02 01:06:47.442069: I tensorflow_serving/core/loader_harness.cc:87] Successfully loaded servable version {name: default version: 2}
2020-02-02 01:06:47.442191: I tensorflow_serving/core/loader_harness.cc:138] Quiescing servable version {name: default version: 3}
2020-02-02 01:06:47.442212: I tensorflow_serving/core/loader_harness.cc:145] Done quiescing servable version {name: default version: 3}
2020-02-02 01:06:47.442219: I tensorflow_serving/core/loader_harness.cc:120] Unloading servable version {name: default version: 3}
2020-02-02 01:06:47.515165: I ./tensorflow_serving/core/simple_loader.h:363] Calling MallocExtension_ReleaseToSystem() after servable unload with 116935270
2020-02-02 01:06:47.515213: I tensorflow_serving/core/loader_harness.cc:128] Done unloading servable version {name: default version: 3}
Logs after step 3:
2020-02-02 01:07:35.370743: I tensorflow_serving/core/basic_manager.cc:739] Successfully reserved resources to load servable {name: default version: 1}
2020-02-02 01:07:35.370770: I tensorflow_serving/core/loader_harness.cc:66] Approving load for servable version {name: default version: 1}
2020-02-02 01:07:35.370784: I tensorflow_serving/core/loader_harness.cc:74] Loading servable version {name: default version: 1}
2020-02-02 01:07:35.370840: I external/org_tensorflow/tensorflow/cc/saved_model/reader.cc:31] Reading SavedModel from: /home/ubuntu/inception/1
2020-02-02 01:07:35.416868: I external/org_tensorflow/tensorflow/cc/saved_model/reader.cc:54] Reading meta graph with tags { serve }
2020-02-02 01:07:35.595666: I external/org_tensorflow/tensorflow/cc/saved_model/loader.cc:202] Restoring SavedModel bundle.
2020-02-02 01:07:37.243779: I external/org_tensorflow/tensorflow/cc/saved_model/loader.cc:151] Running initialization op on SavedModel bundle at path: /home/ubuntu/inception/1
2020-02-02 01:07:37.438753: I external/org_tensorflow/tensorflow/cc/saved_model/loader.cc:311] SavedModel load for tags { serve }; Status: success. Took 2067906 microseconds.
2020-02-02 01:07:37.450198: I tensorflow_serving/servables/tensorflow/saved_model_warmup.cc:105] No warmup data file found at /home/ubuntu/inception/1/assets.extra/tf_serving_warmup_requests
2020-02-02 01:07:37.454880: I tensorflow_serving/core/loader_harness.cc:87] Successfully loaded servable version {name: default version: 1}
2020-02-02 01:07:37.455021: I tensorflow_serving/core/loader_harness.cc:138] Quiescing servable version {name: default version: 2}
2020-02-02 01:07:37.455042: I tensorflow_serving/core/loader_harness.cc:145] Done quiescing servable version {name: default version: 2}
2020-02-02 01:07:37.455050: I tensorflow_serving/core/loader_harness.cc:120] Unloading servable version {name: default version: 2}
2020-02-02 01:07:37.517537: I ./tensorflow_serving/core/simple_loader.h:363] Calling MallocExtension_ReleaseToSystem() after servable unload with 116935270
2020-02-02 01:07:37.517569: I tensorflow_serving/core/loader_harness.cc:128] Done unloading servable version {name: default version: 2}
Can you provide your config file? Did you use the default version policy?
PayneJoe
on 16 Mar 2020
Did not create a config file.
spidyDev
on 16 Mar 2020
faced with the same issue.
tensorflow-serving 1.15.0, CPU only.
using gRPC Predict API.
Here are the details
- If we use default malloc, memory usage goes up quickly during load testing and memory can not be released after load testing.
- Switch to tcmalloc, memory usage goes up quickly during load testing , but the leaking speed is lower than previous situation, and memory can not be released after load testing.
- Use enable_batching=true param and tcmalloc, memory usage keeps on a low level (about 400MB) during load testing, there's not obvious leaking, even after load testing finished.
Is there any difference between batching and non-batching when processing requests?
I captured heap info of situation 2 with pprof as following, if helps.
main.pdf
 Windfarer
on 26 Mar 2020
Windfarer
on 26 Mar 2020
same question, can anybody having solution to share
 TpClark
on 2 Apr 2020
TpClark
on 2 Apr 2020
@nrobeR @misterpeddy @gautamvasudevan actually, just using the official tensorflow serving docker image(e.g. tfs 1.14.0), and the mnist example codes(run mnist_client.py 10000+ times), you could be able to reproduce the memery leak issue.
 xixiddd
on 19 Apr 2020
xixiddd
on 19 Apr 2020
faced with the same issue.
tensorflow-serving 1.15.0, CPU only.
using gRPC Predict API.Here are the details
- If we use default malloc, memory usage goes up quickly during load testing and memory can not be released after load testing.
- Switch to tcmalloc, memory usage goes up quickly during load testing , but the leaking speed is lower than previous situation, and memory can not be released after load testing.
- Use enable_batching=true param and tcmalloc, memory usage keeps on a low level (about 400MB) during load testing, there's not obvious leaking, even after load testing finished.
Is there any difference between batching and non-batching when processing requests?
I captured heap info of situation 2 with pprof as following, if helps.
main.pdf
The situation 3 can work,thanks.
 JIANZM
on 28 Apr 2020
JIANZM
on 28 Apr 2020
did anyone get the solution to this problem?
I am facing the same with TF 2.1
 aniketmaurya
on 19 May 2020
aniketmaurya
on 19 May 2020
I solved this issue by manually setting the TensorFlow parallelism arguments in the TF serving arg list.
docker run -d --gpus all  -p 8500:8500 \
        --mount type=bind,source=$MODEL_ROOT_PATH/text_check,target=/models/my_model \
        --mount type=bind,source=$MODEL_CONFIG_PATH,target=/models/model_config.config \
        --mount type=bind,source=$BATCH_CONFIG_PATH,target=/models/batching.config \
        -t tensorflow/serving:2.1.0-gpu \
        --enable_batching=true \
        --batching_parameters_file=/models/batching.config \
        --model_config_file=/models/model_config.config \
        **--tensorflow_session_parallelism 32 \
        --tensorflow_intra_op_parallelism 32 \
        --tensorflow_inter_op_parallelism 32**
also try tuning _max_enqueued_batches_ in _batching_parameters_file_
did anyone get the solution to this problem?
I am facing the same with TF 2.1
aniketmaurya
on 20 May 2020
for those using v2 tf.feature_column + tf.keras to export the savedmodel, the above pr may be helpful. i.e., different from using v1 tf.feature_column + tf.estimator, the savedmodel exported by v2 tf.feature_column + tf.keras may have multi inputs(say the number of inputs is N), which, in theory, could write N! different inputs_key_concat_string to memory.
xixiddd
on 27 May 2020
I solved this issue by manually setting the TensorFlow parallelism arguments in the TF serving arg list.
docker run -d --gpus all  -p 8500:8500 \
        --mount type=bind,source=$MODEL_ROOT_PATH/text_check,target=/models/my_model \
        --mount type=bind,source=$MODEL_CONFIG_PATH,target=/models/model_config.config \
        --mount type=bind,source=$BATCH_CONFIG_PATH,target=/models/batching.config \
        -t tensorflow/serving:2.1.0-gpu \
        --enable_batching=true \
        --batching_parameters_file=/models/batching.config \
        --model_config_file=/models/model_config.config \
        **--tensorflow_session_parallelism 32 \
        --tensorflow_intra_op_parallelism 32 \
        --tensorflow_inter_op_parallelism 32**
also try tuning _max_enqueued_batches_ in _batching_parameters_file_
did anyone get the solution to this problem?
I am facing the same with TF 2.1
This solution did not help me (TF 2.2 and TF_serving 2.2). I am still seeing increase in memory. Does anyone have a solution to this?
Is this pull request relevant to this problem or no? https://github.com/tensorflow/serving/pull/1638
 DonnieKim411
on 1 Jul 2020
DonnieKim411
on 1 Jul 2020
I also tried #1638, not helping my case... I updated the code, rebuilt tensorflow-serving from the source using docker, and deployed... but i am still seeing memory keeps growing over time.
Btw, the way I am requesting the model (via gRPC) might be a factor. For me, I wanted to stress test the server given our system hardware spec. So I have been requesting 512 inputs as a batch, but simultaneously loading the server with 100 requests. Our system can handle, but if i repeat this stress-test over time (e.g. 100 requests with 512 images 1st run. Then another 100 requests with 512 images 2nd run, so on and so forth), I am seeing a memory build up.
Am i missing something? The below is my batch configuration file too:
max_batch_size { value: 1024 } # max number of images that can be sent
batch_timeout_micros { value: 0 } # in microseconds. Max amount of time to wait b4 executing a batch
max_enqueued_batches { value: 1000 } # how many batches can be queued up b4 inferred. in microseconds
num_batch_threads { value: 12 } # as a rule of thumb, match with number of physical cores available
@rmothukuru is the Tensorflow Serving team still unable to reproduce this issue?
We also have OOM issues with tensorflow-serving on Docker/Kubernetes. We have observed that alternative malloc implementations such as tcmalloc perform better when combined with batching. Regardless, it is concerning to us that we need to plan for serving instances to restart after a certain number of predictions.
It would be helpful if you could share an example that does not have this issue, as it has been very hard for us to find a configuration that does not leak.
 lyschoening
on 2 Dec 2020
lyschoening
on 2 Dec 2020
In same cases, it may caused by following reason. Pleaes check PR https://github.com/tensorflow/serving/pull/1785
zhjunqin
on 15 Dec 2020
I have face the same issue with the InceptionResNetv2 model with imagenet weightage for object detection but didn't find any specific reasons. But I thought this because the size of the model (InceptionResNetv2 model with imagenet weightage size is greater than 200MB )
 Hrishikesh-Galphade
on 12 Jan 2021
Hrishikesh-Galphade
on 12 Jan 2021
Related issues
 akkiagrawal94
·
3Comments
akkiagrawal94
·
3Comments
 brianschardt
·
3Comments
brianschardt
·
3Comments
 demiladef
·
4Comments
demiladef
·
4Comments
 marcoadurno
·
3Comments
marcoadurno
·
3Comments
 vikeshkhanna
·
3Comments
vikeshkhanna
·
3Comments
Most helpful comment
@rmothukuru is the Tensorflow Serving team still unable to reproduce this issue?
We also have OOM issues with tensorflow-serving on Docker/Kubernetes. We have observed that alternative malloc implementations such as tcmalloc perform better when combined with batching. Regardless, it is concerning to us that we need to plan for serving instances to restart after a certain number of predictions.
It would be helpful if you could share an example that does not have this issue, as it has been very hard for us to find a configuration that does not leak.