Serving: Load-/Performancetest methodology
/area test-and-release
I'm currently working on some basic performance test-scenarios, which are geared towards asserting the observed performance of the autoscaler.
As one of the autoscaler goals is to have "Establish canonical load test scenarios" and "Reproducable load tests" I'd like to have a discussion on which tooling to use and how to report meaningful data.
For example, one of my crude preliminary tests is implemented via wrk (to generate load) which is then run via a job on the cluster under test. It produces a workload with a predefined concurrency. A reporter is then consuming the event stream generated by Kubernetes to report on Pod startup times.
Ideally I can contribute tests like these here directly and that should be the goal. As soon as we have clarity on which tools to use best and how those tests should be setup, I'll gladly do this.
Any existing opinions on how to do that kind of testing?
 markusthoemmes
All 11 comments
/assign @bobcatfish @fejta @adrcunha
Who all probably have much more enlightened suggestions than I about testing.
/assign @josephburnett
Because autoscaling
 evankanderson
on 11 Jun 2018
evankanderson
on 11 Jun 2018
/assign @markusthoemmes
Because he has the baton
evankanderson
on 11 Jun 2018
/kind feature
evankanderson
on 22 Jun 2018
Here's a first stab at implementing an initial blackbox end-to-end test, which is focused on the scale-up speed of the system:
Summary
- Output cluster information via
kubectlcommands - Apply app to test (
kubectl apply -f test.yml). The app sleeps for a defined amount of time and returns serversidestartTimestamp,endTimestamp. The app runs in SingleConcurrency to stress the scalability concern. - Run a job that runs a
wrk2script at a fixed concurrency, which logs all responses so they can be inspected asynchronously - Inspect the returned results and return a test-summary that contains
maximum scaleandtime-to-scale
Detailed test description
1. Output cluster information:
example:
KUBERNETES VERSION: v1.10.3-2+c8f1f59d8d233c

NODE CAPACITY
NAME            KUBELET                    KERNEL              OS                   CPUs      MEMORY
10.114.160.67   v1.10.1-2+7d2976e4bcbeb9   4.4.0-116-generic   Ubuntu 16.04.4 LTS   4         16431420Ki
10.114.160.71   v1.10.1-2+7d2976e4bcbeb9   4.4.0-116-generic   Ubuntu 16.04.4 LTS   4         16431420Ki
10.114.160.76   v1.10.1-2+7d2976e4bcbeb9   4.4.0-116-generic   Ubuntu 16.04.4 LTS   4         16431420Ki
10.114.160.83   v1.10.1-2+7d2976e4bcbeb9   4.4.0-116-generic   Ubuntu 16.04.4 LTS   4         16431420Ki
10.115.25.134   v1.10.1-2+7d2976e4bcbeb9   4.4.0-116-generic   Ubuntu 16.04.4 LTS   4         16427964Ki
10.115.25.143   v1.10.1-2+7d2976e4bcbeb9   4.4.0-116-generic   Ubuntu 16.04.4 LTS   4         16427964Ki
10.115.25.170   v1.10.1-2+7d2976e4bcbeb9   4.4.0-116-generic   Ubuntu 16.04.4 LTS   4         16427964Ki
10.115.25.208   v1.10.1-2+7d2976e4bcbeb9   4.4.0-116-generic   Ubuntu 16.04.4 LTS   4         16427964Ki
10.115.25.248   v1.10.1-2+7d2976e4bcbeb9   4.4.0-116-generic   Ubuntu 16.04.4 LTS   4         16431420Ki
10.115.25.250   v1.10.1-2+7d2976e4bcbeb9   4.4.0-116-generic   Ubuntu 16.04.4 LTS   4         16431420Ki
This should be a general script to run before we run any tests to automatically gather all the information one might be interested in when comparing test runs.
2. Apply the application under test:
In my case, I wrote a simple hello-world application which sleeps for a given amount of time. That amount of time is definable via a query parameter. This can be used to adjust the granularity of the test and make it more tolerant towards a badly performing load producer or time skew on different workers. The default will be 1 second of sleep.
Furthermore, the application returns the server-side beginning and end-timestamp of the request. This can be inspected later to determine the observed concurrency.
Each startingTimestamp is a +1 to the observed concurrency, while each endingTimestamp is a -1. If you order all timestamps and graph each change in concurrency you'll get a graph like the one shown here:
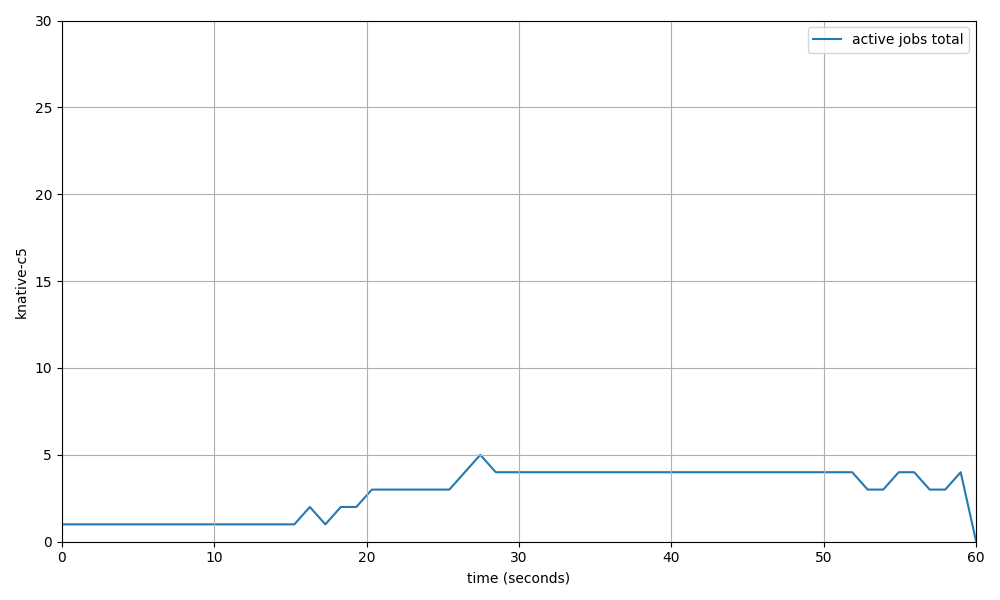
3. Run the test:
Running the test means setting up a job inside the kubernetes cluster, which runs wrk2 with the defined concurrency. wrk2 is scripted via LUA to log all successful responses to a file. That file is printed afterwards to extract the data to produce a summary + graph.
4. Produce the summary:
The graph should look like above, the summary should be something like:
duration: 1 minute
target scale: 5

SCALING METRICS:
maximum scale: 4
time to scale: 10.45s

PERFORMANCE METRICS: (optional)
througput: 150tps
latency:
  - 50%: 100ms
  - 75%: 130ms
  - 90%: 150ms
  - 95%: ...
The graph is currently produced via a python script. I'm open to rewrite that in go or something else if someone objects to doing it that way.
markusthoemmes
on 26 Jun 2018
@markusthoemmes, this is lovely. plz pr me teh codez
 josephburnett
on 27 Jun 2018
josephburnett
on 27 Jun 2018
plz pr me teh codez
Can you send a pull request so I can look at the code in more detail?
josephburnett
on 27 Jun 2018
This is cool. CCing @jessiezcc because she was planning some work in this area.
 adrcunha
on 27 Jun 2018
adrcunha
on 27 Jun 2018
What I mentioned on the scaling WG call today is that we could look at integrating whatever test harness metric output into a format that can be ingested by http://perf-dash.k8s.io/
 jeremyeder
on 27 Jun 2018
jeremyeder
on 27 Jun 2018
/unassign
Not working on this currently.
markusthoemmes
on 8 Nov 2018
we have a way for writing and displaying perf tests https://github.com/knative/serving/blob/master/test/performance/README.md
@markusthoemmes do we need something else here or we can close this?
 srinivashegde86
on 12 Feb 2019
srinivashegde86
on 12 Feb 2019
We can close this!
markusthoemmes
on 13 Feb 2019
Related issues
josephburnett
·
6Comments
 vagababov
·
3Comments
vagababov
·
3Comments
 tcnghia
·
3Comments
tcnghia
·
3Comments
 ZhiminXiang
·
3Comments
ZhiminXiang
·
3Comments
 greghaynes
·
6Comments
greghaynes
·
6Comments
Most helpful comment
Here's a first stab at implementing an initial blackbox end-to-end test, which is focused on the scale-up speed of the system:
Summary
kubectlcommandskubectl apply -f test.yml). The app sleeps for a defined amount of time and returns serversidestartTimestamp,endTimestamp. The app runs in SingleConcurrency to stress the scalability concern.wrk2script at a fixed concurrency, which logs all responses so they can be inspected asynchronouslymaximum scaleandtime-to-scaleDetailed test description
1. Output cluster information:
example:
This should be a general script to run before we run any tests to automatically gather all the information one might be interested in when comparing test runs.
2. Apply the application under test:
In my case, I wrote a simple hello-world application which sleeps for a given amount of time. That amount of time is definable via a query parameter. This can be used to adjust the granularity of the test and make it more tolerant towards a badly performing load producer or time skew on different workers. The default will be 1 second of sleep.
Furthermore, the application returns the server-side beginning and end-timestamp of the request. This can be inspected later to determine the observed concurrency.
Each
startingTimestampis a+1to the observed concurrency, while eachendingTimestampis a-1. If you order all timestamps and graph each change in concurrency you'll get a graph like the one shown here:3. Run the test:
Running the test means setting up a job inside the kubernetes cluster, which runs
wrk2with the defined concurrency.wrk2is scripted via LUA to log all successful responses to a file. That file is printed afterwards to extract the data to produce a summary + graph.4. Produce the summary:
The graph should look like above, the summary should be something like:
The graph is currently produced via a python script. I'm open to rewrite that in go or something else if someone objects to doing it that way.