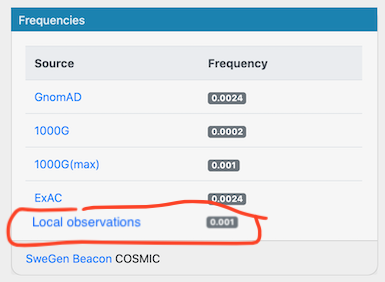
Scout: Local observations visualization displayed as frequencies.
From the notes of the last user meeting (#1679)
 northwestwitch
All 8 comments
@mikaell this one perhaps. It's about converting the loqus db observations in the same format as the other frequencies.
northwestwitch
on 6 Jul 2020
Ok. Already I'll start looking into this.
 mikaell
on 6 Jul 2020
mikaell
on 6 Jul 2020
This is my proposed implementation -add an extra entry in the Frequencies table.
How are frequencies calculated? (@dnil)
mikaell
on 6 Jul 2020
When you find out what exactly is that number (Total nr.) you could perhaps add a tooltip to the text to clarify what the field is..
northwestwitch
on 6 Jul 2020
Hm, it isn’t supposed to be? Our locals are generally count based. Obviously one can show counts divided by chromosomes seen, but it is not clear that it will converge on population frequency or what the bias will be. If we must, at least show both counts and ratio, possibly via tooltip as C suggest? @moonso is perhaps a non-vacation goto person for local counts? 😊
 dnil
on 6 Jul 2020
dnil
on 6 Jul 2020
Ok, I'll prepare the code infrastructure in the mean time.
mikaell
on 7 Jul 2020
Hi, we should not display it as frequencies since they are not frequencies. For example we count a variant only once per family regardless of the number of individuals that holds the variant in that family. For more information about this read the paper 😄
Edit. To be more clear, showing it as a frequency would only be misguiding so I do not think we should do that
 moonso
on 7 Jul 2020
moonso
on 7 Jul 2020
For more information about this read the paper
😆
But then problem fixed. Thanks for the explanation @moonso (and congrats for the paper!)
northwestwitch
on 7 Jul 2020
Related issues
 ielvers
·
3Comments
dnil
·
3Comments
ielvers
·
3Comments
dnil
·
3Comments
 hassanfa
·
3Comments
hassanfa
·
3Comments
 4WGH
·
3Comments
4WGH
·
3Comments
 andreaswallberg
·
4Comments
andreaswallberg
·
4Comments
Most helpful comment
😆
But then problem fixed. Thanks for the explanation @moonso (and congrats for the paper!)