Realm-js: Infinite loop of "callbacks_poll"
So, it's YOU! :-)
I've been seeing this endless loop of "callbacks_poll" that is killing my debugging performance and pleasure.
Goals
Get rid of the endless loop of callbacks_poll in my networking request pane and the associated memory leak
Expected Results
No callbacks_poll visible and no memory leak
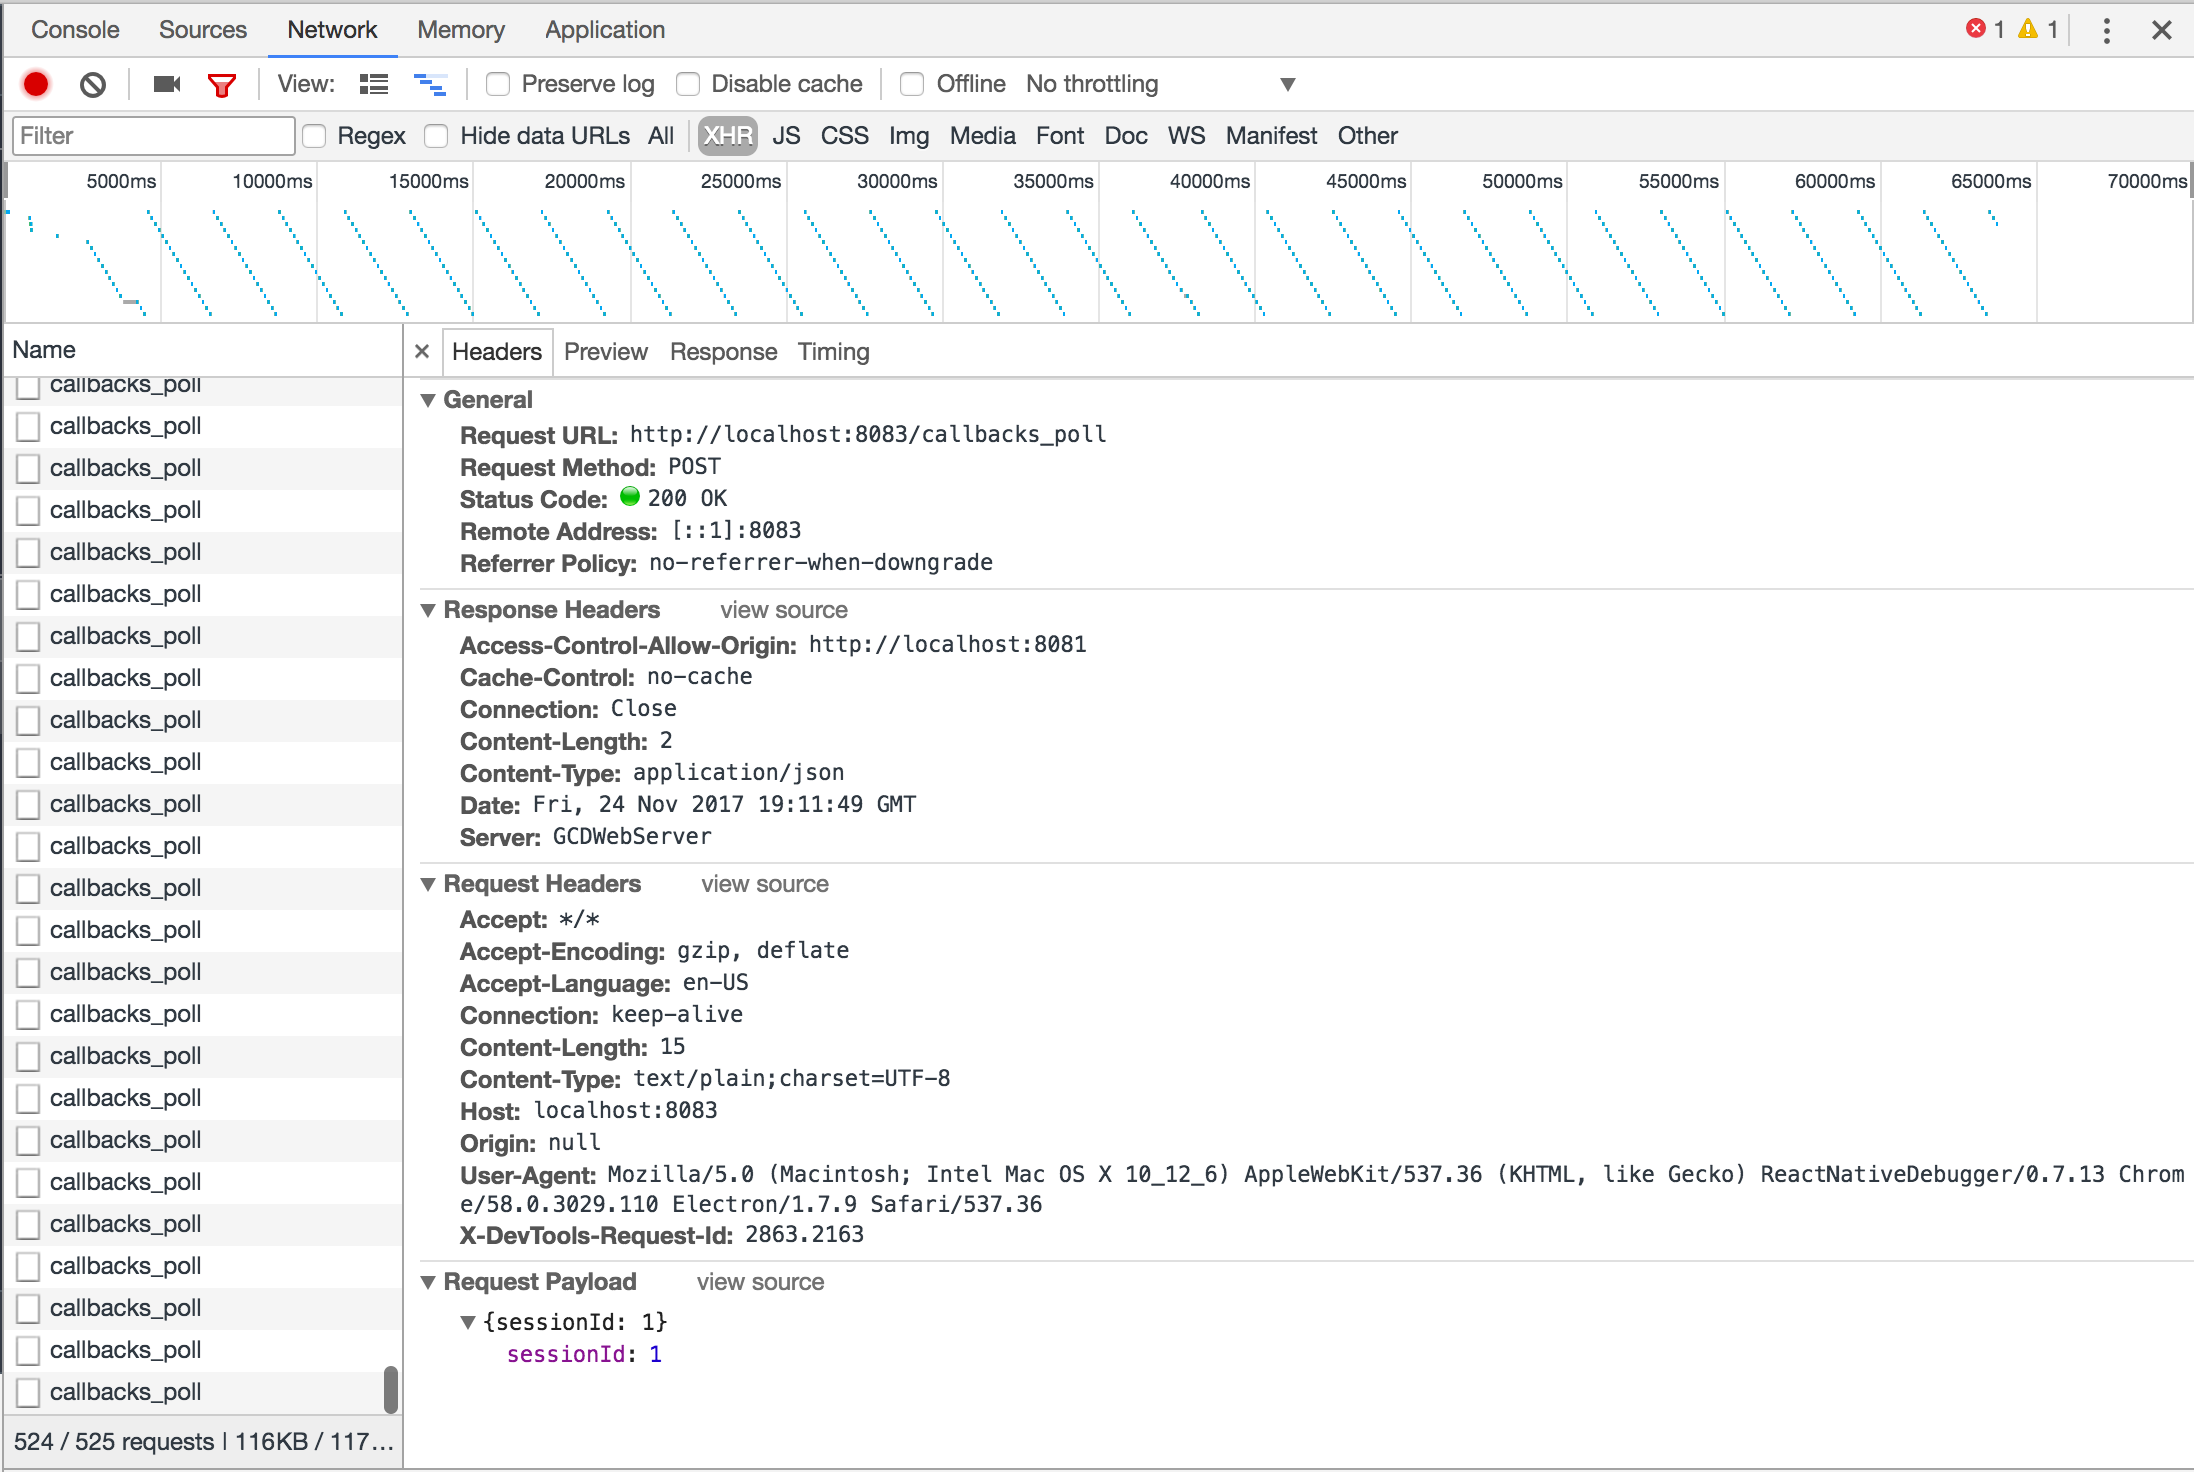
Actual Results
See image. Endless loop. Makes it hard to identify individual network requests and there seems to be an associated memory leak, although I can't guarantee that it is related.
Steps to Reproduce
Not sure. This happened after I upgraded Realm but I didn't realize it at the time. Here's my Realm setup
Code Sample
class User {}
User.schema = {
    name: 'User',
    primaryKey: 'id',
    properties: {
        id: { type: 'int' },
        nickName: { type: 'string' },
        displayName: { type: 'string' },
        title: { type: 'string', optional: true },
        email: { type: 'string' },
        photo: { type: 'string', optional: true },
        photoDir: { type: 'string' },
        gender: { type: 'string' },
        refId: { type: 'string', optional: true },
        sessionToken: { type: 'string', optional: true }
    }
};

export default User;
import Realm from 'realm';
import { logoutUser } from 'modules/login/actions/loginActions';
import { delToken, clearTokens } from 'modules/login/actions/oauthActions';
import * as config from 'config';
import { dbg } from 'utils';
import UserRecord from 'data/records/userRecord';
import {
    EMIT_USER,
    GET_USER,
    STORE_USER,
    DEL_USER,
    CLEAR_ALL
} from '../userActionTypes';
import User from '../schemas/userDbSchema';

const realmSettings = {
    schema: [User],
    schemaVersion: 1,
    migration: (oldRealm, newRealm) => {
        // only apply this change if upgrading to schemaVersion 1
        /* if (oldRealm.schemaVersion < 1) {
          const oldObjects = oldRealm.objects('User');
          const newObjects = newRealm.objects('User');

          // loop through all objects and set the name property in the new schema
          for (let i = 0; i < oldObjects.length; i++) {
            newObjects[i].sessionToken = undefined;
          }
        } */
    }
};

const realm = new Realm(realmSettings);

export function getUser() {
    return {
        type: GET_USER
    };
}

export function emitUser(user) {
    return {
        type: EMIT_USER,
        user
    };
}

export function loadUser(userId) {
    return async (dispatch, getState) => {
        dispatch(getUser());

        const sessionUser = getState().users.sessionUser;

        if (sessionUser && sessionUser.id === userId) return sessionUser;

        let user = null;

        if (userId) user = realm.objectForPrimaryKey('User', userId);
        else {
            const users = realm.objects('User');

            if (users.length > 0) user = users.values().next().value;
        }

        dbg(user ? `User ${user.id} loaded` : 'No user loaded');

        if (user) {
            dispatch(emitUser(new UserRecord(user)));

            return user;
        }

        return null;
    };
}
Version of Realm and Tooling
- Realm JS SDK Version: 2.0.11
- Node or React Native: React Native 0.49.5
- Client OS & Version: Mac Os
- Which debugger for React Native: React-Native-Debugger or Chrome
 mschipperheyn
All 63 comments
Thanks for reporting. In version 2.0.7 we fixed a bug in Realm.open (hanging in RN debugging). In order to see if that fix had anything to do with it, can I ask you to try with 2.0.6?
 kneth
on 29 Nov 2017
kneth
on 29 Nov 2017
So, the infinite loop network log doesn't occur on 2.0.6.
I also had a go at 2.0.7, and that's where it starts occurring.
mschipperheyn
on 29 Nov 2017
@mschipperheyn @kneth the callbacks_poll method reinvoke is intentional. This is used only in debugging to be able to support handling arbitrary callbacks called from the device side. This method is called only if there are no invocations of any method/get property etc for specified small amount of time from the application.
Our current implementation is using http requests to communicate with the debugger backend, so constant pulling is needed when arbitrary callbacks need to be invoked.
We can improve this in the future by using websockets, but it's not a high priority right now. We have other issues with performance we are working on to fix (like #491)
cheers
 blagoev
on 29 Nov 2017
blagoev
on 29 Nov 2017
@blagoev I think it's a high priority issue because the chrome debugger turn very slow and we almost cannot do any thing. Thanks.
 pkunetspy
on 30 Nov 2017
pkunetspy
on 30 Nov 2017
@blagoev network debugging is a nightmare with this constant polling, not the mention the network logging of the polling itself growths infinitely as well and eventually crashes the debugger or brings the computer to a halt. This can be filtered out by using a regex in the logging, but this has to be done every time you restart the debugger which is a poor experience.
Perhaps this "specified small" amount of time can be made configurable, so that we can just set it to a much larger value and take any associated consequences for granted?
mschipperheyn
on 30 Nov 2017
i changed this in 'lib/browser/rcp.js' at line 292 (v2.0.12)
pollTimeoutId = setTimeout(() => sendRequest('callbacks_poll'), 60000);
@blagoev what is arbitrary callback and when it is needed ?
 d3v2a
on 8 Dec 2017
d3v2a
on 8 Dec 2017
Guys by arbitrary callback I mean callbacks that can be fired at any point of time. For example one such callback are the callbacks for change notifications. The debugger works by piggy backing on normal debugger commands but if there are no invocations from the client side the debugger invokes this poll request, so callbacks are not left pending. This poll callback should happen only when there are no method invocations/property getters/setters etc to the debugger backend.
Now If we make the debugger use websockets then this constant polling will go away and you will not see it anymore. It's priority is measured against many other important fixes we need to go through hence we decided to split the issues when we fixed the support for arbitrary callbacks.
If you are experiencing slow debugger there is bigger problem with it we outlined here #491
blagoev
on 12 Dec 2017
@blagoev Yeah, websockets would seem to be the way to go. For me, staying on 2.0.6 is an acceptable workaround for now. Thanks for being open about this.
mschipperheyn
on 12 Dec 2017
@blagoev could we perhaps create a module for ReactNative's CxxBridge and use the React Native bridge to post callbacks to the debugger because it already sets up a websocket?
 fealebenpae
on 12 Dec 2017
fealebenpae
on 12 Dec 2017
@fealebenpae Yes we could do that. it's a matter of priorities to spend the some time on it.
blagoev
on 13 Dec 2017
Hi, any news on that? I'm currently using 2.2.12 and these callbacks_poll requests flooding my network requests.
Thanks
 mutale
on 23 Feb 2018
mutale
on 23 Feb 2018
+1
 Uysim
on 20 Mar 2018
Uysim
on 20 Mar 2018
+1
 comann
on 3 Apr 2018
comann
on 3 Apr 2018
+1
 AlexisLeon
on 10 Apr 2018
AlexisLeon
on 10 Apr 2018
+1
 sohobloo
on 14 Apr 2018
sohobloo
on 14 Apr 2018
+1
 sbayd
on 16 Apr 2018
sbayd
on 16 Apr 2018
+1
 iremercan
on 16 Apr 2018
iremercan
on 16 Apr 2018
+1
 burak-koksal-jotform
on 16 Apr 2018
burak-koksal-jotform
on 16 Apr 2018
+1
 cihanjotform
on 16 Apr 2018
cihanjotform
on 16 Apr 2018
+1, any news on that? i find it when i use redux-saga
 yiky84119
on 18 Apr 2018
yiky84119
on 18 Apr 2018
Please fix.
 mdgrech
on 25 Apr 2018
mdgrech
on 25 Apr 2018
@alazier @appden pls help..
AlexisLeon
on 25 Apr 2018
Unfortunately we have had other priorities lately. I'll take it up with the rest of the team as a more general prioritization of debugging experience.
kneth
on 26 Apr 2018
This is what the logs come out as:
Connection[4]: Will emit a ping in 0 milliseconds
Connection[3]: Received: PONG(timestamp=775651006)
Connection[3]: Will emit a ping in 0 milliseconds
Connection[4]: Sending: PING(timestamp=775651007, rtt=2)
Connection[3]: Sending: PING(timestamp=775651007, rtt=1)
Connection[3]: Received: PONG(timestamp=775651007)
Connection[3]: Will emit a ping in 0 milliseconds
Connection[3]: Sending: PING(timestamp=775651008, rtt=1)
Connection[4]: Received: PONG(timestamp=775651007)
Connection[4]: Will emit a ping in 0 milliseconds
Connection[4]: Sending: PING(timestamp=775651009, rtt=2)
Connection[4]: Received: PONG(timestamp=775651009)
Connection[4]: Will emit a ping in 0 milliseconds
Connection[4]: Sending: PING(timestamp=775651010, rtt=1)
Connection[3]: Received: PONG(timestamp=775651008)
Connection[3]: Will emit a ping in 0 milliseconds
Connection[3]: Sending: PING(timestamp=775651010, rtt=2)
Connection[3]: Received: PONG(timestamp=775651010)
Connection[3]: Will emit a ping in 0 milliseconds
Connection[4]: Received: PONG(timestamp=775651010)
Connection[4]: Will emit a ping in 0 milliseconds
Connection[3]: Sending: PING(timestamp=775651011, rtt=1)
Connection[4]: Sending: PING(timestamp=775651011, rtt=1)
Connection[4]: Received: PONG(timestamp=775651011)
Connection[4]: Will emit a ping in 0 milliseconds
Connection[4]: Sending: PING(timestamp=775651013, rtt=1)
Connection[3]: Received: PONG(timestamp=775651011)
Connection[3]: Will emit a ping in 0 milliseconds
Connection[3]: Sending: PING(timestamp=775651013, rtt=2)
Connection[3]: Received: PONG(timestamp=775651013)
Connection[3]: Will emit a ping in 0 milliseconds
Connection[3]: Sending: PING(timestamp=775651014, rtt=1)
Connection[4]: Received: PONG(timestamp=775651013)
Connection[4]: Will emit a ping in 0 milliseconds
Connection[4]: Sending: PING(timestamp=775651014, rtt=1)
Connection[3]: Received: PONG(timestamp=775651014)
Connection[3]: Will emit a ping in 0 milliseconds
Connection[3]: Sending: PING(timestamp=775651015, rtt=1)
Connection[4]: Received: PONG(timestamp=775651014)
Connection[4]: Will emit a ping in 0 milliseconds
Connection[4]: Sending: PING(timestamp=775651016, rtt=1)
Connection[3]: Received: PONG(timestamp=775651015)
Connection[3]: Will emit a ping in 0 milliseconds
Connection[3]: Sending: PING(timestamp=775651016, rtt=1)
Connection[4]: Received: PONG(timestamp=775651016)
Connection[4]: Will emit a ping in 0 milliseconds
Connection[4]: Sending: PING(timestamp=775651017, rtt=1)
Connection[3]: Received: PONG(timestamp=775651016)
Connection[3]: Will emit a ping in 0 milliseconds
Connection[3]: Sending: PING(timestamp=775651018, rtt=2)
Connection[4]: Received: PONG(timestamp=775651017)
Connection[4]: Will emit a ping in 0 milliseconds
Connection[4]: Sending: PING(timestamp=775651018, rtt=1)
Connection[3]: Received: PONG(timestamp=775651018)
Connection[3]: Will emit a ping in 0 milliseconds
Connection[4]: Received: PONG(timestamp=775651018)
Connection[4]: Will emit a ping in 0 milliseconds
Connection[3]: Sending: PING(timestamp=775651019, rtt=1)
Connection[4]: Sending: PING(timestamp=775651020, rtt=1)
Connection[4]: Received: PONG(timestamp=775651020)
Connection[4]: Will emit a ping in 0 milliseconds
Connection[4]: Sending: PING(timestamp=775651021, rtt=0)
Connection[3]: Received: PONG(timestamp=775651019)
Connection[3]: Will emit a ping in 0 milliseconds
Connection[3]: Sending: PING(timestamp=775651021, rtt=2)
Connection[4]: Received: PONG(timestamp=775651021)
Connection[4]: Will emit a ping in 0 milliseconds
Connection[4]: Sending: PING(timestamp=775651022, rtt=1)
Connection[3]: Received: PONG(timestamp=775651021)
Connection[3]: Will emit a ping in 0 milliseconds
Connection[3]: Sending: PING(timestamp=775651022, rtt=1)
Connection[4]: Received: PONG(timestamp=775651022)
Connection[4]: Will emit a ping in 0 milliseconds
Connection[4]: Sending: PING(timestamp=775651024, rtt=1)
Connection[3]: Received: PONG(timestamp=775651022)
Connection[3]: Will emit a ping in 0 milliseconds
Connection[3]: Sending: PING(timestamp=775651024, rtt=2)
Connection[4]: Received: PONG(timestamp=775651024)
Connection[4]: Will emit a ping in 0 milliseconds
Connection[4]: Sending: PING(timestamp=775651025, rtt=1)
Connection[3]: Received: PONG(timestamp=775651024)
Connection[3]: Will emit a ping in 0 milliseconds
Connection[3]: Sending: PING(timestamp=775651026, rtt=2)
Connection[4]: Received: PONG(timestamp=775651025)
Connection[4]: Will emit a ping in 0 milliseconds
Connection[4]: Sending: PING(timestamp=775651027, rtt=2)
Connection[3]: Received: PONG(timestamp=775651026)
Connection[3]: Will emit a ping in 0 milliseconds
Connection[3]: Sending: PING(timestamp=775651027, rtt=1)
Connection[4]: Received: PONG(timestamp=775651027)
Connection[4]: Will emit a ping in 0 milliseconds
Connection[4]: Sending: PING(timestamp=775651028, rtt=1)
Connection[3]: Received: PONG(timestamp=775651027)
Connection[3]: Will emit a ping in 0 milliseconds
Connection[3]: Sending: PING(timestamp=775651029, rtt=2)
Connection[4]: Received: PONG(timestamp=775651028)
Connection[4]: Will emit a ping in 0 milliseconds
Connection[4]: Sending: PING(timestamp=775651030, rtt=2)
Connection[3]: Received: PONG(timestamp=775651029)
Connection[3]: Will emit a ping in 0 milliseconds
Connection[3]: Sending: PING(timestamp=775651031, rtt=2)
Connection[4]: Received: PONG(timestamp=775651030)
Connection[4]: Will emit a ping in 0 milliseconds
Connection[4]: Sending: PING(timestamp=775651033, rtt=3)
Connection[3]: Received: PONG(timestamp=775651031)
Connection[3]: Will emit a ping in 0 milliseconds
Connection[3]: Sending: PING(timestamp=775651033, rtt=2)
Connection[4]: Received: PONG(timestamp=775651033)
Connection[4]: Will emit a ping in 0 milliseconds
Connection[4]: Sending: PING(timestamp=775651035, rtt=2)
Connection[3]: Received: PONG(timestamp=775651033)
Connection[3]: Will emit a ping in 0 milliseconds
Connection[3]: Sending: PING(timestamp=775651036, rtt=3)
Connection[4]: Received: PONG(timestamp=775651035)
Connection[4]: Will emit a ping in 0 milliseconds
Connection[4]: Sending: PING(timestamp=775651036, rtt=1)
Connection[3]: Received: PONG(timestamp=775651036)
Connection[3]: Will emit a ping in 0 milliseconds
Connection[3]: Sending: PING(timestamp=775651037, rtt=1)
Connection[4]: Received: PONG(timestamp=775651036)
Connection[4]: Will emit a ping in 0 milliseconds
Connection[4]: Sending: PING(timestamp=775651037, rtt=1)
Connection[3]: Received: PONG(timestamp=775651037)
Connection[3]: Will emit a ping in 0 milliseconds
Connection[3]: Sending: PING(timestamp=775651038, rtt=1)
Connection[4]: Received: PONG(timestamp=775651037)
Connection[4]: Will emit a ping in 0 milliseconds
Connection[4]: Sending: PING(timestamp=775651039, rtt=2)
Connection[3]: Received: PONG(timestamp=775651038)
Connection[3]: Will emit a ping in 0 milliseconds
Connection[3]: Sending: PING(timestamp=775651040, rtt=1)
This seems to happen after keeping the connection open for a while. 1 - 3 minutes
Hope this helps
 guatedude2
on 3 Jun 2018
guatedude2
on 3 Jun 2018
Is there a resolution for this?
I am using Realm version 2.12.0 which is continuously making a request to http://localhost:8083/callbacks_poll. After 1313 requests, my application crashes.
 hannigand
on 6 Jul 2018
hannigand
on 6 Jul 2018
@hannigand Unfortunately I have no updates to share.
kneth
on 6 Jul 2018
something tells me this is related to ROS not Realm Client. I tested with an older version of ROS and it seems fine.
 ghost
on 6 Jul 2018
ghost
on 6 Jul 2018
@agsole-asapp Thanks for the feedback. The PING/PONG is done to check if network or ROS is alive but it can be that it has a bad effect on the debugger.
kneth
on 9 Jul 2018
This issue is causing my app to be almost impossible to work on; the app/debugger is painfully slow and crashes often. Please, _please_ prioritise fixing this!
 Billy-
on 17 Jul 2018
Billy-
on 17 Jul 2018
@kneth - Is there a need for PING/PONG if the Realm database is the only product being used? I'm not using ROS so I am just wondering what the point of having the checks are if I am only communicating with the on-device database.
hannigand
on 27 Jul 2018
@hannigand There should be no PING/PONG if you don't have a sync configuration (since there is no server to send them to). But there seems to be an issue with the device/debugger communication which is what the issue originally was about.
kneth
on 6 Aug 2018
@kneth I am using RealmJS v.2.14.2 on RN, just for internal DB / Persistence (no sync server) and I still have this issue on my debugger. Is that normal? Are you still working on a solution? The production build of the app will not have such weird behavior?
 pedrosimao
on 22 Aug 2018
pedrosimao
on 22 Aug 2018
anyone handle those?
 sivagao
on 23 Aug 2018
sivagao
on 23 Aug 2018
@pedrosimao The callback_poll is used in the communication between the debugger and the app on the device/emulator so you won't see it in production.
kneth
on 23 Aug 2018
Ok, thanks a lot!
pedrosimao
on 23 Aug 2018
I just deleted my comments as I found out my problem was not related to Realm.
Concerning callback_poll I have decided to go with realm v2.0.6 and the messages go away.
Do you have any major concern about using this version?
pedrosimao
on 25 Aug 2018
Hi! I've the same issue!
There's no other way for now than to downgrade to v2.0.6?
The app crashes very often and after only few minutes!
Thanks!
 mrigo
on 27 Aug 2018
mrigo
on 27 Aug 2018
Not that I know.
I am using v2.0.6 without any problem.
I think the problem is that Realm implements a sync feature and for that to work on debugger they have to check some API constantly.
They would do better using WebSocket, but I don't know if it is feasible on their side.
I think if you don't use functions that sync with a Realm server you will be good with a lower version.
pedrosimao
on 27 Aug 2018
Thanks @pedrosimao ,
I've downgraded realm to 2.0.6 but I'm continuing to have the same problem, also with cache cleaning and a fresh npm installation of modules...
mrigo
on 28 Aug 2018
@mrigo pretty strange. The messages disappeared to me when I downgraded to 2.0.6.
Try:
rm -rf node_modules
rm -rf ~/.rncache
also remove the .lock files then:
yarn install
then close all metro bundler terminals, delete app and build again...
pedrosimao
on 28 Aug 2018
@mrigo are you using Expo or ExpoKit? If you are you have to get rid of it.
pedrosimao
on 28 Aug 2018
2.0.6 is almost a year old, what are the implications of downgrading? At the time of recommendation (2nd comment), 2.0.6 was one version back.
hannigand
on 28 Aug 2018
@pedrosimao I've used react-native, no expo..
I've tried your advices, but nothing changed.. I'll return to the latest version..
mrigo
on 28 Aug 2018
@kneth in the iOS version the app continues to crash after few seconds, also doing nothing, I suppose because of this bug :(
Do you know if it will be fixed soon? I'm a little bit in hurry for a deploy in production and now I can't really work well :(
Sorry to bother you!
Thanks!
mrigo
on 28 Aug 2018
@kneth is there any other workaround that we can do to fix this issue (in the meantime)?.
Our app has come to the point of been unusable when debugger is attached. As you can imagine that's not a great place to be in. I appreciate you guys having higher priority issues than this, but this is a deal breaker for us. We are seriously considering taking out realm from our react-native app.
Any possible fix/workaround is highly appreciated
p.s: downgrading to 2.0.6 didn't work
 hdsenevi
on 14 Sep 2018
hdsenevi
on 14 Sep 2018
This is happening for me on react-native "56" and realm: "^2.15.3" as well as in "57.1.0" and realm: "^2.17.0"
This is causing the app to crash consistently when in debug mode.
This makes development very slow and unbearable.
@kneth any update on the state of this ticket? is it on the roadmap? is it in progress? any ETAs?
Thanks.
Edit: we opted to change the timeout as mentioned here to make development more bearable in debug mode.
 Eyesonly88
on 20 Sep 2018
Eyesonly88
on 20 Sep 2018
Unresponsiveness of the ream team makes this great idea and product a total crap :(
 rimallo
on 24 Sep 2018
rimallo
on 24 Sep 2018
Is this also the same when using Safari? See issue here
 bmunkholm
on 25 Sep 2018
bmunkholm
on 25 Sep 2018
I am also in a pickle. We cannot debug with Realm. Realm consistently is the stopping point for moving forward in our development. The sad part is that our application uses both Realm sync and non-synced. For testing, development, etc. we don't institute any listeners, we don't use a synced version of realm. I don't understand how this isn't somewhat of an important issue for the Realm team. It makes the product unusable.
Please - can you give any insight into Realm causing debugging to become unusable, or what steps can be taken to fix it?
 cyphire
on 24 Oct 2018
cyphire
on 24 Oct 2018
I'm sorry you feel this way, but comments reiterating things already mentioned are hardly productive. The link in the comment just above yours points to a thread where we've outlined the reasons for the current limitations and there have been proposed workarounds when debugging on iOS. Beyond that, there's not much we can do until Facebook improves their debugger support.
 nirinchev
on 24 Oct 2018
nirinchev
on 24 Oct 2018
facing same app crash issue on iOS. Its sad realm team isn't taking it seriorusly :(
 FirdousNath
on 9 Feb 2019
FirdousNath
on 9 Feb 2019
I would think that at least on the realm.io website there would be a big warning right at the top of the introduction that debugging becomes problematic when using this product.
I invested so much into using realm without the knowledge that I wouldn't be able to use JavaScript debugging anymore. On the bright side the fact that realm.io kills the development experience has made me into a much, much better programmer!
I use reactotron for logging and have to write really good code!
That being said it's a shame that this issue doesn't have a big warning banner displayed on the Realm.io website.
cyphire
on 9 Feb 2019
@FirdousNath We are taking it seriously but we are waiting for React Native to make the debugging experience easier (for us with C++ code).
@cyphire I see your point. Not that we try to hide it (https://realm.io/docs/javascript/latest/#chrome-debugging-is-slow).
kneth
on 11 Feb 2019
@kneth Well, to be honest, I would recommend changing the docs to 'forget about it' rather than 'it's slow' as there are a number of bugs (ranging from 3+ year old bugs #491 as mentioned by @blagoev as 'higher priority' in this very thread to ones that have a resolution but closed with no fix on your part; #1034 ) that make any sort of debugging in an app that includes realm extremely painful.
Also, what does 'higher priority' mean in this context - can we expect a fix for #491 within the next 3 years and perhaps this bug might be fixed within the next 6 years?
 matiasbuildops
on 14 Aug 2019
matiasbuildops
on 14 Aug 2019
@matiasbuildops v2.28.0 (from May 2019) improves the performance of debugging. We are very interested in learning what use cases v2.28.0 didn't improve.
kneth
on 14 Aug 2019
@kneth yeah, performance is okay but this problem right here persists, making it nigh impossible to debug any application with network activity (which in 2019 is pretty much any app) - debugger network tabs are full of callbacks_poll.
Also; see #1034 (or #2441 which seems to be a similar/same bug) as I mentioned in my earlier post which also persists to this day and the resolution is manually editing a .java file in node_modules.
matiasbuildops
on 14 Aug 2019
@matiasbuildops you are right. I gave up RealmJS because of those issues, after building my first app with it. The evolution of versions is quite slow, and if we are serious about our app, RealmJS is not an option. Maybe WatermelonDB would be a good fit for replacement, but I haven't really tried it yet.
pedrosimao
on 14 Aug 2019
Life becomes much easier when you change realm to any other persistant library. I can say realm is pretty good for native Apps but worse for hybrid apps :(
FirdousNath
on 14 Aug 2019
Still no solution of this problem!
 rassemdev
on 3 Feb 2020
rassemdev
on 3 Feb 2020
still no solution for this?!
 oojikoo
on 12 Aug 2020
oojikoo
on 12 Aug 2020
Any updates (or workarounds) on this folks?
 heytulsiprasad
on 22 Apr 2021
heytulsiprasad
on 22 Apr 2021
@heytulsiprasad After the issue was created, we batched the requests to lower the load. Unfortunately, it didn't solve all cases.
If it is possible for you, you can also debug your app using Safari (MacOS + iOS only) by enabling DevTools and connect to your device's JavaScript context.
kneth
on 22 Apr 2021
No I'm on windows, think I have to depend on Reactotron from now on. Thanks for being quick to respond, @kneth.
heytulsiprasad
on 23 Apr 2021
Related issues
 ashah888
·
3Comments
ashah888
·
3Comments
 Chris-Petty
·
3Comments
Chris-Petty
·
3Comments
 timanglade
·
3Comments
timanglade
·
3Comments
 texas697
·
3Comments
texas697
·
3Comments
 jmartindivmedianet
·
3Comments
jmartindivmedianet
·
3Comments
Most helpful comment
@blagoev I think it's a high priority issue because the chrome debugger turn very slow and we almost cannot do any thing. Thanks.