Realm-js: Unknown execution context on iOS Simulator with Remote JS Debugging
Goals
Debug code with Remote JS Debugging.Expected results
Debug code with Remote JS Debugging.Actual results
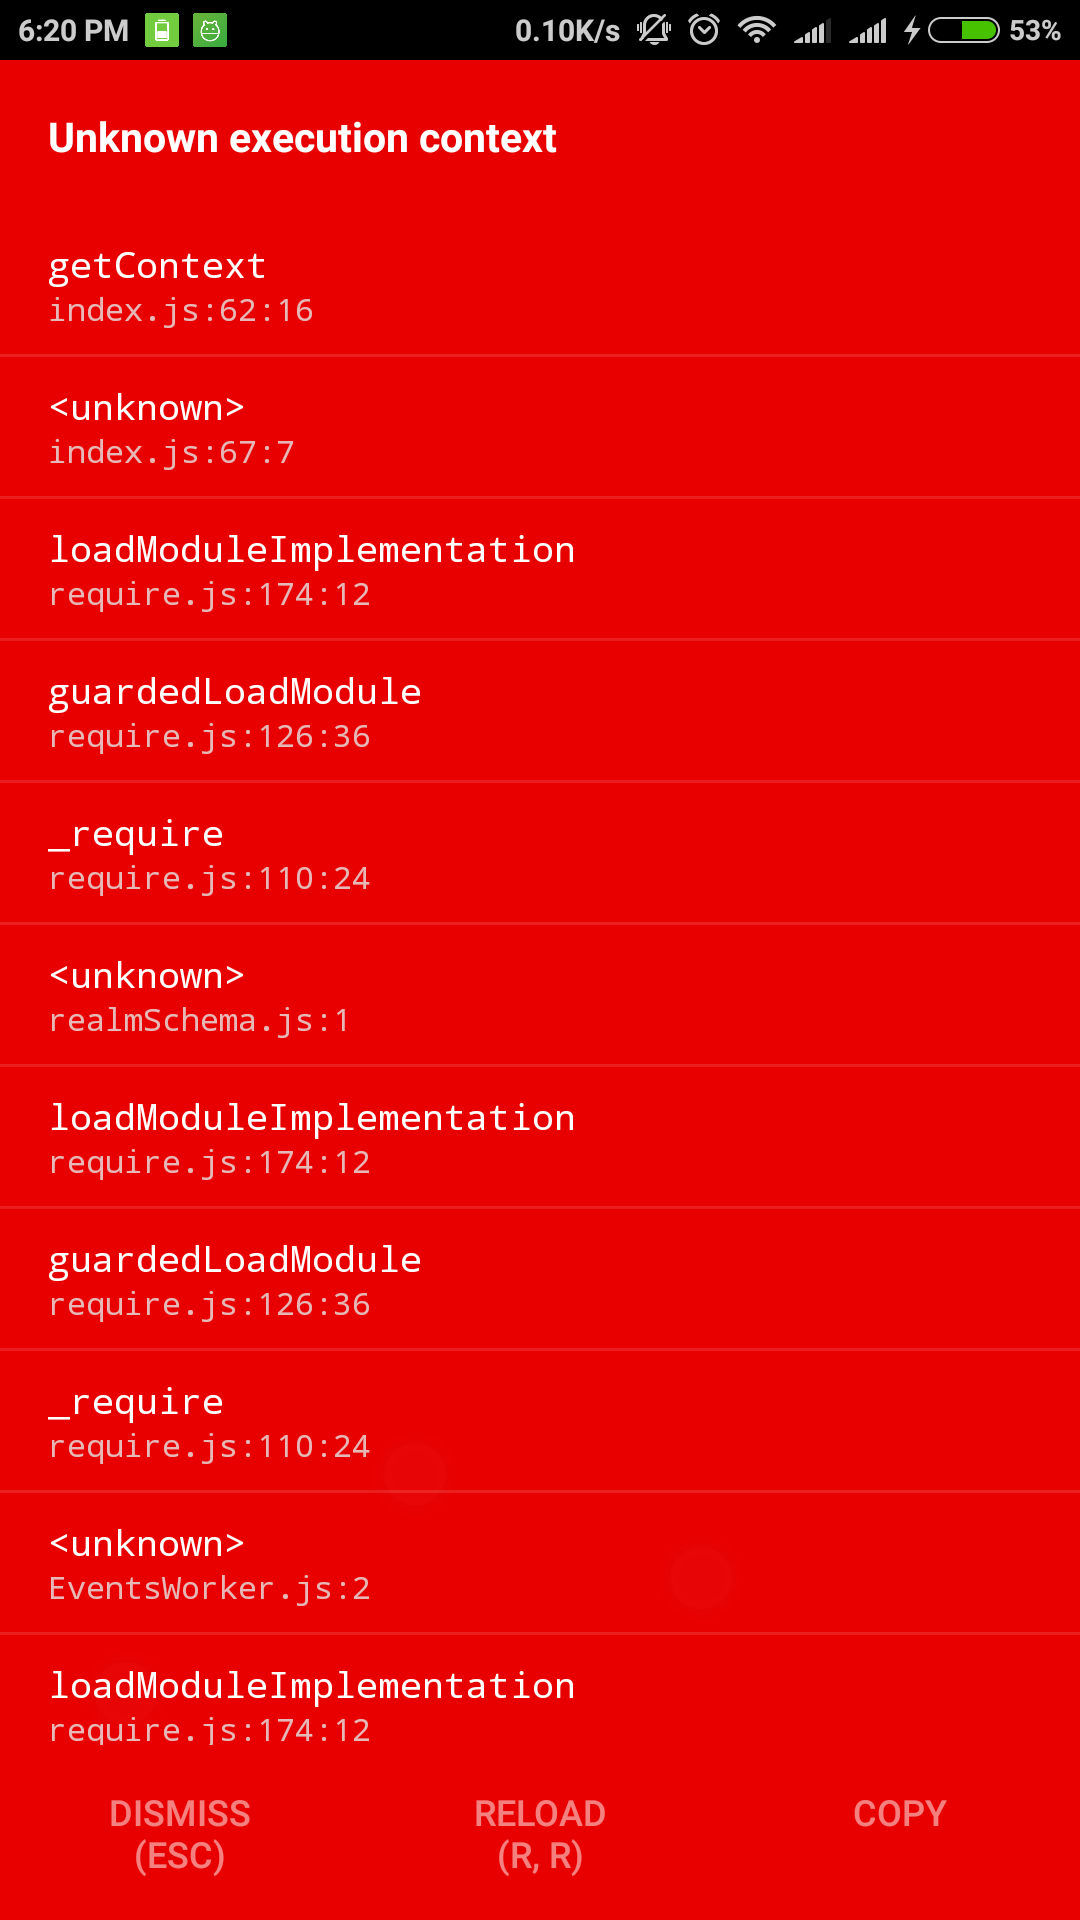
Red error screen with title 'Unknown execution context'

Steps to reproduce
- Create new project
react-native init TestRealm - Install Realm
npm install --save realmoryarn add realm - Link Realm
react-native link realm - In index.ios.js insert
import Realm from 'realm - Run code
react-native run-ios Enable Remote JS Debugging
Code sample that highlights the issue
https://github.com/aparedes/TestRealmVersion of Realm 1.0.2 / Xcode 8.2.1 / OSX 10.11.6
 aparedes
All 22 comments
Hi @aparedes did you run react-native link realm? This should be noted in the error message, I need to fix that..
 kristiandupont
on 8 Feb 2017
kristiandupont
on 8 Feb 2017
Yes, I did run react-native link realm.
I only get this error with the Remote JS Debugging activated, otherwise it works and I can write and read to/from the Realm database.
aparedes
on 8 Feb 2017
I see, in that case something else is wrong. Thank you for reporting.
kristiandupont
on 8 Feb 2017
I got this issue, too. Does it fix yet?
 peterng014
on 13 Feb 2017
peterng014
on 13 Feb 2017
I tried to reproduce this problem, but its to be running fine on my computer, tried both iPhone SE and iPhone 6 simulators.
Looking at the getContext here here, it seems to only work when user agent is set to contain Chrome. What debugger are you using? (@aparedes & @anonymoushitec)
Realm 1.0.2, Xcode 8.2.1, OSX 10.12.3
 jankjr
on 14 Feb 2017
jankjr
on 14 Feb 2017
I'm using Realm 1.0.2 / Xcode 8.2.1 / OSX 10.11.6 / React-Native 0.41.2 / Chrome 56
I can't reproduce it anymore, could be something with Xcode, that needed a restart or something.
aparedes
on 14 Feb 2017
I got this issue, too. if close the "Remote JS Debugging', it's works well.
 lnlfps
on 17 Feb 2017
lnlfps
on 17 Feb 2017
    if (typeof Realm !== 'undefined') {
        if (typeof navigator !== 'undefined' &&
            navigator.product === 'ReactNative') { // eslint-disable-line no-undef
            return 'reactnative';
        }

        return 'jscore';
    }
when Remote JS Debugging is off, the fragment return 'reactnative'. if remote js debugging is on, return undefined, so throw Error("Unknown execution context");
lnlfps
on 17 Feb 2017
I had the same, but tried again a few days later and it worked. I didn't change a thing.
aparedes
on 17 Feb 2017
Do you have the debugger with device toolbar on?![]()
It seems that is the one causing the problems. Or at least for me.
aparedes
on 17 Feb 2017
I have the same problem
what do you mean by the debugger with the (the picture you provided) on?
do we have different debuggers inside of Xcode?
 agahEbrahimi
on 14 Mar 2017
agahEbrahimi
on 14 Mar 2017
I mean in Chrome Dev Tools
aparedes
on 14 Mar 2017
When you are in the phone or simulator, you enable the debugging and it opens chrome. In chrome, if you press the device toolbar on it shows the web view in a "mobile" view. That seemed to be causing some issues for me. When it was disabled, it was acting normal
aparedes
on 14 Mar 2017
I am having the same issue. It only happens when I am debugging with Nuclide debugger. Works fine with dubugging off and when dubugging routed through Chrome.
 agersoncgps
on 18 May 2017
agersoncgps
on 18 May 2017
running react-native run-ios again, worked for me.
 sumesh1993
on 19 May 2017
sumesh1993
on 19 May 2017
Also getting this error when trying to run on (iOS) device. Haven't changed anything, but after working on a different project and trying to run this one again it just started failing :(
 chrise86
on 24 May 2017
chrise86
on 24 May 2017
I have the same problem with debugging off. Nothing works.
Tried the following:
- restart server
- react-native run-ios
- restart comp (mac osx)
- installing on fresh new react native project
- react-native link realm
Btw, using node version 6.10 as recommended in realm docs.
 oliviachang29
on 15 Jun 2017
oliviachang29
on 15 Jun 2017
@oliviachang29 I am sorry to hear that. If you are able to provide us with a repro-case in some form we can try taking a look at it.
kristiandupont
on 15 Jun 2017
Got it working after starting on a fresh new project. Not sure what specifically got it to work.
oliviachang29
on 21 Jun 2017
I am not running in debug mode. Still, I am getting the same
 sp-suresh
on 22 Jun 2017
sp-suresh
on 22 Jun 2017
Why is this closed? It's still a problem.
 camslabosz
on 22 Jul 2017
camslabosz
on 22 Jul 2017
I am also facing same problem even after running "react-native link realm"
 SaurabhKshirsagar
on 8 Dec 2017
SaurabhKshirsagar
on 8 Dec 2017
Related issues
 ashah888
·
3Comments
ashah888
·
3Comments
 CrystalRanita
·
3Comments
CrystalRanita
·
3Comments
 matt2legit
·
3Comments
matt2legit
·
3Comments
 timanglade
·
3Comments
timanglade
·
3Comments
 ugendrang
·
3Comments
ugendrang
·
3Comments
Most helpful comment
Do you have the debugger with device toolbar on?
It seems that is the one causing the problems. Or at least for me.