React-native-svg-charts: [Feature] Ability to use d3 time intervals instead of 'numberOfTicks' on xAxis (d3.timeDay.every(step))
Ability to use d3 time intervals instead of 'numberOfTicks' on xAxis (d3.timeDay.every(step)) :
It could be really helpful to use time intervals instead of d3 native ticks calculation, especially with xAxis time series.
I'm facing "an issue" with this prop. Ticks don't behave as I would concerning dates based axis, but where time intervals could be the best way to handle time series.
I need to provide consistent time intervals between every xAxis value and the 'numberOfTicks' prop doesn't provide a way to do it, while 'd3.timeDay.every' could be a really helpful workaround.
Actually, I need to display a date value "every four hours", but if I set the 'numberOfTicks' to '6' (6x4 = 24h) I get eight points on the xAxis :
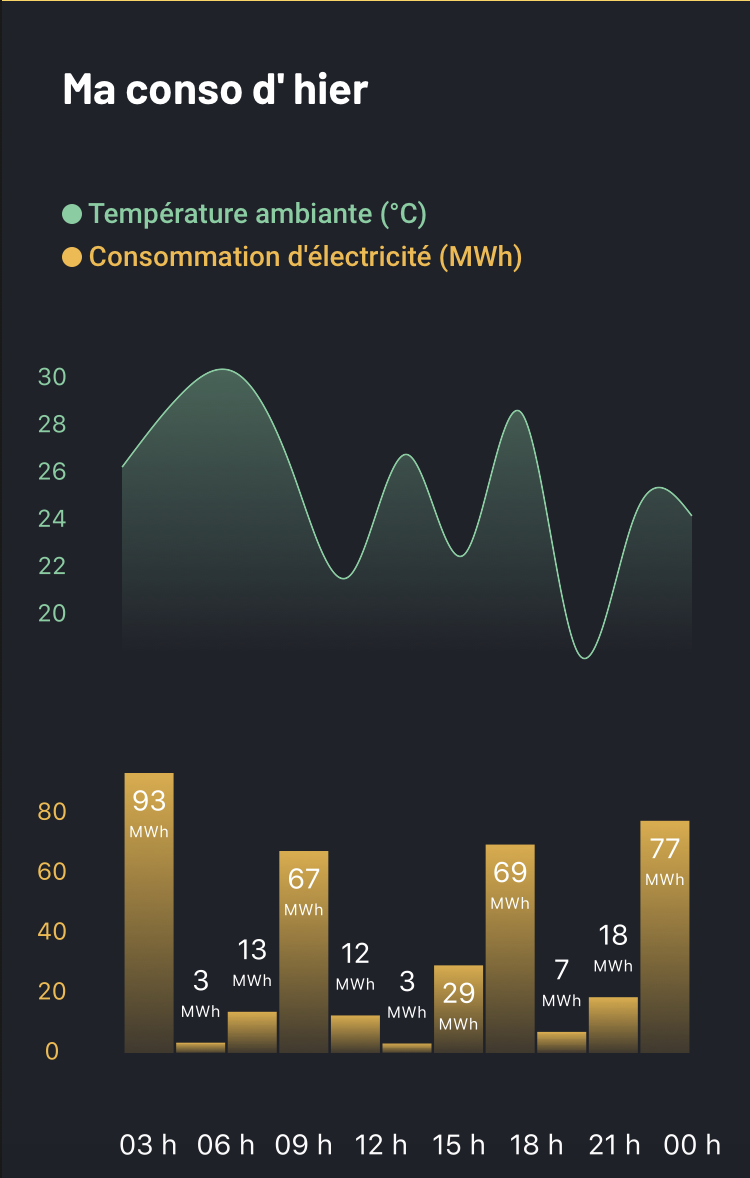
Here's a link to a post explaining this behaviour : http://www.d3noob.org/2016/08/changing-number-of-ticks-on-axis-in.html
By the way, huge thanks to @JesperLekland for this amazing work ! 🥇
 ajacquierbret
All 4 comments
Ok I found a workaround that doesn't involve time intervals, I just checked every label index and used a modulus (%) operator to "do nothing" with an index that wouldn't be equal to zero on a index / x = 0 division. But anayway, this feature request is still open because I think it could be great to have the ability to use d3 time intervals.
// Chart.tsx
formatXLabel={(label, index) =>
            `${getFormatedLabel(label, index)}`
          }
// Utils.tsx
export function getFormatedLabel(label, index) {
  if (index % 2) {
    return moment(label).format('HH [h]');
  } else {
    return '';
  }
}
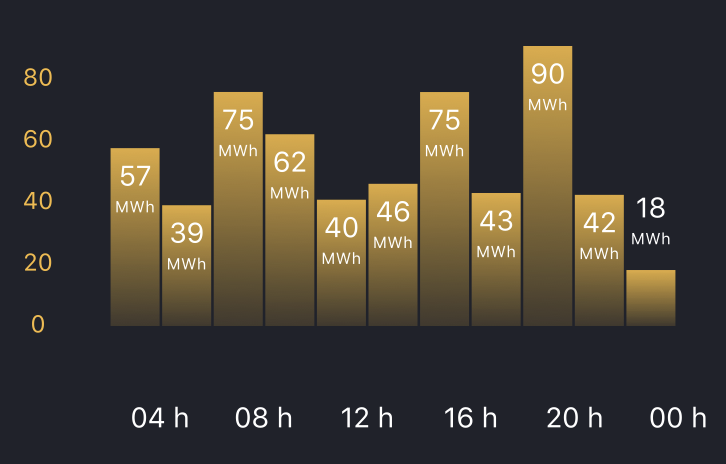
ajacquierbret
on 2 Jul 2020
I agree that d3.timeDay.every looks like a potential valuable addition. I don't maintain this library actively anymore though so I would love a PR with said feature. I'm glad you found a workaround in the meantime though, and thank you for sharing that with the community.
 JesperLekland
on 2 Jul 2020
JesperLekland
on 2 Jul 2020
I agree that
d3.timeDay.everylooks like a potential valuable addition. I don't maintain this library actively anymore though so I would love a PR with said feature. I'm glad you found a workaround in the meantime though, and thank you for sharing that with the community.
I'll try to do some PR if I can find the time to dig into this library, thanks a lot for your very fast answer ! You're welcome !
ajacquierbret
on 2 Jul 2020
Hi man, it's me again. I'm trying to make a barchart now and I'm having issues aligning the grid with the Y-Axis. Is there any tips you could give me?
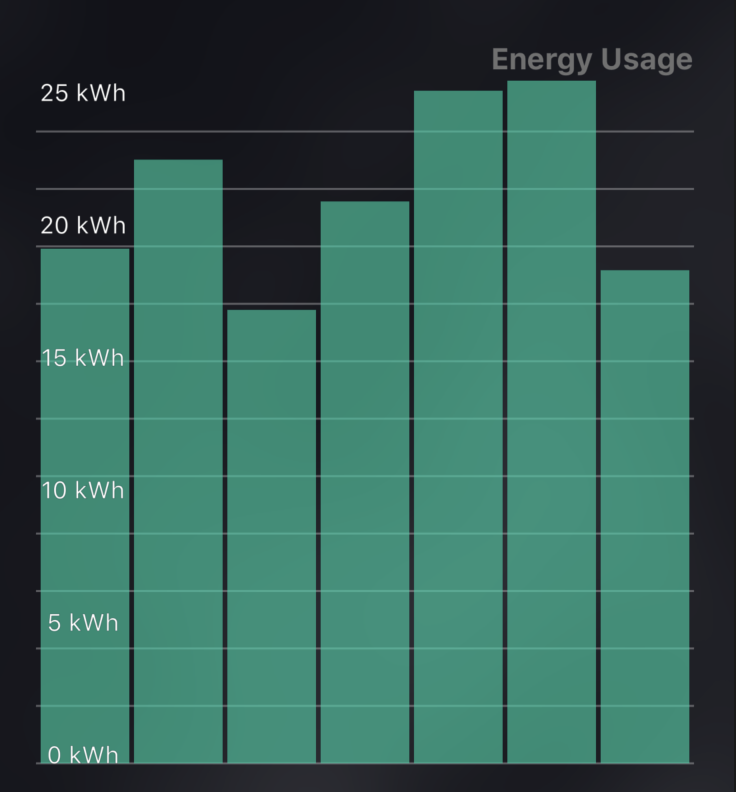
I have tried already all the ways to adjust the contentInset of the axis to be the same as the barchart but no luck.
 kchangch
on 1 Sep 2020
kchangch
on 1 Sep 2020
Related issues
 sagarc91
·
4Comments
sagarc91
·
4Comments
 jayesbe
·
5Comments
jayesbe
·
5Comments
 MithunKakkara
·
3Comments
MithunKakkara
·
3Comments
 mafiusu
·
3Comments
mafiusu
·
3Comments
 rohithnair1996
·
3Comments
rohithnair1996
·
3Comments
Most helpful comment
I'll try to do some PR if I can find the time to dig into this library, thanks a lot for your very fast answer ! You're welcome !