React-native-svg-charts: Line graph in a horizontal scrollView
Hey, not sure if this is the correct place to put this, but any help would be amazing.
I am trying to make a line graph in a horizontal scroll with a tag centered in the middle of the screen, that updates when a x point hits the line
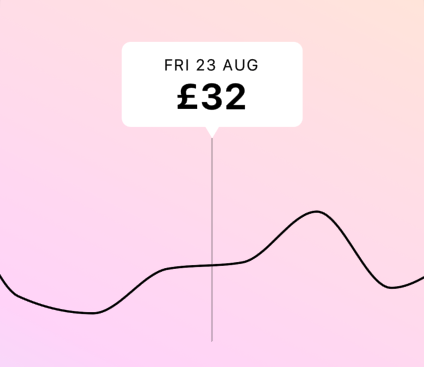
I have managed to get it scrolling in a horizontal scroll view, and updating the numbers. I did this calculating as so
if (event.nativeEvent.contentOffset.x > incrementWidth * (pinIndex + 1)) {
      this.setState({ pinIndex: this.state.pinIndex + 1 })
    } else if (event.nativeEvent.contentOffset.x < incrementWidth * (pinIndex)) {
      this.setState({ pinIndex: this.state.pinIndex -1 })
    }
Where increment width is calculated like so
const { dataPointsOnScreen } = this.state;
    const width = (DATA.length / dataPointsOnScreen) * Dimensions.get('window').width
    this.setState({ incrementWidth: width / DATA.length })
Only issue although the increments on the graph are the same distance unless specified on the component, the number I have calculated is out by a decimals so eventually the pin in the middle isn't in the correct place.
My question is, can you think of any better way of doing this?
Is there a way of specifying the increment distance, so I can make it a round number?
Thanks in advance.
Happy to share full source code as well if you wanted to take a crack.
 eikhunter
>All comments
Do you mind sharing the code for this? This is exactly what I'm trying to do. I can't even get it to scroll horizontally.
 WQvist
on 27 Mar 2020
WQvist
on 27 Mar 2020
Related issues
 themathiou
·
3Comments
themathiou
·
3Comments
 mafiusu
·
3Comments
mafiusu
·
3Comments
 escobar5
·
3Comments
escobar5
·
3Comments
 markedup
·
6Comments
markedup
·
6Comments
 rohithnair1996
·
3Comments
rohithnair1996
·
3Comments
Most helpful comment
Do you mind sharing the code for this? This is exactly what I'm trying to do. I can't even get it to scroll horizontally.