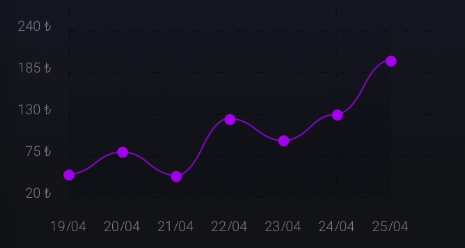
React-native-chart-kit: Setup Range for example: from 20 to 240
I need to setup the y-axis values from 20 to 240. Is it possible to do that? Thanks in advance!
 jaysamligon7
All 8 comments
No, right now range is automatically calculated from data.
 Hermanya
on 21 Jan 2020
Hermanya
on 21 Jan 2020
@Hermanya is it possible to have updates about range?
jaysamligon7
on 22 Jan 2020
Pull Request is welcome!
Hermanya
on 22 Jan 2020
+1 this functionality would be _awesome_ to have. @Hermanya is there any way you could make this update? I've been looking through the code and would do it myself, but you're obviously much more familiar! If you can't, could you point me in the direction of where to start? I would really like this functionality. Thanks!
 millro04
on 14 Mar 2020
millro04
on 14 Mar 2020
I'd look into sec/abstract-chart.js in the methods where labels are rendered. The code is in pretty poor condition, and I haven't actively worked on it for awhile. I've been busy with work and life and stuff 😅 @millro04
Hermanya
on 14 Mar 2020
I found some kind of trick to do that. I needed to start my chart from 0, so I added another data to datasets array.
{
    data: [0],
    color: () => 'rgba(0, 0, 0, 0)',
},
This code adds totally invisible data to chart and chart starts from zero. Maybe you can do something like that for 20 and 240.
Just add those to your dataset:
{
    data: [20],
    color: () => 'rgba(0, 0, 0, 0)',
},
{
    data: [240],
    color: () => 'rgba(0, 0, 0, 0)',
},
 lahmacun
on 25 Apr 2020
lahmacun
on 25 Apr 2020
Hey,
I wanted this feature too, and looked at src/abstract_chart.js as suggested. I think I came up with a way around this. In my case, I will always be starting from zero in the graph, so I modified the following bit, at the top of the file. Additionally, I know that 600 will be the max y value. By having calcScaler return 600 the y axis starts at zero and ends at 600. Furthermore, by setting segments to 6 in the line chart component, the y axis increments by 100. Hope this helps. Not sure how stable this is, but it seems to work for my use case.
class AbstractChart extends Component {
calcScaler = data => {
if (this.props.fromZero) {
return 600; // ORIGINAL CODE Math.max(...data, 0) - Math.min(...data, 0) || 1;
} else {
return Math.max(...data) - Math.min(...data) || 1;
}
};
 tj-boutorwick
on 27 May 2020
tj-boutorwick
on 27 May 2020
There is a solution here given by @BishoyBishai
 PhillipFraThailand
on 6 Jul 2021
PhillipFraThailand
on 6 Jul 2021
Related issues
 bhoomika911
·
4Comments
bhoomika911
·
4Comments
 NS-BOBBY-C
·
5Comments
NS-BOBBY-C
·
5Comments
 Danjavia
·
5Comments
Danjavia
·
5Comments
 LillyBrainy
·
4Comments
LillyBrainy
·
4Comments
 stebogit
·
3Comments
stebogit
·
3Comments
Most helpful comment
I found some kind of trick to do that. I needed to start my chart from 0, so I added another data to datasets array.
This code adds totally invisible data to chart and chart starts from zero. Maybe you can do something like that for 20 and 240.
Just add those to your dataset: